CDC - CDC: 4.15% Index Yield But No Longer Worth Your Money
2023-03-27 06:50:52 ET
Summary
- CDC follows a long/cash strategy that exits equities in favor of Treasuries as markets decline. The Index currently yields 4.15%, or 3.80% after fees if the fund is fully invested.
- Selections have four consecutive profitable quarters, but comparisons with alternative high-dividend funds suggest it's an insufficient screen. It's why Regional Banks still make up 7% of the portfolio.
- Poor quality is a risky feature in any market, but especially in recessions. Fundamentals from SPHD and LVHD, two similarly-constructed ETFs, suggest combining high dividends and low volatility doesn't work.
- Instead, I recommend readers explore SCHD, VYM, and HDV, three low-cost alternatives with a superior combination of volatility, growth, valuation, yield, and quality.
- CDC isn't a poor ETF, but it's far from optimal. For this straightforward reason, I've decided to downgrade the fund to a sell.
Investment Thesis
It is with some regret that I've decided to downgrade the VictoryShares US EQ Income Enhanced Volatility Weighted ETF (CDC) today. I was the first Seeking Alpha contributor to cover it in detail in June 2021, and I enjoyed describing CDC's three layers of portfolio protection, testing its unique long/cash strategy over the last 20 years, and contrasting it with more popular high-dividend ETFs. Still, I should have listened to my instincts over the previous few quarters. The writing was on the wall, indicating how CDC was overly risky with declining earnings momentum. In fairness, the latest semi-annual reconstitution was somewhat beneficial, but I no longer view it as positively as other competing high-dividend ETFs. I look forward to discussing my reasons for the downgrade in more detail next.
CDC Overview
Strategy Discussion
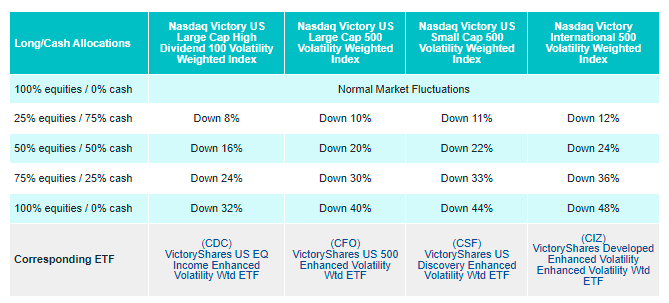
CDC tracks the Nasdaq Victory US Large Cap High Dividend 100 Long/Cash Volatility Weighted Index, a unique Index that reallocates to U.S. Treasuries according to the specific rules described below.
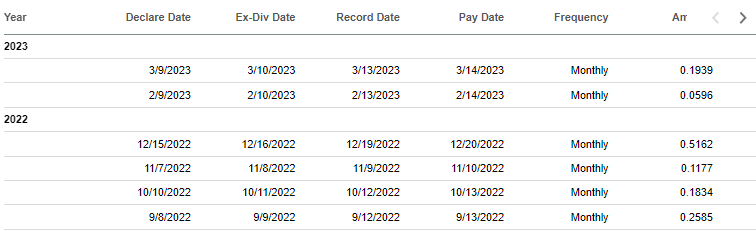
In July 2022, I tested the strategy over the last 20 years and determined it was only reasonable for investors to profit from the system by approximately 50%. One key benefit was psychological. Shareholders had higher confidence they wouldn't be wiped out, even if it meant missing out on a significant recovery. However, the tradeoff was the movement to U.S. Treasuries indicated lower distributions. As shown below, January's was missed entirely, and February's $0.0596 distribution was low.
I couldn't connect with a Victory Capital representative regarding the timing of the January distribution. Unfortunately, attempts via e-mail, phone, and direct messages were unsuccessful. The experience reaffirmed how crucial regular payments are for some investors. The Index yields 4.15%, and after accounting for fees and the potential not to be fully invested, a yield below 3.50% could be more accurate. Income investors may not find this adequate.
In addition, there is a potential flaw in the security selection process, which begins with the 500 largest U.S. securities (excluding REITs). Those without four consecutive profitable quarters are removed, and the top 100 highest-yielding securities are weighted inversely by their 180-day standard deviation of price returns. It sounds reasonable, but you might be surprised that CDC's profitability score is routinely lower than what other high-dividend ETFs offer. It's also not materially less volatile than the alternatives, so I've quickly run out of reasons to recommend CDC.
Sector Exposures
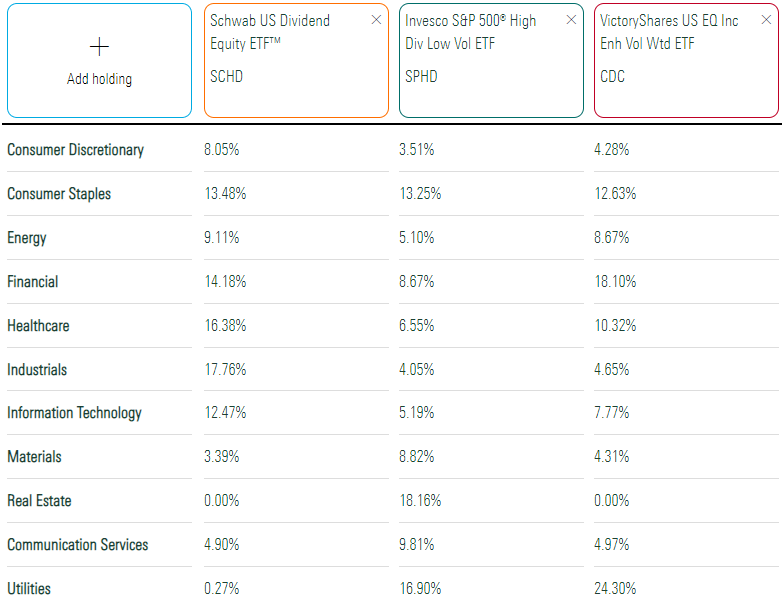
The following table highlights CDC's sector exposures as of March 23, 2023. I've also provided exposures for the Schwab U.S. Dividend Equity ETF ( SCHD ) and the Invesco S&P 500 High Dividend Low Volatility ETF (SPHD).
CDC overweights Utilities but differs from SPHD because it has no Real Estate exposure. As a result, more of its distributions are considered qualified for tax purposes. CDC also has 18% exposure to the Financials sector, including 7% in Regional Banks. It's common for high-dividend ETFs to hold these riskier banks, but this level may be too high. SCHD's exposure is less than 4%, and it's because its four quality screens are superior.
CDC's top holdings are listed below, including Johnson & Johnson ( JNJ ), Coca-Cola ( KO ), and Kimberly-Clark ( KMB ). However, the total weight is just 15.25%, indicating that it's nearly an equal-weight fund. The reason is that the range of standard deviation figures among large-cap stocks is tight. It would be very unusual for one stock to be 3-5x more volatile than another, but not so much on market capitalization.
CDC Additions: March 2023 Semi-Annual Reconstitution
The latest Index reconstitution added 19 securities, as follows.
The additions are almost always yield-driven because that's the primary screen. Collectively, these securities declined by about 2% from October 2022 to March 2023, but Coca-Cola was the exception, with an 8.52% increase. The Index also added seven Utility companies currently trading at about 20% of their annual price position. These depressed prices increase yields, so these changes are expected with such a limited screening process.
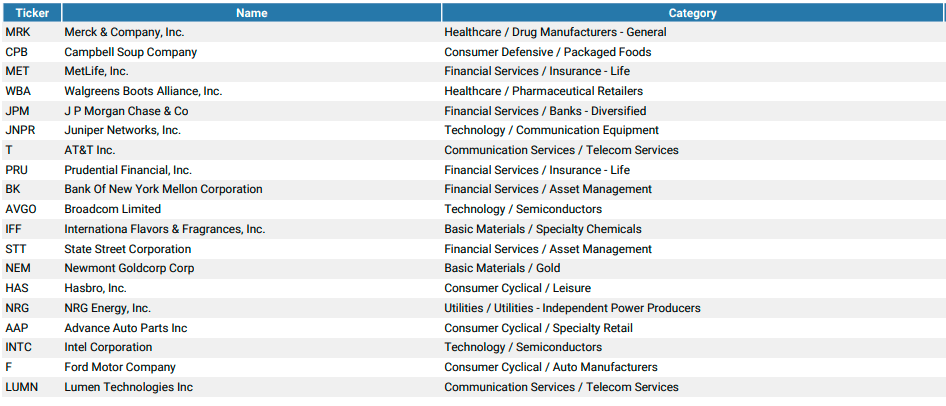
CDC Deletions: March 2023 Semi-Annual Reconstitution
The Index also deleted 19 stocks, as shown below. Unlike the additions, most of these stocks performed well, gaining nearly 8% on a weighted-average basis. Merck & Co. ( MRK ), JPMorgan Chase ( JPM ), Juniper Networks ( JNPR ), and AT&T ( T ) all gained 20%+, so the changes reflect some basic profit taking.
Profit-taking is often well-advised. However, the deletions are generally of higher quality. Using adjusted Seeking Alpha Factor Grades, the deletions have an average 8.46/10 profitability compared to 7.81/10 for the additions.
CDC Analysis
Performance
Since its July 2014 launch, CDC has gained an annualized 9.65% vs. 11.03% and 7.49% for SCHD and SPHD. Its volatility and lower maximum drawdown figures are the appeal, leading to a competitive 0.69 Sharpe Ratio, a standard measure of risk-adjusted returns.
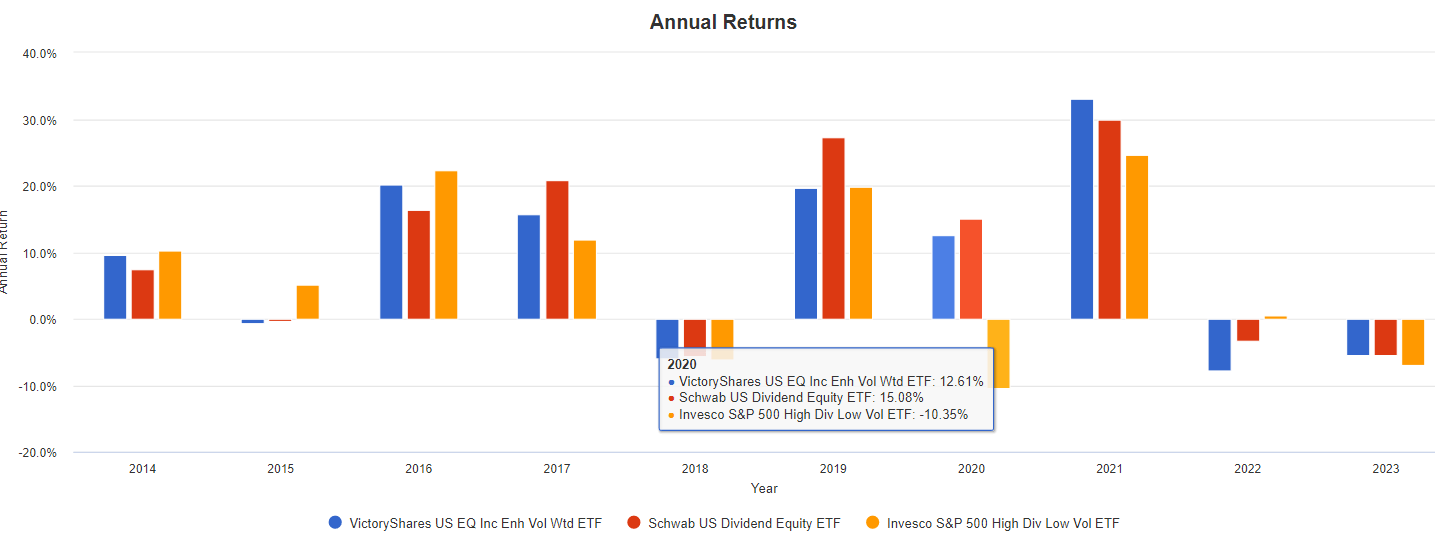
However, the above graph tells only part of the story. A look at the annual returns highlights how CDC's returns in 2020 were exceptional compared to SPHD, primarily because it exited equities before the March 2020 crash. In the eight full years between 2015-2022, CDC outperformed SCHD and SPHD only two and four times, respectively. The vast majority of outperformance vs. SPHD is linked to 2020's 22.96% beat, arguably a year unlikely to repeat.
Fundamentals
The following table highlights selected fundamental metrics for CDC's top 25 industries, which total 85% of the portfolio. At the top are Electric and Multi-Utilities, followed by Regional Banks, Packaged Foods & Meats, and Biotechnology. There's a mix of high- and low-beta stocks, but most of the additional risk is driven by Financials and Energy. If you recall, SPHD has half the total exposure to these two sectors.
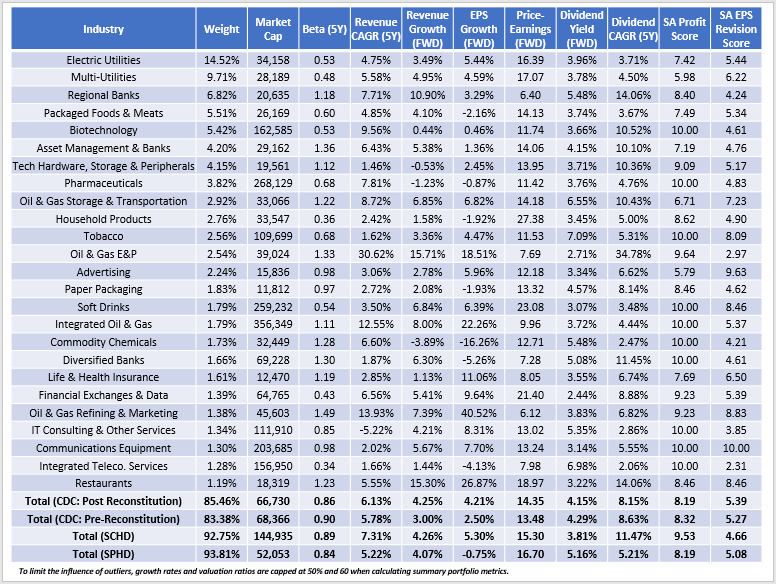
The table summarizes the impact of the reconstitution changes, but I want to highlight CDC's 8.19/10 profitability score, identical to SPHD. Also relevant is the 8.40/10 score for the Legg Mason Low Volatility High Dividend ETF ( LVHD ), which suggests combining the two factors sacrifices quality. Given CDC's lower earnings growth rate and commensurate cheaper valuation, I find few reasons to select it over the much higher quality SCHD.
SCHD isn't necessarily the optimal ETF in the current environment, either. I recently described issues related to future growth and earnings revisions, both noted above. Most high-dividend ETFs suffer from these problems, but a few look superior. The following table summarizes fundamental statistics for ten alternatives. I screened my database for ETFs with a trailing dividend yield above 3%, a five-year beta below 0.90, and assets above $100 million.
In this sample, CDC is near the median on beta, estimated sales and earnings growth, gross dividend yield, and profitability score. Its 0.35% expense ratio is high, but its valuation and EPS revision score are below the median. Most have tradeoffs, but arguing against the Vanguard High Dividend Yield ETF ( VYM ) is hard. The sacrifice is yield, but after expenses and assuming CDC remains fully invested, the difference is only 0.59%. In exchange, you'll gain diversification and quality while maintaining sufficient earnings momentum. If diversification isn't your concern, then the iShares Core High Dividend ETF ( HDV ) is another choice worth exploring that yields 3.84% after fees.
Investment Recommendation
CDC is no longer a standout fund. There are several alternatives with better growth and profitability metrics, and I want to prioritize these factors regardless if we enter a bull or bear market. Furthermore, the 4.15% Index yield is reduced by a 0.35% expense ratio and the potential for the fund to be only partially invested. This feature means distributions are more variable, and although not a significant concern for me, it can be for investors requiring a predictable income. As a result, I no longer recommend readers buy CDC, and I look forward to the discussion in the comments section below.
For further details see:
CDC: 4.15% Index Yield, But No Longer Worth Your Money