QVMS - CDT Insider Sentiment Ratio - February 2023: Below Normal Sentiment
Summary
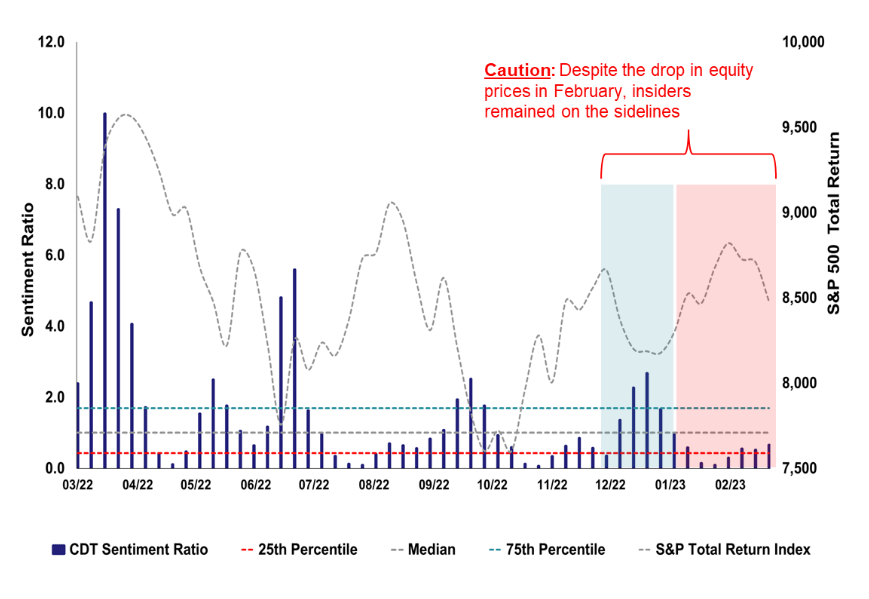
- For the month of February, the S&P 500 Total Return Index ended down -2.4%. What disrupted the January rally?
- During the month, we received some affirming data that the economy may be on firmer footing than economists previously thought. But markets are worried that such strong economic indicators could push the Fed to an even more aggressive monetary stance.
- As for insiders, they were not enticed by the February market discount. In the context of the global economic uncertainty and relatively high market valuations, their sentiment level remains historically low.
Fasten your seatbelts
We expected turbulence, and turbulence we got. For the month of February, the S&P 500 Total Return Index ended down -2.4%. What disrupted the January rally? Well, so far as the equity markets are concerned, it appears that good news is now bad news. During the month, we received some affirming data that the economy may be on firmer footing than economists previously thought. The more salient economic data points during the month included:
-
Nonfarm Payrolls jumped by +517,000
-
Unemployment dropped to 3.4% (lowest in 54-years)
-
Retail sales jumped +3% (expected estimate of +1.9%)
-
Consumer Price Index increased +.5% MoM and +6.4% YoY
The green arrows on these datapoints suggest an acceleration of economic momentum, which, under normal circumstances, would be a welcome development. However, in the context of the Federal Reserve’s (“Fed”) fight to tame inflation, financial markets are worried that such strong economic indicators could push the Fed to an even more aggressive monetary stance - or put another way, increase interest rates to a higher level than forecasted. The logic of interpreting good news as bad news seems illogical, but when you think about the forward-looking nature of the beast, then things make alittle more sense. Essentially, for market participants it seems silly to celebrate the good data when that same good data may incentivize the Fed to increase interest rates and potentially cause a recession - which is undoubtedly bad news; thus good news is bad news, do you follow? Not to mention that higher interest rates make fixed-income securities more appealing, which draws capital out of the stock market and into the bond markets.
As for insiders, they were not enticed by the February market discount. In the context of the global economic uncertainty and relatively high market valuations, their sentiment level remains historically low. In light of their bleak sentiment, we believe that it is not yet time to lift the fasten seatbelt sign.
Expect some more turbulence ahead.
How it Works
Objective :
Predictive model that measures the historical relationship between insider sentiment and the future probability of downside volatility (risk).
Insider Trading Activity:
Purchase activity of an insider’s own stock filtered by proprietary parameters to scrub noisy data.
Insight:
Executive-level sentiment is an indicator of near-term term financial market risk.
- Low executive sentiment suggests a high level of risk
- High executive sentiment suggests a low level of risk
Scale:
A ratio of current insider trading activity in relation to historical patterns.
- (0 to ?) with a median measure of 1
- Below 1 implies an above normal level of risk
- Above 1 implies a below normal level of risk
Frequency:
CDT updates this metric daily and historically been subject swift and possibly extreme shifts.
*This webpage is updated monthly and provides just a snapshot of the most recent month-end.
Disclosures
This presentation does not constitute investment advice or a recommendation. The publisher of this report, CDT Capital Management, LLC (“CDT”) is not a registered investment advisor. Additionally, the presentation does not constitute an offer to sell nor the solicitation of an offer to buy interests in CDT’s advised fund, CDT Capital VNAV, LLC (“The Fund”) or related entities and may not be relied upon in connection with the purchase or sale of any security. Any offer or solicitation of an offer to buy an interest in the Fund or related entities will only be made by means of delivery of a detailed Term Sheet, Amended and Restated Limited Liability Company Agreement and Subscription Agreement, which collectively contain a description of the material terms (including, without limitation, risk factors, conflicts of interest and fees and charges) relating to such investment and only in those jurisdictions where permitted by applicable law. You are cautioned against using this information as the basis for making a decision to purchase any security.
Certain information, opinions and statistical data relating to the industry and general market trends and conditions contained in this presentation were obtained or derived from third-party sources believed to be reliable, but CDT or related entities make any representation that such information is accurate or complete. You should not rely on this presentation as the basis upon which to make any investment decision. To the extent that you rely on this presentation in connection with any investment decision, you do so at your own risk. This presentation does not purport to be complete on any topic addressed. The information in this presentation is provided to you as of the date(s) indicated, and CDT intends to update the information after its distribution, even in the event that the information becomes materially inaccurate. Certain information contained in this presentation includes calculations or figures that have been prepared internally and have not been audited or verified by a third party. Use of different methods for preparing, calculating or presenting information may lead to different results, and such differences may be material.
Editor's Note: The summary bullets for this article were chosen by Seeking Alpha editors.
For further details see:
CDT Insider Sentiment Ratio - February 2023: Below Normal Sentiment