ECAT - CEFS: Solid Performance But High Fees
2023-11-06 20:28:19 ET
Summary
- Saba Closed-End Funds ETF is a closed-end fund arbitrage strategy that seeks to provide high levels of income.
- CEFS has a high annual fund operating expense of ~2.9%, significantly higher than the average expense ratio for mutual funds and ETFs.
- The Fund has underperformed the S&P 500 since its launch in 2017 but has been significantly less volatile.
- CEFS has outperformed the traditional 60/40 portfolio since its inception.
- Investors looking to take advantage of closed-end fund discounts may want to consider direct investments as opposed to CEFS to avoid the fees.
ETF Overview
The Saba Closed-End Funds ETF ( CEFS ) seeks to generate high income by investing in closed-end funds trading at a discount to NAV while hedging interest rate exposure. The fund is actively managed by Saba Capital portfolio managers who have years of experience investing in closed-end funds.
CEFS currently has net assets of $128 million and charges a management fee of 1.10%. When accounting for other fund fees and additional fund fees charged by funds held by CEFS, the total annual fund operating expenses are 2.9%.
CEFS currently holds 136 different securities.
Very High Total Fee Product
CEFS's annual fund operating expenses are 2.9% of the fund. To put that into context, the average expense ratio for an actively managed equity mutual fund is ~0.66% and the average equity ETF expense ratio is ~0.16%. Moreover, the average return of a 60/40 portfolio over the past 30 years has been ~7.7%. This comparison is relevant as CEFS holds ~55% of equity closed-end funds and 45% of fixed-income funds. Thus, the annual operating expense for CEFS amounts to ~38% of the entire expected return of a typical 60/40 portfolio.
CEFS annual fund operating expenses are extremely high due to a double layer of fees. CEFS charges a 1.1% management fee which is in addition to very high fees charged by the underlying closed-end funds that CEFS holds.
As an investor, I work diligently to avoid high management fees (active or passive) as I believe they are often an overlooked headwind when investing.
Historical Performance Analysis
CEFS launched in Mach 2017 and has significantly underperformed the S&P 500 since then. CEFS has delivered a total return of 61.7% compared to a total return of 103.5% delivered by the S&P 500. However, that is not a fair benchmark as CEFS has exhibited significantly less volatility than the S&P 500.
Since its inception, CEFS has had an average 30-day realized volatility of 11.99%. Comparably, during the same time period the S&P 500 had an average 30-day realized volatility of 16.17%. Moreover, CEFS has exhibited an average beta of 0.77 to the S&P 500 suggesting the fund is significantly less risky.
CEFS has performed better than a traditional balanced portfolio such as a 60/40 portfolio, which can be proxied by the Vanguard Balanced Index Fund ( VBIAX ) or the iShares Core Growth Allocation ETF ( AOR ). AOR is currently allocated 60% to global equities and 40% to fixed income. CEFS 61.7% total return compares favorably to both VBIAX and AOR. In terms of volatility, CEFS's average 30 day realized volatility of 11.99% compares to 30 day realized volatility of 10.99% for AOR.
Strong Recent Relative Performance
As shown by the chart below, CEFS has exhibited very strong relative performance over the past two years. CEFS delivered a total return of 1.6% compared to -4% for the S&P 500, -9.7% for AOR, and -10% for VBIAX.
On a relative basis, CEFS has benefited from its interest rate hedge strategy which mitigated interest rate risk associated with the fixed-income closed-end funds that it holds. Additionally, CEFS has executed well on its active closed-end fund arbitrage strategy.
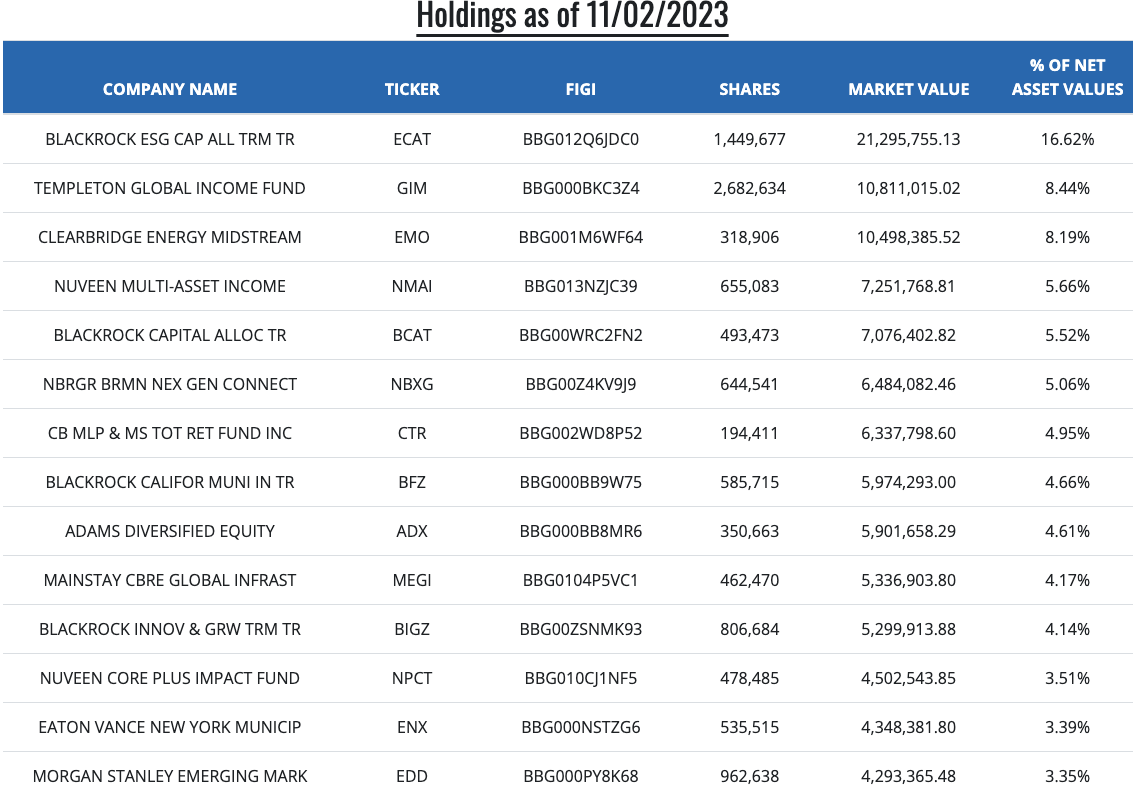
Holdings Analysis
CEFS is somewhat concentrated with the top 5 holdings accounting for ~44.4% of the fund. One standout position is the fund's 16.6% holding of the BlackRock ESG Capital Allocation Trust (ECAT) which currently trades an 11.8% discount to NAV. BlackRock funds make up a particularly large portion of CEFS investments accounting for ~33% of fund holdings.
Saba Capital Management, which manages CEFS, has been involved in a major battle with BlackRock ( BLK ). Saba is aiming to for BlackRock to make changes that close the discount that various BlackRock closed-end funds are trading at versus NAV. Saba aims to elect outsiders to various fund boards and force changes to close the gap vs NAV. Potential changes include actions such as converting funds to open-end portfolios or selling underlying assets to repurchase fund shares.
Saba is currently suing BlackRock regarding control-share provisions and has won similar lawsuits against asset manager Nuveen and Eaton Vance in recent years.
Conclusion
CEFS is a unique product in that it is focused on closed-end fund arbitrage. While the fund has underperformed the S&P 500 historically, it has experienced much less volatility than the S&P 500.
CEFS has been able to outperform traditional asset allocation strategies such as a traditional 60/40 strategy and the iShares Core Growth Allocation ETF ( AOA ) with only slightly more volatility. Moreover, CEFS has posted particularly strong performance over the past two years as traditional asset allocation strategies have been hurt by exposure to rising rates.
Currently, CEFS has a large exposure to funds managed by BlackRock and is engaged in litigation in an attempt to force changes that may narrow the discount to NAV on various BlackRock-managed funds.
CEFS represents a differentiated product and has delivered solid results for investors. However, I am concerned about the very high total fee of ~2.9% and CEFS ability to continue to overcome this fee moving forward. Additionally, I believe some of CEFS strength relative to other moderate allocation products such as a VBIAX or AOR has been due in part to a lack of interest rate exposure.
The past two years have represented historically bad performance for bonds. If bonds perform better going forward, I am not convinced that CEFS will be able to outperform these low fee strategies.
Investors who are interested in benefiting from the narrowing of closed-end fund discounts could consider purchasing select closed-end funds held by CEFS and avoid the additional layer of management fees. However, this strategy differs to some degree from the strategy employed by CEFS since CEFS is hedging out interest rate exposure.
For further details see:
CEFS: Solid Performance But High Fees