CENX - Century Aluminum: A 7-Foot Bar To Jump Over
2024-01-19 11:36:39 ET
Summary
- CENX is a cyclical company with declining operating performance leading to poor fundamentals. It also has a poor financial position with a high Debt to Capital ratio.
- It should be undergoing a turnaround. But its poor operating track record together with 2/3 of its sales to its controlling shareholder, Glencore, makes this challenging.
- Its poor fundamentals led to negative earnings in my valuation model. This meant a negative EPV. This is not an investment opportunity.
Investment thesis
Century Aluminum ( CENX ) is a cyclical company in a low-growth sector. At the same time, more than 2/3 of its sales are to its controlling shareholder, Glencore (GLNCY).
This is a company with poor fundamentals. Its returns are lower than its cost of funds. It also faced declining operating performance. All points to a company that needs to be turned around.
However, given it poor track record and its supply relationship with Glencore, a turnaround may be challenging. Together with its negative Earnings Power Value due to the low returns, I would not consider this an investment opportunity.
Business background
CENX is a global producer of primary aluminum and operates aluminum reduction facilities, or "smelters," in the United States and Iceland.
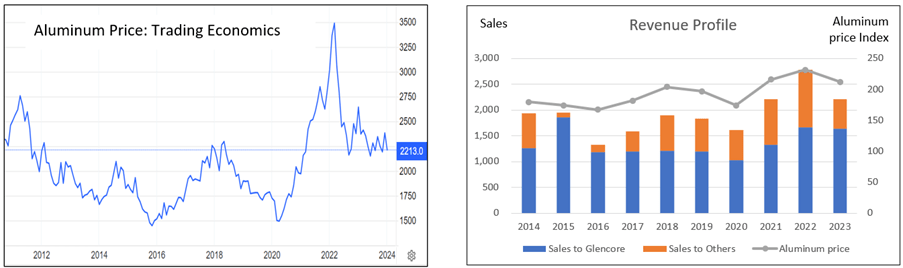
Aluminum is an internationally traded commodity with cyclical prices as can be seen from the left part of Chart 1. This makes CENX a cyclical company as clearly illustrated in the right part of Chart 1. There is a 0.88 correlation between CENX revenue and the aluminum price index from 2014 to 2023.
From 2014 to 2023, CENX’s revenue grew by 1% CAGR. You can see the revenue peaking in 2022 in tandem with an aluminum price spike.
Chart 1: Aluminum Price and CENX Revenue Trends (Trading Economies, Author)
Notes to Chart 1:
a) I have used the Sep LTM results to represent the 2023 performance for CENX.
b) The aluminum price index was based on the annual average FRED Producer Price Index for aluminum sheets, plates, and foil.
CENX went public with an initial public offering in 1996 and continues to be publicly traded on NASDAQ today. However, Glencore, one of the world’s largest globally diversified natural resource companies, has a 46% interest in CENX.
As can be seen from the right part of Chart 1, sales to Glencore accounted for a significant part of CENX’s annual revenue. Over the past decade, these related-party sales ranged from 60% to 95 % with an average of 71 % of CENX’s annual revenue.
Effectively I believe CENX operates like an in-house supplier to Glencore.
Thrust of my analysis
I first covered CENX in April 2023 when I concluded that CENX is not a growth stock in a low-growth sector. Refer to “ Century Aluminum Is Not A Growth Stock”.
- The demand for aluminum in North America grew from 23.0 billion pounds in 2011 to 27.5 billion pounds (estimated) in 2022. This is equal to 1.6 % CAGR.
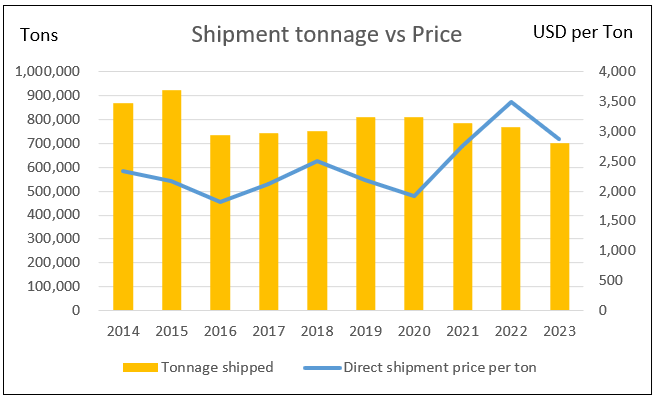
- There has not been any growth in CENX’s shipment volume. The revenue growth over the past 3 years was due to increases in selling price. This is clearly illustrated in Chart 2.
Chart 2: Shipment tonnage vs Unit price (Author)
Note to Chart 2: The 2023 data was extrapolated from the YTD Sep 2023 data .
Given the high related-party sales and the 46% controlling interests of Glencore, it may be more meaningful to compare CENX's performance with a panel of large public-listed global aluminum producers.
I selected the following as the peers to compare with:
- Alcoa. This NYSE company specializes in the production of aluminum, alumina, and bauxite.
- China Hongqiao. Based in China, this is one of the largest aluminum producers in the world.
- Hindalco. This Indian company produces and sells aluminum and copper products in India and internationally.
- Norsk Hydro. This is a Norwegian multinational aluminum and renewable energy company.
As can be seen from Table 1, CENX is a relatively small player compared to the peers.
Table 1: 2023 Peer revenue and total assets (Author)
The data for the various companies were taken from the TIKR.com platform. Except for Hindalco which has its FYE in March, I have used the latest LTM 2023 results for each of them to represent the 2023 performance.
CENX’s operating performance
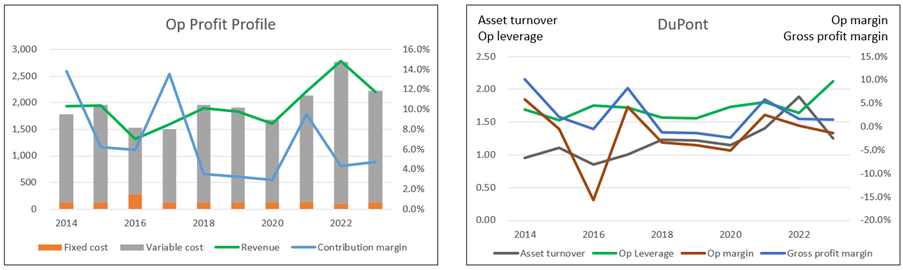
I broke down the operating profits into revenue, fixed costs, and variable costs. Refer to the left chart in Chart 3.
In the chart, the gap between the revenue and total costs (fixed costs and variable costs) represents the operating profit. Over the past decade, CENX only generated operating profits for 4 out of the 10 years.
Chart 3: Operating trends and Dupont trends (Author)
Notes to Chart 3:
a) I broke down the operating profits into fixed costs and variable costs.
- Fixed cost = SGA, R&D, Depreciation & Amortization and Other expenses.
- Variable cost = Cost of Sales – Depreciation & Amortization.
- Contribution = Revenue – Variable Cost.
- Contribution margin = Contribution/Revenue.
b) The after-tax net operating profit (NOPAT) was derived by deducting a nominal tax from the operating income. If there was an operating loss, I assumed a zero tax rate.
CENX did not have a good operating track record:
- Over the past decade, revenue grew at 1.5 % CAGR.
- Gross profitability (gross profits/total assets) declined from 9.7 % in 2014 to 1.9 % in 2023.
- It has a volatile contribution margin ranging from 2.9 % to 13.8 % with an average of 6.8 %.
- NOPAT reduced from USD 40 million in 2014 to a net operating loss of USD 28 million in 2023. This led to a declining operating return (NOPAT/capital employed) of 9.4 % in 2014 to negative 3.4 % in 2023.
- ROE over the past decade averaged a negative 13.5 %.
A DuPont analysis (refer to the right part of Chart 3) showed the following:
- Operating margin was volatile. This was due to the volatile and declining gross profit margin.
- There was an uptrend in leverage i.e. not good as this means more debt.
- The only positive sign was the uptrend in asset turnover i.e. better capital efficiency.
All the above paints a deteriorating business performance in need of a turnaround.
Financial position
I would rate CENX's financial position as poor based on the following:
- It has a 52 % Debt Capital ratio as of the end of Sep 2023. As per the Damodaran Jan 2023 dataset, the Debt Capital ratio for the metals/mining sector was 18%.
- As of the end of Sep 2023, it had USD 70 million in cash. This was about 4 % of its total assets.
- It did not have a good capital allocation plan as shown in Table 2. The cash flow from operations was not sufficient to fund the Net CAPEX and acquisitions. It had to increase its Net Debt for this.
Table 2: Source and Uses of Funds 2014 to 2023 (Author)
Note to Table 2: Net CAPEX refers to capital expenditure after deducting for asset sales.
The only positive point was its cash flow generation. Over the past decade, it generated positive cash flow from operations for 8 out of the 10 years. In total, it generated USD 290 million in cash flow from operations compared to a total loss of USD 770 million. This is an excellent cash conversion ratio.
Note that since 46% is owned by Glencore, financial institutions might give CENX a bit more leeway when looking at its financial position.
Peer comparison
Warren Buffett opined the following when it comes to assessing management:
"… I think you can learn a lot about that by reading about both what they've accomplished and what their competitors have accomplished, and seeing how they have allocated capital over time."
I have already commented on the CENX capital allocation plan. In this section, I will look at how CENX performed relative to the peers. The metrics I looked at are those that are key to the valuation of companies. These are growth, returns, and financial position (as a proxy for risk).
The results are shown in Tables 3 to 5. CENX was the worst performer among the peers.
- Its growth rates were either the worst or among the worst.
- It achieved the worst returns on all the return metrics.
- It ranked among the worst for the 2023 long-term solvency metrics.
Table 3: Growth rates from 2014 to 2023 (Author) Table 4: 2014 to 2023 Returns (Author) Table 5: 2023 Long-term solvency (Author)
To be fair to CENX, it is not an exact apple-to-apple comparison as the peers do have other products than just alumina or aluminum. But it makes you wonder whether to turn around the business, CENX has to both diversify its product base and increase its size.
Table 6 gives you a sense of why CENX returns are poor. CENX's margins are very significantly lower than those of its peers.
Table 6: 2014 to 2023 Average margins (Author)
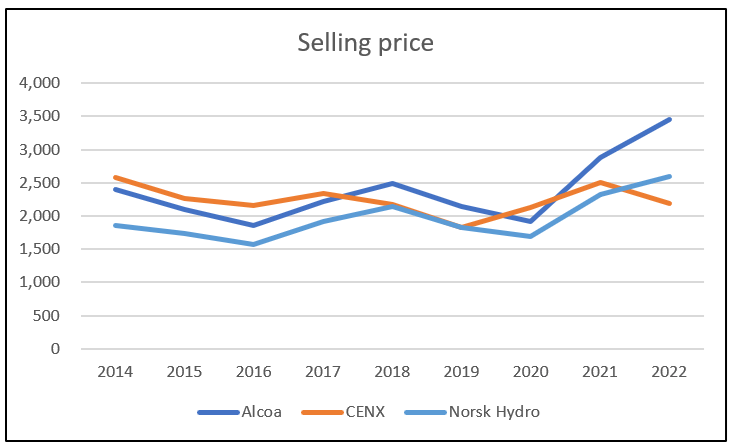
I believe this begs the question of whether its sales to Glencore are on an arms-length basis. One way to answer this was to see whether there were persistently lower unit selling prices for CENX.
Chart 4 compares the selling price trends for aluminum for the 3 companies with selling price data. The results do not show any consistent lower pricing by CENX. The poor results is not due to low "transfer pricing."
To quote Sherlock Holmes:
“When you have eliminated the impossible, whatever remains, however improbable, must be the truth."
The poor performance of CENX is either due to poor business economics and/or poor management for not addressing the poor business economics in my opinion.
Chart 4: Peer selling price trends (Author)
Can the business be turned around? One turnaround plan is to reverse the direction of the various operating parameters. Internally this meant driving improvements in productivity and operating efficiencies. I am not sure whether this is likely given the poor track record.
The company seemed to have problems increasing its shipment volume. The other option is to diversify into other aluminum-related products. But I am not sure this is possible in the short term given the “inhouse supply” situation.
Valuation
Given its cyclical nature and low growth record, it is more appropriate to value CENX based on its Earnings Power Value.
EPV of the firm = (Free Cash Flow to the Firm or FCFF) / WACC
FCFF = NOPAT
NOPAT = Revenue X Contribution margin – Fixed costs
Revenue = Shipment volume X Selling Price
Value of Equity = EVP + Cash – Debt – Minority Interests
The key variables in my valuation model are thus volume, price, and contribution margin.
I did not consider fixed costs as a key variable which averaged only 8% of the total costs. Refer to the left part of Chart 3.
As mentioned in my earlier article, as a cyclical company, we should consider the “normalized” price and margins over the cycle. As per Chart 1, I took the latest cycle to be 2011 to 2023.
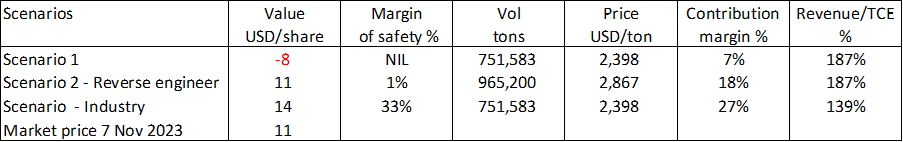
I looked at 3 Scenarios.
- Scenario 1 – This is my expected one where the volume is based on the past 3 years' average volume. The price, contribution margin, and capital turnover (revenue/TCE) are the respective 2011 to 2023 average cycle values.
- Scenario 2 – This is to reverse-engineer the market price by assuming a shipment volume of 95% of its capacity. I took the 2023 price to represent the cycle price by looking at Chart 1. The contribution margin was the one that would result in a value that was equal to the market price.
- Scenario 3 – This used the past 3 years' volume but the peer average values for the other variables. This is a wishful Scenario.
The results are summarized in Table 7. You can see that there is no margin of safety under Scenario 1. The negative value arose because the NOPAT was negative.
Scenario 2 suggests that the market is pricing CENX as if it can improve its shipment, price, and contribution margin. The is not supported by the historical performance.
Scenario 3 probably suggests what CENX could be if it expands its product base and increase its size.
Note that in the Glencore 2022 Annual Report, its carrying value for CENX was equal to USD 5.50 per share.
Table 7: Summary of valuation (Author)
Single-stage valuation model
I valued CENX using the Free Cash Flow to the Firm (FCFF) model as shown in Table 8.
Table 8: Sample calculation (Author)
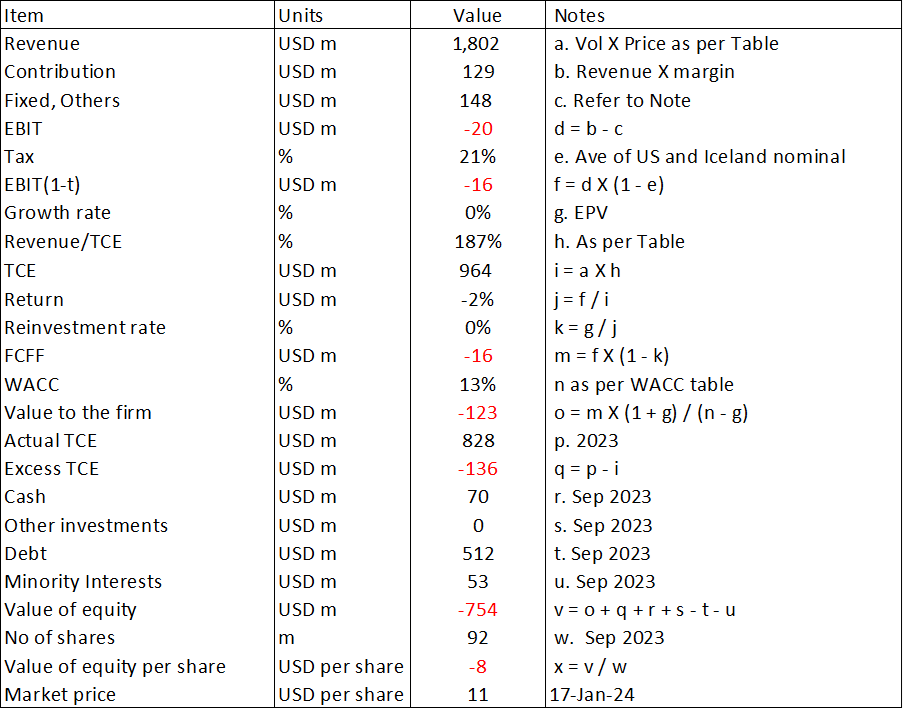
The WACC used in the model was derived based on the first page results of the Google search for the term “Century Aluminum WACC”. Refer to Table 9.
Table 9: WACC (Various)
Risks and limitations
There are 3 issues in my analysis and valuation of CENX.
- Poor fundamentals.
- High WACC.
- Standalone operations.
I have painted CENX as a company with poor fundamentals. Generally, a company in such a situation would be undertaking a turnaround. Accordingly, any valuation would be based on a more optimistic future assuming that the company can turn around.
I did not do this as I am not sure about any turnaround. CENX acts as a close supplier to Glencore. As such I am not sure whether there would be any change in the business model.
The other issue is the high WACC. According to Damodaran, the WACC is a way to bring risk into the valuation. A high WACC represents riskier cash flows. No doubt the WACC does reflect the current political-economic situation with the Ukraine invasion and the Gaza conflict. The high WACC would mean a lower valuation. But given the poor financial position, I would not look for a lower WACC.
About 2/3 of CENX's sales are to Glencore. At the same time, Glencore controls 46% of CENX. While I have analyzed CENX as a "standalone" company, I don't think we can look at it without considering Glencore plans. I have not done this.
Conclusion
My fundamental analysis of CENX paints a company with poor fundamentals:
- Its average operating return of 7% is lower than the current WACC of 13 %. This implies that it did not create shareholders' value.
- It had deteriorating operating and capital efficiencies. These are exemplified by the declining contribution margin and gross profitability.
- It is not financially sound.
- It performed among the worst when compared to its peers.
I would rate CENX as a company in need of a turnaround. But I have concerns about CENX delivering this. For example:
- While the company had curtailed certain operations to cut costs, the results do not seem sufficient.
- In its 2022 Annual Report, the company stated that it had undertaken "... various expansion programs at all of our operating facilities and continue to pursue additional internal growth opportunities." But the numbers do not reflect this.
Given that I believe it serves essentially as an in-house supplier to Glencore, I am not sure whether creating shareholder value from a return perspective is a priority.
Together with the “negative” equity value, I do not think that this is an investment opportunity. To paraphrase Warren Buffett, CENX is a 7-foot bar to jump over. It may be better to hunt elsewhere for the 1-foot bar.
For further details see:
Century Aluminum: A 7-Foot Bar To Jump Over