CENX - Century Aluminum Is Not A Growth Stock
2023-04-30 06:44:31 ET
Summary
- CENX revenue grew faster than the demand for aluminum. Together with a 2 PBV multiple, you could think that this is a growth stock. But it is not.
- Revenue growth was partly due to the 2021/22 spike in commodity prices. But this is a sector with cyclical prices. The long-term aluminum price growth is only 1 % CAGR.
- PAT had not grown over the past 12 years. Gross profit margins were volatile without discernible growth trends. Production had to be curtailed.
- There are no fundamental reasons to support a growth picture. Also, a Greenwald Asset Value vs EPV analysis show that this is not a growth stock.
Investment Thesis
Century Aluminum Company ( CENX ) is currently trading at double its Book Value. Its LTM PE is negative. The PBV multiple is not justified as CENX is not a growth stock. While there are revenue growth, this did not translate into earnings growth.
There were no fundamental reasons for a growth thesis. At the same time, a Greenwald Asset Value-EPV analysis shows that this is not a growth stock. From a long-term value investment perspective, I would not invest in this stock.
Thrust of my analysis
CENX is a global producer of primary aluminum. It operates 3 aluminum smelters in the United States and one in Iceland. A Google search for the top 10 aluminum manufacturers in the US will throw up a list that includes CENX.
Over the past 12 years, its revenue grew at 6.7 % CAGR. According to the Aluminum Association , the demand for aluminum in North America grew from 23.0 billion pounds in 2011 to 27.5 billion pounds (est) in 2022. This is equal to 1.6 % CAGR.
Given CENX relatively higher growth rate, you could be forgiven for thinking that it is a growth stock. The stock is currently trading at about twice its Book Value. A high Price Book Value multiple is generally associated with a growth stock.
But I will show that CEX is not a growth stock. I will use two approaches to do this:
- I will look at whether there are fundamental reasons for high growth.
- I will use the Greenwald Asset Value vs Earnings Power Value analysis to assess whether it is a growth stock.
Sad to say, I could not find any fundamental reasons to drive high growth. Over the past 12 years,
- Shipment tonnage only grew at 2.2 % CAGR.
- Direct shipment price per ton grew at 2. 8 % CAGR. Ignoring the 2022 price spike, the long-term aluminum price grew at 1 % CAGR.
- Only about ¾ of the production capacity was used.
- There was no uptrend in the gross profit margin. Gross profit margins were also volatile.
- The PAT in 2022 was about the same level as that for 2011.
Furthermore, the Greenwald analysis shows that it is not a growth stock
CENX Performance
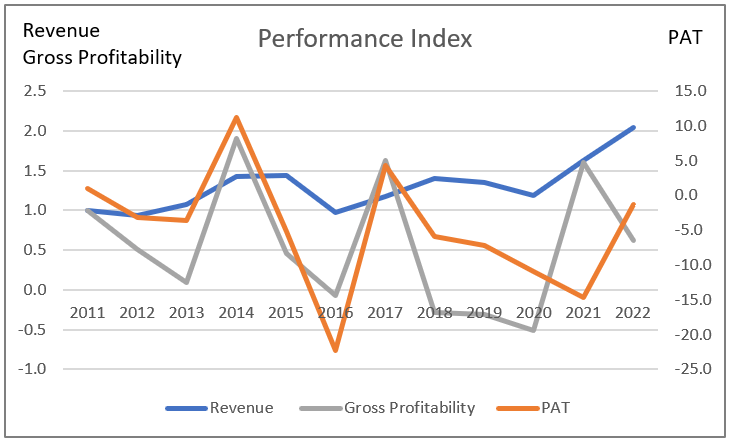
I used 3 metrics to assess CENX’s long-term performance – revenue, PAT, and gross profitability (gross profits/total assets). Chart 1 shows the trends of these 3 metrics over the past 12 years.
Chart 1: Performance Index (Author)
Note to Chart 1: The respective index was created by dividing the value for each year by the respective 2011 value.
While revenue grew at 6.7 % CAGR from 2011 to 2022, a big part came from the past 2 years when there were extraordinary aluminum price spikes.
More significant is that the 2022 PAT was about the same level as that in 2011. PAT was also very volatile compared to revenue. Looking at gross profitability, you would surmise that the PAT volatility was due to the volatility in the gross profits.
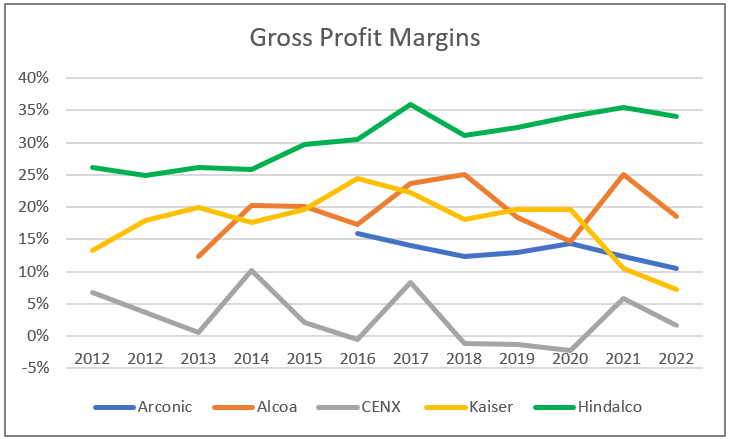
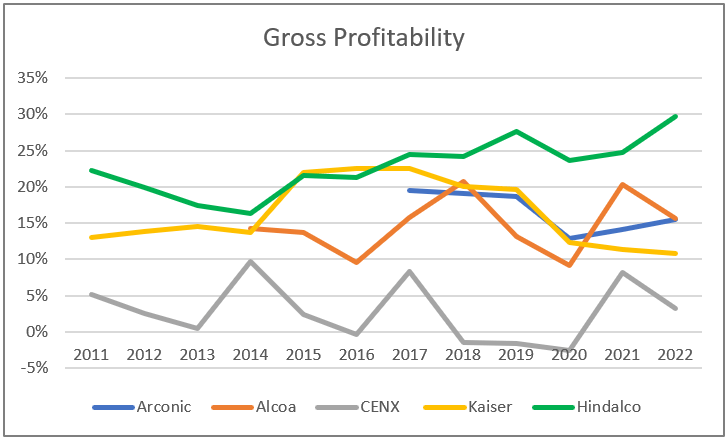
To get a better understanding of the gross profit volatility, I compared CENX’s gross profit margins with those of the top 4 peers. Refer to Chart 2.
Chart 2: Peer Gross Profit Margins (Author)
Notes to Chart 2:
a) The peers were based on the list of the top 10 aluminum companies in the US by Linquip. I selected those with annual sales of greater than USD 1 billion.
b) The top 5 included Aleris Rolled Products. In 2020 Aleris was acquired by Novelis Inc, a subsidiary of Hindalco. This is why I included Hindalco in the peer comparison
As you can see, CENX had the worst gross profit margins. It was even negative for some years. This is surely not a sign of a growth stock.
While the peers had some volatility in the gross profit margins, it was not as severe as that for CENX. Table 1 summarizes the coefficient of variation (standard deviation/mean) for the gross profit margins of the 5 companies. This metric measures the dispersion of the dataset relative to the mean. You can see that CENX was an outlier.
Table 1: Peer Coefficient of Variation - Gross Profit Margins (Author)
Capacity utilization
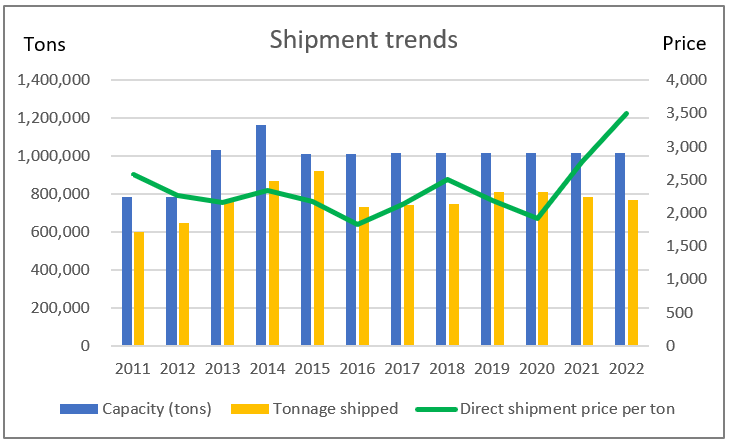
An analysis of the revenue growth showed that it was due to a combination of shipment tonnage and selling price growths. From 2011 to 2022, shipment tonnage grew at 2.2 % % CAGR while direct shipment price per ton grew at 2.8 % CAGR.
I would not consider tonnage growth as significant. This was because CENX had some acquisitions in 2013/14 that grew the capacity. You can see this clearly in Chart 3.
Chart 3: Shipment trends (Author)
But the bigger concern is that CENX has a long history of production curtailment. For most of the time over the past 12 years, CENX’s production was about ¾ of its capacity. The following extracts from its 2022 Form 10k illustrate this:
“…In the third quarter of 2022, we curtailed 100% of production at Hawesville. We expect that Hawesville's operations will remain curtailed until market conditions permit…”
“…In December 2020, we began a multi-year project to restore previously curtailed capacity at Mt. Holly. The initial phase was completed in the second quarter of 2022 and returned annual production capacity to approximately 172,000 MT per annum (75% of capacity).”
Other causes for the volatile gross profit margins
Was the gross profit margin volatility due to changes in tonnage and/or aluminum price fluctuations? A simple correlation analysis from 2011 to 2022 showed the following:
- 0.03 correlation between shipment tonnage and gross profit margins.
- 0.20 correlation between direct shipment price per ton and gross profit margin.
These suggest that the volatility in the gross profit margins is not attributable to changes in shipment tonnage or shipment price.
Cost of Sales
Mathematically, there would be gross profit margin volatility if the cost of sales is not correlated to the shipment selling price.
CENX did not break down its cost of sales. But, you can get an idea of the contribution of the various components from the following:
“Alumina, electrical power, calcined petroleum coke, and liquid pitch (the key raw materials for carbon anodes), and labor are the principal components of our cost of production. These components together represented over 85% of our cost of goods sold for the year ended December 31, 2022.” 2022 Form 10k
Looking at Chart 3, you would surmise that changes in production volume are not the cause. This had a coefficient of variation of 12%. As such I would rule out labor costs. This leaves alumina and power costs.
CENX has this to say about alumina.
“…A major portion of our alumina requirements is indexed to the price of primary aluminum…The average market alumina index price as a percentage of market LME price per tonne for 2022 was 13% compared to 13% for 2021 and 16% for 2020.” 2022 Form 10k.
Given the above, the most likely culprit would be power costs. Unfortunately, CENX did not provide enough information in its Form 10k. I could not dig further into the link between gross profit volatility and changes in electric power costs.
But consider the peer results in Chart 2 and CENX alumina indexing. I would say that the electric power cost is the most likely cause of the volatility. The following extracts from CENX’s 2022 Form 10k support my contention.
“…These market-based contracts (electricity contracts) expose us to price volatility and fluctuations due to factors beyond our control and without any direct relationship to the price of primary aluminum….”
“Power disruptions have had a material negative impact on our results of operations in the past….”
The above analysis does not paint a good growth picture for CENX. While there is some revenue growth, the gross profit margin is not growing. If electrical power costs is driving the gross profit margin volatility, it is not something that can be easily resolved.
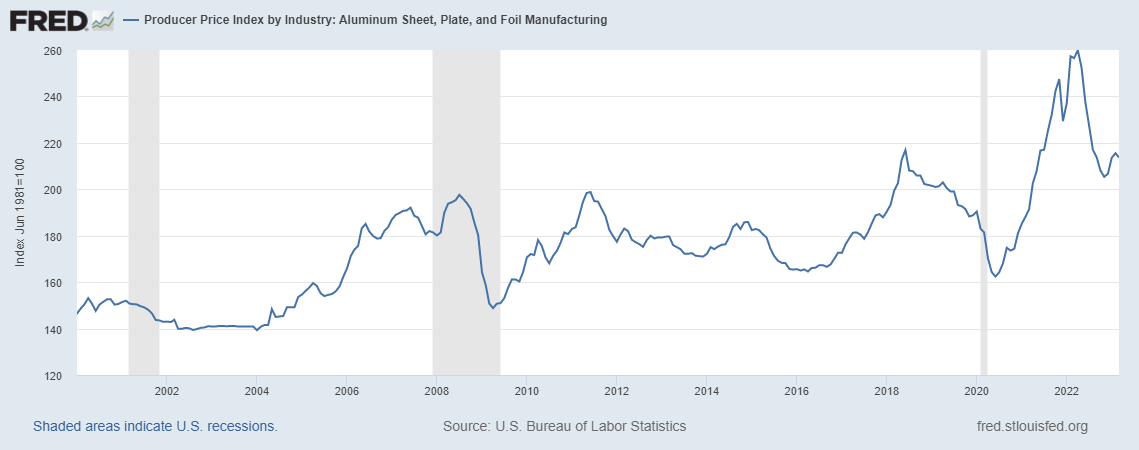
Cyclical sector
Aluminum is a commodity with cyclical prices as illustrated in Chart 4. Over the past 12 years, there is a 0.81 correlation between CENX’s revenue and aluminum prices. This makes CENX a cyclical company.
You can see from Chart 4 that while cyclical, prices were also trending up over the past 20 years. But this growth was “distorted" by the 2021/2022 prices that were extraordinarily high.
If you ignore 2021/2022 and look at the 2009/10 trough to the 2020/21 trough, prices only grew at about 1% CAGR. In other words, long-term growth in aluminum prices is not a tailwind for CENX.
Chart 4: Aluminum price trends (FRED)
Looking at Chart 4, you can see that over the past 12 years, there have been at least 2 price cycles. To get representative values over the cycle, it makes sense to consider CENX’s performance from 2011 to 2022.
Valuation of cyclical companies
Damodaran opined that the value of cyclical companies is often more dependent on the movement of the commodity price than on firm-specific characteristics. Valuing such companies based on their current earnings can lead to a misleading picture.
We should thus look at the “normalized” earnings over the cycle. Damodaran has suggested 3 ways to do this.
- Take a simple average of the earnings over the cycle. But if the company has grown over the years, this method will not reflect its bigger size. We have this situation with CENX as its 2022 revenue is doubled its 2011 revenue.
- Take the current revenue and multiply it by the average profit margins over the cycle. The problem for CENX is that the average 2011 to 2022 operating margins are negative.
- Take the industry average. This assumes that CENX will improve its margins to match the industry average.
I used the latter 2 approaches in my valuation of CENX.
Greenwald Analysis
According to Professor Bruce Greenwald, you can get strategic insights by comparing the Asset Value ((AV)) with the Earnings Power Value ((EPV)). You then have 3 scenarios:
AV = EPV. Here the returns would equal the cost of funds. You would expect this in a freely competitive environment. If the returns are higher, there would be incentives for new entrants that would drive the returns down. If the returns are lower, companies would leave the industry. There would be less competition and returns would improve.
AV > EPV. Here the returns are less than the cost of funds. There is poor asset utilization due to poor management or industry problems.
AV < EPV. Here the returns are higher than the cost of funds in a sustained manner. For this to hold, the company must have some economic moat. Greenwald believes that this sustainable growth characteristic is only applicable to "franchises". He only considers incorporating the value of growth into the valuation for this case.
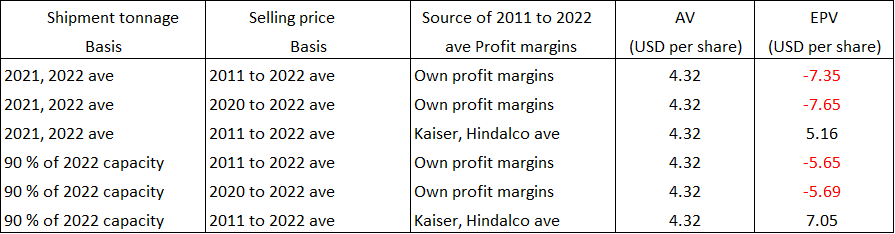
The AV for CENX was based on its Book Value as of the end of Dec 2022. For the EPV, I looked at 6 Scenarios based on different shipment tonnage, selling price, and sources of the cyclical profit margins.
Table 2 summarizes the results. You can see that we only have the AV < EPV situation if the cyclical profit margins are based on those of its peers. Any valuation using CENX 2011 to 2022 average profit margins will result in a negative EPV.
The question then is whether CENX can improve its operations so that its profit margins match those of its peers.
Table 2: Summary of Greenwald Analysis (Author)
Note to Table 1: For the industry or peer profit margins, I used the average of Kaiser Aluminum and Hindalco as only these 2 had financials from 2011 to 2022.
EPV of CENX
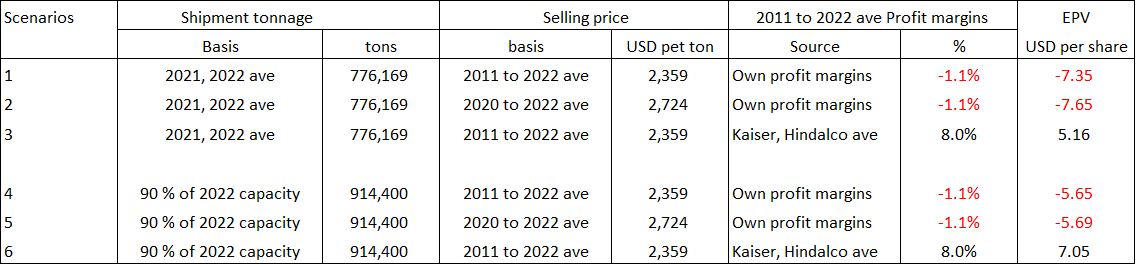
I considered 6 Scenarios for the EPV based on the following key parameters:
- Shipment tonnage. I looked at 2 cases – the 2021 and 2022 average or 90 % of its 2022 capacity.
- Selling price. I looked at 2 cases – the 2011 to 2022 average or the past 3 years’ average. I believe that the 2011 to 2022 average is more representative of the values over the cycle.
- Profit margins over the cycle. I considered 2 cases – its own 2011 to 2022 average or the 2011 to 2022 average of Kaiser Aluminum and Hindalco.
The EPV for the key combinations is summarized in Table 3. You can see that because of CENX’s poor performance, any valuation based on its historical margins will result in a negative EPV.
I only obtain positive EPV by assuming that CENX can improve its operations to match the industry average margins.
Table 3: EPV under various Scenarios (Author)
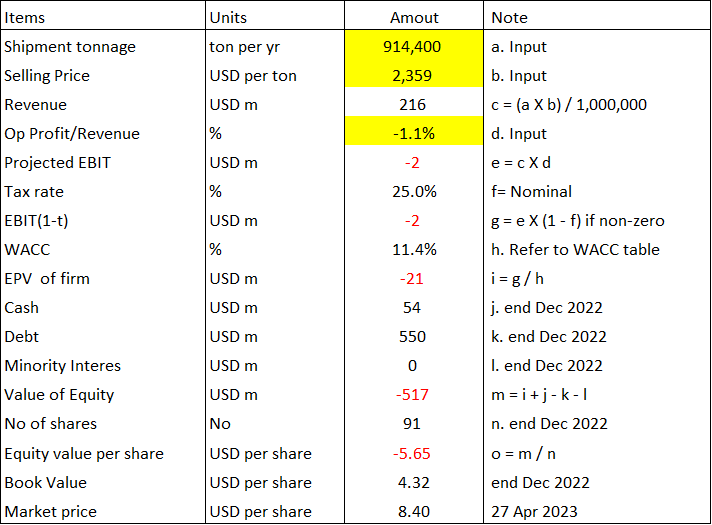
EPV valuation model
I derived the EPV of the operating assets based on EBIT(1 - t) / WACC.
Where:
EBIT = Revenue X Op profit margin.
Revenue = Shipment tonnage X Selling price. The shipment tonnage and selling price will vary depending on the Scenarios.
Op profit margin is the average value from 2011 to 2022. This will vary depending on whether I used CENX average values or those of the industry. For the industry, I used the average of Kaiser Aluminum and Hindalco.
t = nominal tax rate of 25%.
WACC = weight average cost of capital. This was derived based on the first page results of a Google search for the term "CENX WACC" as summarized in Table 4.
Table 4: WACC (Various sources)
EPV of the firm = Value of operating assets + Cash.
EPV of equity = EPV of the firm - Minority Interests - Total Debt.
A sample computation of the EPV is illustrated in Table 5.
Table 5: Sample calculation of EPV (Author)
Can CENX match industry performance?
In one of my valuation Scenarios, I had assumed that CENX’s profit margins would improve to match the industry. Is this realistic?
One way to assess this is to see the trends in some efficiency metrics. If CENX’s performance is trending to match those of its peers, then I could say that was possible.
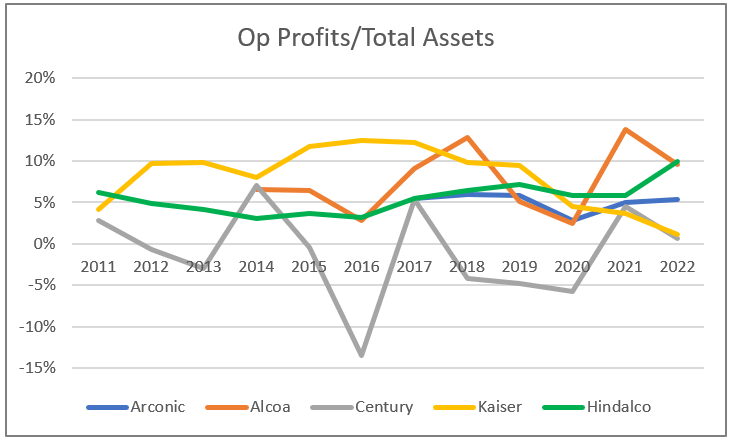
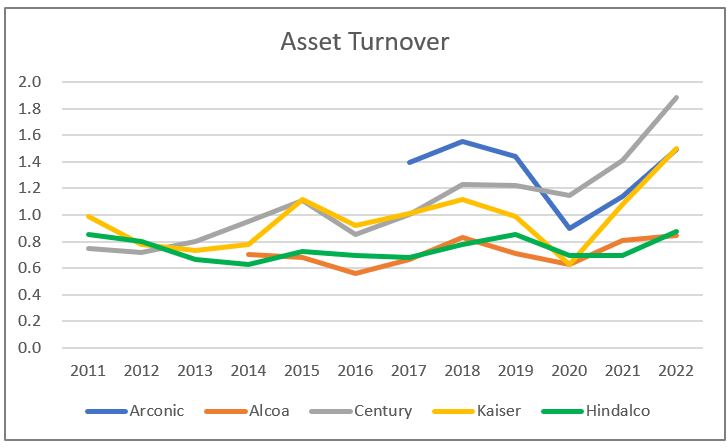
Charts 6 to 8 compare CENX’s performance with those of its peers for 3 metrics. You can see that when it comes to bottom line impact (gross profits or operating income), there are no improving trends. But in the case of top line metrics such as Asset Turnover, CENX did better than its peers.
Unfortunately, as my analysis and valuation show, it is the bottom-line metrics that would have the most impact on profitability and earnings growth.
Chart 5: Peer Gross Profitability (Author) Chart 6: Peer Operating Returns (Author) Chart 7: Peer Asset Turnover (Author)
Conclusion
Based on my analysis, I concluded that there is no basis for the market to consider CENX as a growth stock.
While there were revenue growth, this did not translate into earnings growth. I could not find any fundamental reasons to support a growth thesis.
- Shipment tonnage only grew a 2.2 % CAGR.
- Direct shipment price per ton grew at 2. 8 % CAGR. Ignoring the 2022 price spike, the long-term aluminum price grew at 1 % CAGR.
- Only about ¾ of the production capacity was used.
- There was no uptrend in the gross profit margin. Gross profit margins were also volatile.
- The PAT in 2022 was about that for 2010
At the same time, CENX is also not a growth stock when viewed through the Greenwald lens. The market has overpriced CENX. This is not an investment opportunity from a long-term value investing perspective.
I also could not find any trends to suggest that CENX is improving its operations to match its peers.
CENX is set to release its quarterly earnings soon. I don't think that this result would have any impact on my Investment Thesis.
Having said that, I would be interested for signs that it is improving its gross profitability and operating returns to match those of its peers. The key is electrical power supply. A statement by management that it has addressed this would be good.
For further details see:
Century Aluminum Is Not A Growth Stock