CERS - Cerus: Unable To Catch A Reasonable Bid Since FY23E Guidance (Technical Analysis)
Summary
- Cerus pushed below its longer-term support level after issuing FY23E guidance in January.
- The market priced in its fair value of the stock swiftly and hasn't added a reasonable bid since.
- Market-generated data indicates further sideways congestion is a high probability, and we'd need a run to $5 to take a reversal seriously.
- Net-net, reiterate hold.
Investment summary
Cerus ( CERS ) has run into troubles on the chart after momentarily breaking its long-term support level in early January. Since our last two publications on CERS, the stock has continued its descent and re-rated another 10% to the downside. I encourage you to read both publications, listed below:
We recommend to hold off on allocating to CERS at this point in time, and in this report, I'll run through the technical reasoning why. Net-net, rate hold with price target at $3.50, a risk:reward of just 1:0.9 - not enough to warrant entry at this stage.
CERS advanced technicals
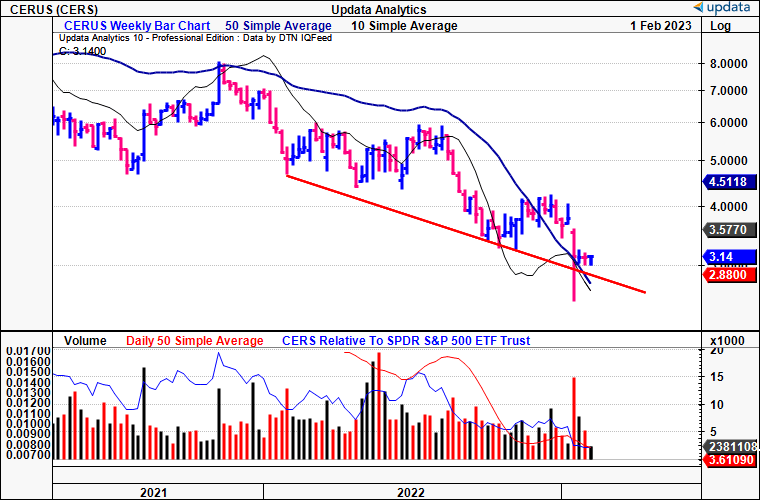
CERS has continued building on a descending base since it broke its 2-year highs in December of FY21. Back then, its top had opened wide, and the bear market of FY22 only added to the downside. The stock had tested the $6 mark on over 4 weekly attempts throughout the mid-portion of FY22, failing at each attempted breakthrough. As such, supply continued building, and we saw it break this congestion period after backing and filling for the bulk of H1 last year, thereby building the ascending base described above.
Since then, it's backed and filled along the downtrend into the new year, breaking the support line momentarily ~3 weeks ago. CERS posting its FY23E guidance was the catalyst for this. The stock traded to 2-year lows at $2.50 before a recovery and has finished with a series of tight closes. Meanwhile, weekly volume has begun to dry up, which opens up an interesting debate - we often see breakouts when volume erodes back, because it leaves large/institutional buyers the scope to make a big entry and instigate new demand. However, this is contrarian, and with that, we need to understand where we sit in the trend.
Exhibit 1. CERS breaking support line 3 weeks ago, tight weekly closes in weeks since
Is CERS set to breakout? This is always horizon-dependent. On a daily cloud chart, that looks to the coming weeks, we are bearish below the cloud. After the congestion through November-January, the price and lagging lines crossed the cloud base and this would be the time to trade any downside targets in the near term, by estimation. On this basis, resistance is currently at ~$3.80 and looks to be ~$3.40 by the end of February, with tight support at the $3.20 zone. This tells us to expect further sideways consolidation over the coming weeks.
Exhibit 2. Bearish below the cloud looking weeks out, resistance at ~$3.40 by end of February
This is confirmed when charting the weekly cloud chart, where the price and lagging lines have pulled further away from the cloud with the latest price structure. This time frame looks out into the months ahead. Long-term resistance at $5, and the stock would need to cross the $4 mark for a rally to be taken seriously. This, coupled with continued downtrend in on-balance volume, indicating long-term buyers are agnostic to CERS at the present.
Exhibit 3. Bearish below cloud looking out into the months ahead
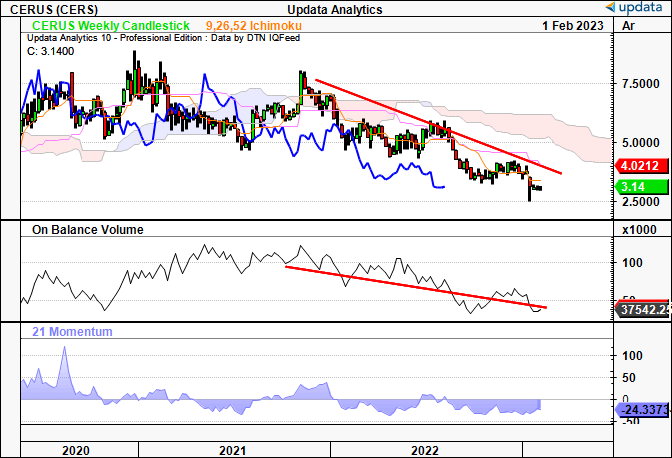
Moreover, weekly money flows have been bottom-heavy and don't suggest a large-entry of demand to trump the supply levels for CERS. Even with the last relief rallies in FY22, the spike in inflows wasn't enough to break to new highs. This also reiterates the points raised above that buyers are holding off at this point in time.
Exhibit 4. Weekly outflows illustrate heavy supply, with recent spike not enough demand to overcome this
Data: Updata
Market-generated data supports hold
The fact CERS trades below the cloud indicates it needs a large shift in demand to break to new highs. The market profile provides additional data in support of this. We've seen the point of control ("POC") shift higher this week, lifting off ~$3.05 to $3.15 over the last 3 days of trade. As a reminder, the POC illustrates at what price the stock spent the most time over each session - equilibrium, otherwise the market's view of fair value. However, bar the first profile shown on the left, the bolus of volume has been situated above the POC. Moreover, the distribution of prices is skewed above the POC and value areas as well. As such, the time-price opportunity is thin, with small windows of opportunity to capture the recent upside volatility.
Again, this tells us that demand is weak at each attempted upside move. Longs are stuck at each point above the POC, whereas intelligent money hasn't been active below the POC. Normally, we'd expect the volume distribution to be skewed below the POC, indicating large buyers have entered at these points.
Exhibit 5. Market profile with POC shifting higher, although bolus of demand and time/price above the POC
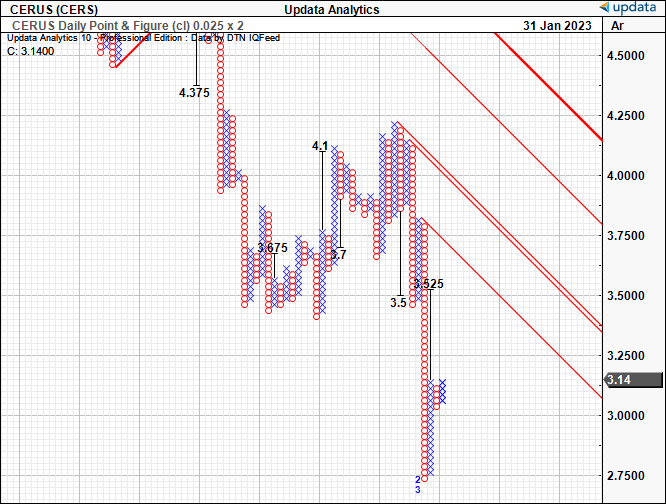
With the culmination of these points, we have marginal upside targets to $3.50 - not enough to warrant an entry at this stage. We'd be looking for targets above the $5 mark, as mentioned previously, to break longer-term resistance.
Exhibit 6. Flat targets to $3.50 - not enough to warrant entry at this stage
In short
With CERS trading near recent multi-year lows, one argument could be this presents a compelling entry point to capture a reversal. However, our findings suggest the risk/reward calculus for this isn't justified, as market-generated data and trend analysis indicate further sideways congestion is likely. The key upside risk is if the stock breaks to $5, where it would cross the longer-term resistance of the cloud top (Exhibit 3). Net-net, we reiterate CERS as a hold.
For further details see:
Cerus: Unable To Catch A Reasonable Bid Since FY23E Guidance (Technical Analysis)