CGDV - CGDV: Examining The Active Dividend Strategy
Summary
- CGDV is a nouveau actively managed investment vehicle focused on large-cap U.S. dividend-paying equities with robust quality.
- Incepted on 22 February 2022, the fund has already amassed fairly substantial assets under management, currently in excess of $1.56 billion.
- It has meaningful downsides. Specifically, its valuation is not as comfortable as it might be, yet anyway, it has a slight discount to the S&P 500.
- Quality is strong, but there is nothing spectacular. A few stocks in the portfolio do not pay a dividend at the moment.
- The standardized yield is marginally higher compared to the one of IVV, though again nothing spectacular. In sum, I see no justification for a Buy rating.
The Capital Group Dividend Value ETF ( CGDV ) is a nouveau actively managed investment vehicle focused on large-cap U.S. dividend-paying equities with robust quality. Today, I would like to assess its advantages and vulnerabilities to decide whether it deserves a Buy rating or not.
Incepted on 22 February 2022, the fund has already amassed fairly substantial assets under management, currently in excess of $1.56 billion, a solid result. It has also managed to outperform the iShares Core S&P 500 ETF ( IVV ), delivering about 65 bps total return vs. IVV's negative 6.4%.
CGDV's investment strategy is based on the large-size, dividend, and quality factors. It invests primarily in U.S. equities, though it might also seek opportunities overseas. For instance, as of January 6, it held London-quoted shares in consumer staples heavyweight British American Tobacco ( BTI ) (London ticker BATS) and Frankfurt-quoted shares in Linde plc ( LIN ), a leading global industrial gas company, combined accounting for about 5.8% of the net assets.
In the current iteration, the CGDV portfolio consists of 49 equities, with most net assets allocated to industrials (19.7%), healthcare (14.5%), and information technology (13%). Industrials accounting for nearly a fifth of the portfolio is principally the consequence of Raytheon Technologies ( RTX ), around 2.1% yielding aerospace & defense heavyweight being its primary investment, with 6.3% weight.
Addressing vulnerabilities
What disadvantages could be uncovered upon thorough inspection? First, I am not content with its valuation.
CGDV invested in three $1 trillion club members, namely Apple ( AAPL ), Microsoft ( MSFT ), and Alphabet ( GOOGL ), though they account for a much lower share of the net assets compared to IVV, just about 6.5% combined vs. around 14%. At the same time, the fund ignored the small-cap universe, with just 2.7% allocated to mid-caps including two consumer discretionary players TopBuild ( BLD ) and Hasbro ( HAS ), and TFI International ( TFII ), a trucking company. So, rather uncoincidentally, the weighted-average market cap of this mix is almost 2x lower than the SPDR S&P 500 Portfolio ETF's ( SPLG ), $241 billion vs. $409.5 billion. I surmise likely as a consequence the earnings yield it has is higher compared to the S&P 500 index, 5.7% as per my estimates vs. 5.2% (or a 19.39x Price/Earnings ). Investors who believe there is always a strong connection between net income growth and the earnings multiple would likely remark here that a massive weighted-average 32% forward EPS growth rate CGDV is boasting, as per my calculations, is indicative of significant undervaluation and, hence, a solid upside potential. The issue here is that the rate is driven mostly by three outliers including Baker Hughes ( BKR ), General Electric ( GE ), and EOG Resources ( EOG ) which have triple-digit EPS growth rates, with BKR's and EOG's reflecting a one-off effect of the pandemic era oil price-driven earnings compression. In case we reduce them to 20% for modeling purposes, the WA figure for the portfolio would retreat to just around 11%.
Ultimately, and most importantly, about 57% of the holdings have a Quant Valuation grade between D+ and F, another way of saying, they are priced at a meaningful premium to their respective sector medians and historical averages. For better context, IVV had about 76% of the net assets allocated to such stocks, so CGDV is clearly valued better, yet this level is still worrisome in my view.
Second, it is counter-intuitive to see Netflix ( NFLX ), Alphabet ( GOOGL ), Royal Caribbean Cruises ( RCL ), and a few other non-dividend-paying stocks in this equity basket, eight in total, together accounting for 7.7%, especially considering the portfolio is fairly small, with just 49 equity holdings. However, there is a nuance. According to the fact sheet , the fund:
Seeks to produce consistent income that exceeds the average yield of the S&P 500 by focusing on companies that pay dividends or have the potential to pay dividends.
So investors should be prepared for exposure to firms that "have the potential to pay dividends," though not actually paying them at this point, for better or worse. On a side note, I am of the opinion that RCL's potential to return cash to shareholders in the near future is questionable .
A few advantages to mention
Of course, CGDV is not without advantages.
First, quality is solid which comes from almost 90% of the holdings having an at least B- Quant Profitability grade, while less than 1% are D (+/-) or F rated.
A minor disappointment is its exposure to Royal Caribbean Cruises, which is loss-making, EBITDA-negative, and cash-burning; the silver lining is that RCL accounts for just 0.76%, while all other firms (outside the financial sector) have positive LTM net operating cash flows.
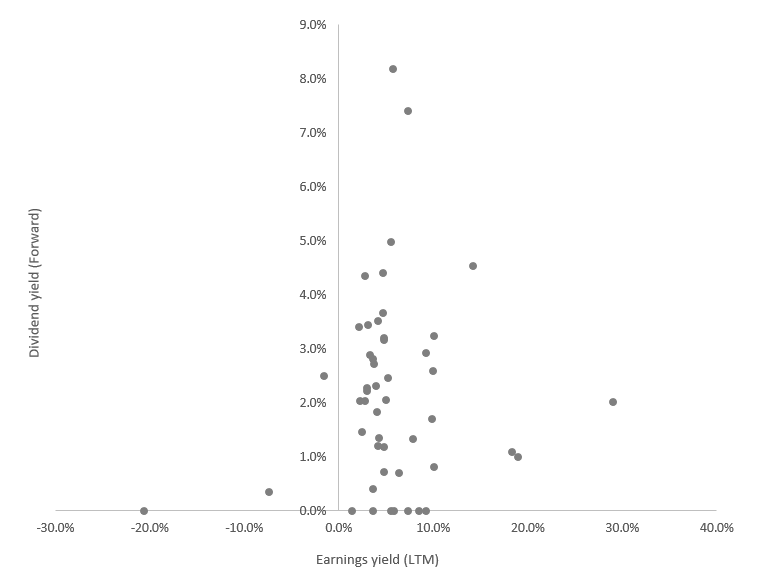
Besides, turning to dividend durability, most holdings have a sizeable earnings/dividend yield spread, indicating their DPS are adequately covered by profits, as illustrated by the chart below.
Created by the author using data from Seeking Alpha and the fund
For the non-financial stocks, we can also use the cash flow yield; here, the spreads are also fairly adequate.
Created by the author using data from Seeking Alpha and the fund
Also, as it is said in the fact sheet, CGDV "seeks to produce consistent income that exceeds the average yield of the S&P 500." In fact, it delivered on its promise to select higher-yielding names. Specifically, the weighted average yield is around 2.29%, as per my calculations, vs. IVV's about 1.69%.
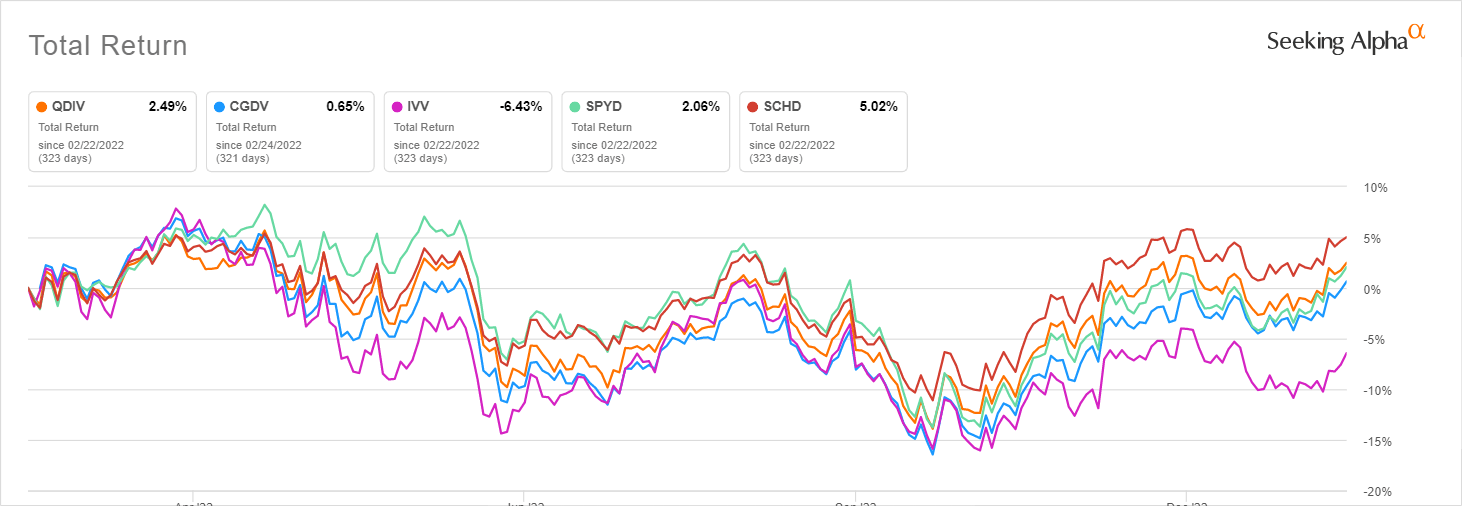
Another advantage worth paying attention to is its performance.
Since 24 February 2022, the fund has generated a total return of 65 bps, beating IVV. Nevertheless, it trailed all the passively-managed peers I selected for comparison, namely the following:
- Global X S&P 500 Quality Dividend ETF ( QDIV ), with an AUM of $62.7 million and 20 bps in expenses,
- Schwab U.S. Dividend Equity ETF ( SCHD ), AUM of $35.3 billion, 6 bps expense ratio,
- SPDR Portfolio S&P 500 High Dividend ETF ( SPYD ), $7.9 billion AUM, 7 bps expense ratio.
Interestingly, in the selected cohort, it has the highest correlation with IVV and SPLG, as illustrated by the following table based on the daily returns from 24 February 2022 to 11 January 2023.
Created by the author using data from Portfolio Visualizer
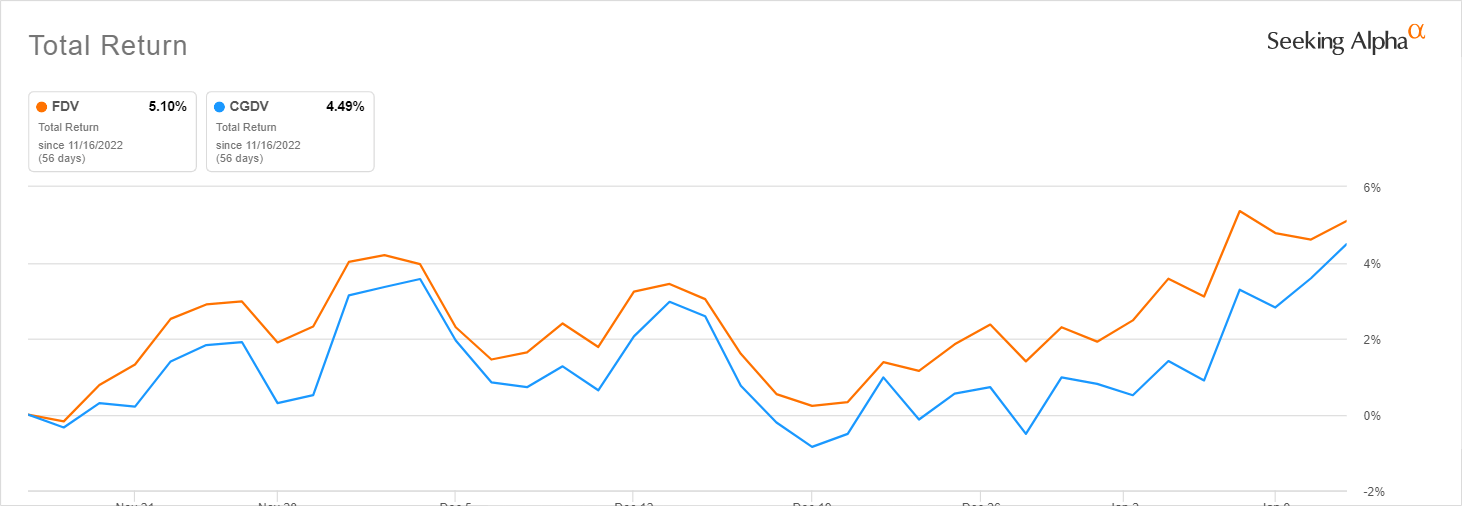
It should be also noted that the actively-managed Federated Hermes U.S. Strategic Dividend ETF ( FDV ) also has a strategy fairly similar to CGDV's. The issue here is that its trading history is too short, less than two months. During that period, it beat CGDV marginally.
Investor Takeaway
CGDV is a dividend-focused active equity ETF heavy in industrials, healthcare, and IT. It has meaningful downsides. Specifically, its valuation is not as comfortable as it might be, yet anyway, it has a slight discount to the S&P 500. Also, it has exposure to a few companies that do not pay a dividend, with about 7.7% allocated to them.
Next, its standardized yield is hardly attractive, just 1.88% vs. IVV's 1.69% .
Amongst its advantages is solid quality manifested in the large share of holdings having an A Profitability grade, with almost all companies delivering a positive cash flow. The fund has outperformed IVV since its inception.
Also, by actively managed ETF standards, it has a modest expense ratio of only 33 bps while its closest peer FDV comes with a 50 bps ratio . Importantly, CGDV's liquidity is more than adequate, especially assuming only a 4 bps 30-day median bid/ask spread.
Overall, CGDV does not possess value characteristics I would find attractive enough for the current environment. Its quality is robust, yet there is nothing phenomenal about it. The yield is marginally higher compared to one of the S&P 500 ETFs, though again nothing spectacular. In sum, I see no justification for a Buy rating.
For further details see:
CGDV: Examining The Active Dividend Strategy