GTLS - Chart Industries' Free Cash Flow Could Surprise To The Upside
2023-08-29 18:10:36 ET
Summary
- Chart Industries closed a $4.4 billion deal for Howden, increasing its service and repair business and generating cost synergies.
- The company reported record-breaking second quarter results, with a total backlog of ~$4 billion and strong order growth momentum.
- Chart Industries' valuation suggests a fair value estimate of $190 per share is warranted, with potential upside should free cash flow come in better than expected.
By Valuentum Analysts
Chart Industries ( GTLS ) makes highly-engineered equipment used in the production, storage and end-use of hydrocarbon and industrial gases. The company's products are used throughout the liquid gas supply chain for purification, liquefaction, distribution, storage and end-use applications. It was founded in 1992 and is headquartered in Ohio. In March 2023, Chart Industries closed on its deal for U.K.-based Howden, a provider of critical air and gas handling products and services. The $4.4 billion deal has added leverage to its operations, but we like the rationale and synergies may be considerable.
The Howden deal materially increased Chart Industries' lucrative and high-margin service and repair business to over 30% of sales from ~14% pre-acquisition. Such business generates gross margins north of 40%. Chart Industries remains confident that it is well-positioned for long-term growth, particularly through the momentum it is seeing for North American LNG export projects. The firm is continuing a strict focus on operational efficiency as it works to take advantage of improving commodity prices. Cost synergies from the Howden transaction are estimated at $175 million, and the firm has come a long way delivering on them.
Chart Industries' total backlog of ~$4 billion and order growth momentum remain phenomenal, too. The company's recently reported second quarter 2023 results were all full of new records, including record total backlog, record total orders, record total sales, record gross margin percentage, record EBITDA, and record free cash flow (all based on continuing operations). Chart Industries continues to optimize its portfolio of products, too. The company sold its Cofimco fans business to PX3 Partners for $80 million, while it sold its Roots business to Ingersoll Rand ( IR ) for $300 million. Though we're not huge fans of Chart Industries net debt position, the company's growth and free cash flow resilience are solid. We value shares at $190 each, implying upside on the basis of our discounted cash-flow process.
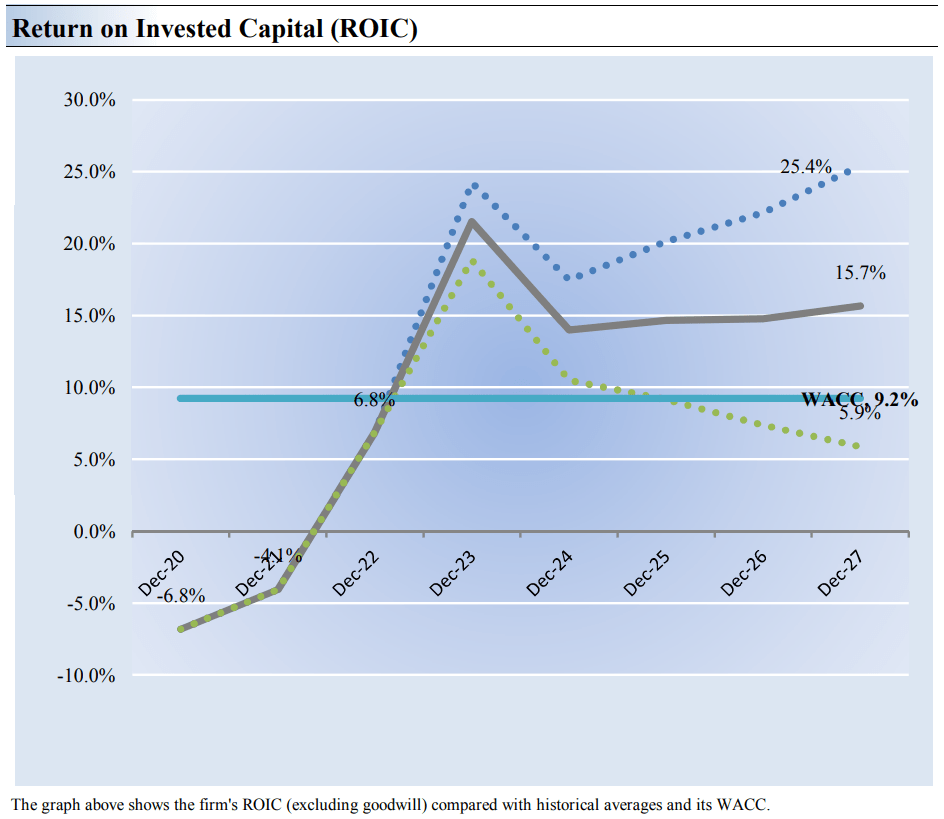
Our forecast of Chart Industries' return on invested capital in coming years. (Valuentum)
In our view, one of the best measures of a company's ability to create value for shareholders is expressed by comparing its return on invested capital [ROIC] with its weighted average cost of capital [WACC]. The gap or difference between ROIC and WACC is called the firm's economic profit spread. Chart Industries' 3-year historical return on invested capital (without goodwill) has been below our estimate of its cost of capital of 9.2%, but we're expecting improvement in the coming years.
In the chart above, we show the probable path of Chart Industries' ROIC in the years ahead based on the estimated volatility of key drivers behind the measure. The solid grey line reflects the most likely outcome, in our opinion, and represents the scenario that results in our fair value estimate. Not only is the firm benefiting a tremendous backlog (+24.1% on a year-over-year basis), but the firm has estimated that it is capturing synergies ahead of expectations. As the firm's earnings before interest expands on its existing net operating asset base, further expansion in ROIC should be expected.
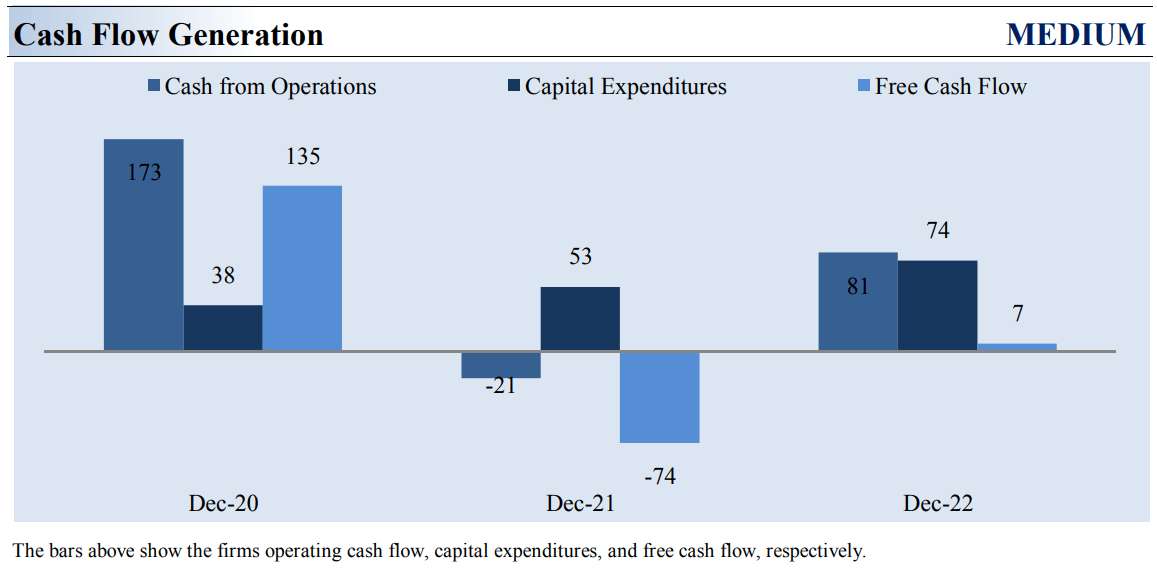
Chart Industries' historical free cash flow. (Valuentum)
Companies that consistently generate a free cash flow margin (free cash flow divided by total revenue) above 5% are usually considered cash cows. Chart Industries' free cash flow margin has averaged about 2.1% during the past 3 years. As such, we think the firm's cash flow generation is relatively medium . The free cash flow measure shown above is derived by taking cash flow from operations less capital expenditures and differs from enterprise free cash flow [FCFF], which we use in deriving our fair value estimate for the company.
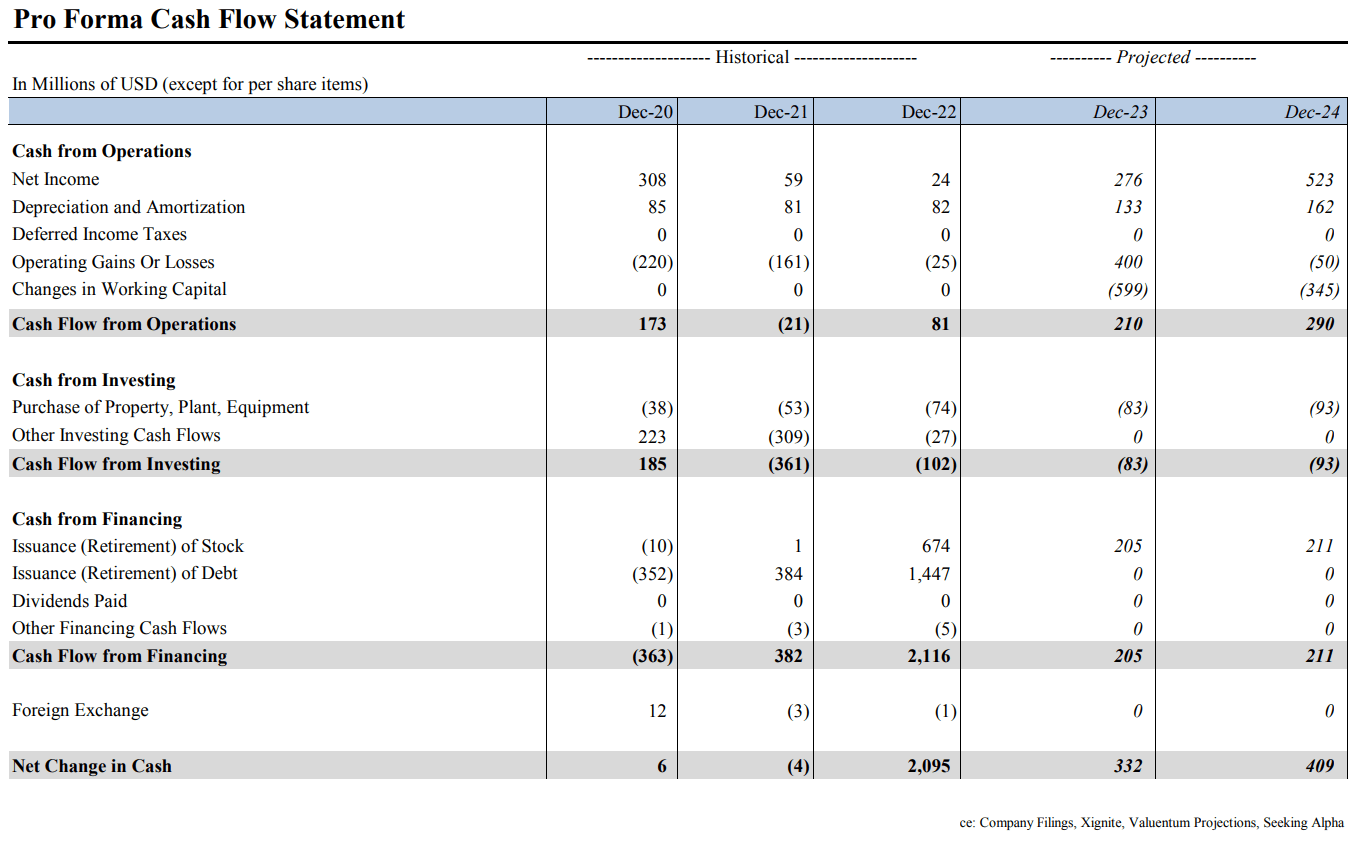
At Chart Industries, cash flow from operations fell from levels registered two years ago, while capital expenditures expanded over the same time period. However, management is targeting adjusted free cash flow in the range of $300-$350 million for 2023, levels that are materially higher than our pro forma forecasts embedded in our pro forma cash flow statement provided at the end of this article. Through the first six months of this year, free cash flow has been roughly flat (~$5 million), so we're being somewhat conservative in our forecast for this year's measure, which we estimate at ~$130 million.
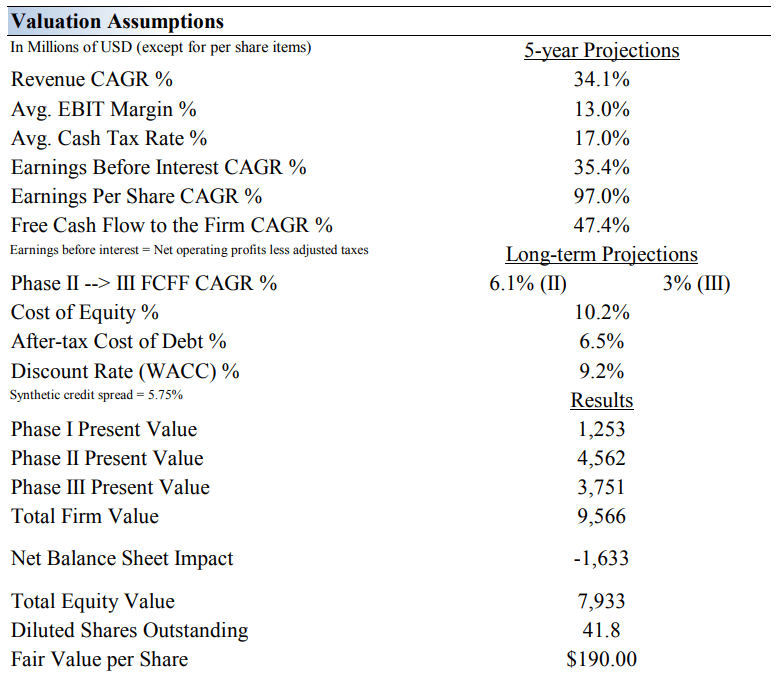
Our summary assumptions behind our valuation of Chart Industries. (Valuentum)
On the basis of our enterprise valuation method, we think Chart Industries is worth $190 per share with a fair value range of $138.00-$242.00. This is a rather wide fair value estimate range, but there are a lot of moving parts at Chart Industries these days, including rapid revenue growth potential from a robust backlog, continuing margin improvement from synergies, as well as M&A activity. That said, our near-term operating forecasts, including revenue and earnings per share, do not differ much from consensus estimates or management guidance.
Our valuation model reflects a compound annual revenue growth rate of 34.1% during the next five years, a pace that is higher than the firm's 3-year historical compound annual growth rate of 9.9%. Our model reflects a 5-year projected average operating margin of 13%, which is above Chart Industries' trailing 3-year average. Beyond year 5, we assume free cash flow will grow at an annual rate of 6.1% for the next 15 years and 3% in perpetuity. For Chart Industries, we use a 9.2% weighted average cost of capital to discount future free cash flows, a discount rate about in line with the average of our coverage.
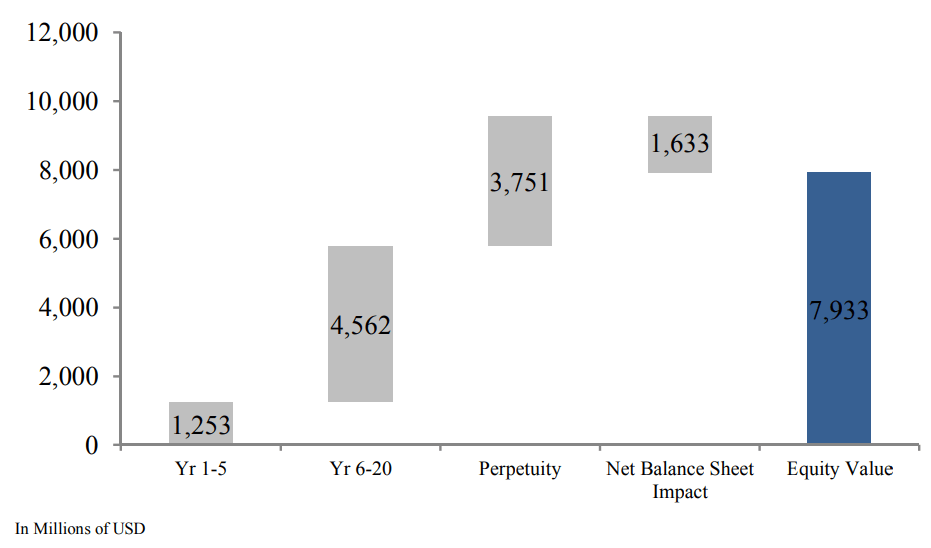
Our breakdown to equity value for Chart Industries. (Valuentum)
In the chart above, we show the build up to our estimate of total enterprise value for Chart Industries and the break-down to the firm's total equity value, which we estimate to be about ~$8 billion; its market capitalization stands at ~$7 billion at the time of this writing. The present value of the enterprise free cash flows generated during each phase of our model and the net balance sheet impact is displayed. We divide total equity value by diluted shares outstanding to arrive at our $190 per share fair value estimate. Shares of Chart Industries' shares are trading at ~$170 at the time of this writing, implying upside potential on the basis of our discounted cash-flow valuation.
Our fair value estimate range of Chart Industries. (Valuentum)
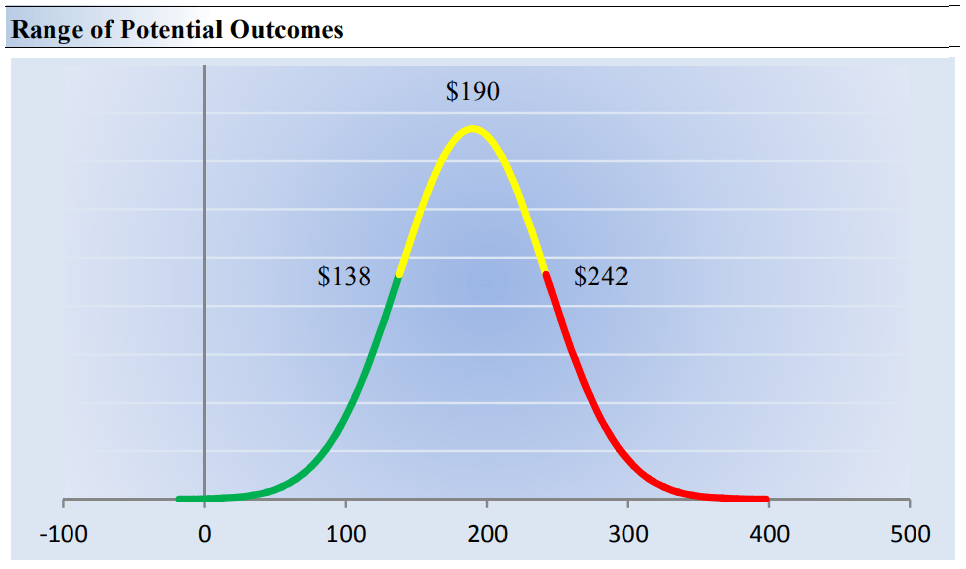
Though we estimate Chart Industries' fair value at about $190 per share, every company has a range of probable fair values that's created by the uncertainty of key valuation drivers (like future revenue or earnings, for example). After all, if the future were known with certainty, we wouldn't see much volatility in the markets as stocks would trade precisely at their known fair values. This is an important consideration that ties the concept of enterprise valuation to the share price. If we knew future financials with certainty, for example, then we'd know the company's fair value with certainty. Unfortunately, this can never be the case, making the application of a margin of safety or fair value range paramount.
Our Value-Risk rating sets the margin of safety or the fair value range we assign to each stock. In the graph above, we show this probable range of fair values for Chart Industries. We think the firm is attractive below $138 per share (the green line), but quite expensive above $242 per share (the red line). The prices that fall along the yellow line, which includes our fair value estimate, represent a reasonable valuation for the firm, in our opinion. We like to think of value as a range of probable fair value outcomes, not a point estimate. In some cases, we may refer to the high end of the fair value estimate range as potential upside, but Chart Industries trades at a discount to our point fair value estimate.
Chart Industries' equity value is expected to advance over time. (Valuentum)
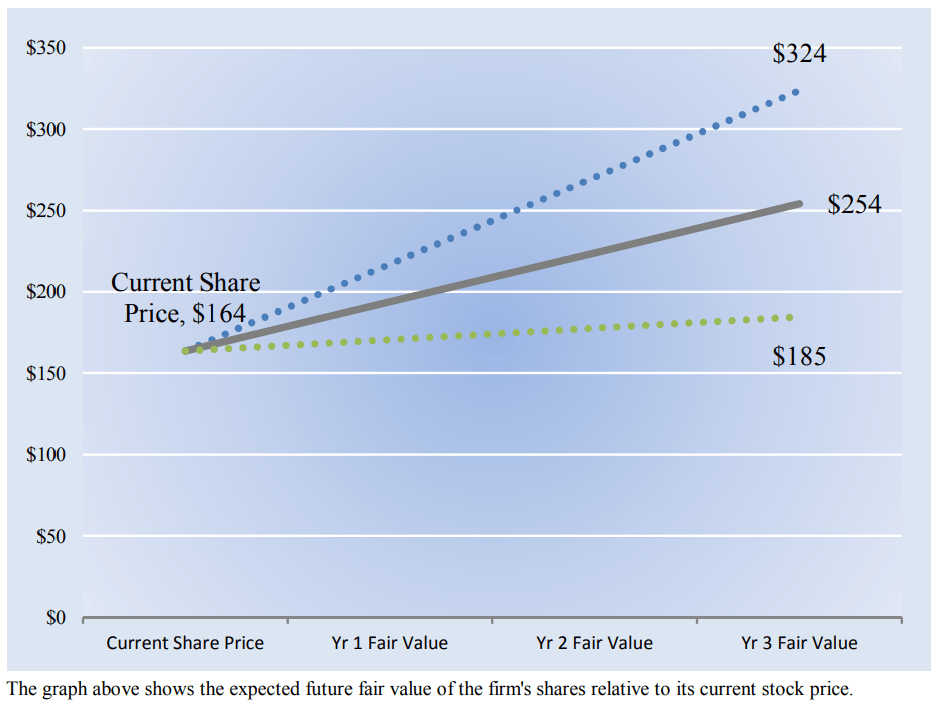
As noted before, we estimate Chart Industries' fair value at this point in time to be about $190 per share. As time passes, however, companies generate cash flow and pay out cash to shareholders in the form of dividends (Chart Industries doesn't pay a dividend). The image above compares the firm's current share price with the path of Chart Industries' expected equity value per share over the next three years, assuming our long-term projections prove accurate. The range between the resulting downside fair value and upside fair value in Year 3 represents our best estimate of the value of the firm's shares three years hence. This range of potential outcomes is also subject to change over time, should our views on the firm's future cash flow potential change.
The expected fair value of $254 per share in Year 3 represents our existing fair value per share of $190 increased at an annual rate of the firm's cost of equity. The upside and downside ranges are derived in the same way, but from the upper and lower bounds of our fair value estimate range. Chart Industries has a lot of things going for it of late. Though the firm's net debt position isn't something that we like, its order strength, record total backlog, and strong (potentially better-than-expected) future free cash flow generation make for a strong combination in an equity idea. Our point fair value estimate of shares stands in excess of Chart Industries' share price at the time of this writing, too. It's one for your radar.
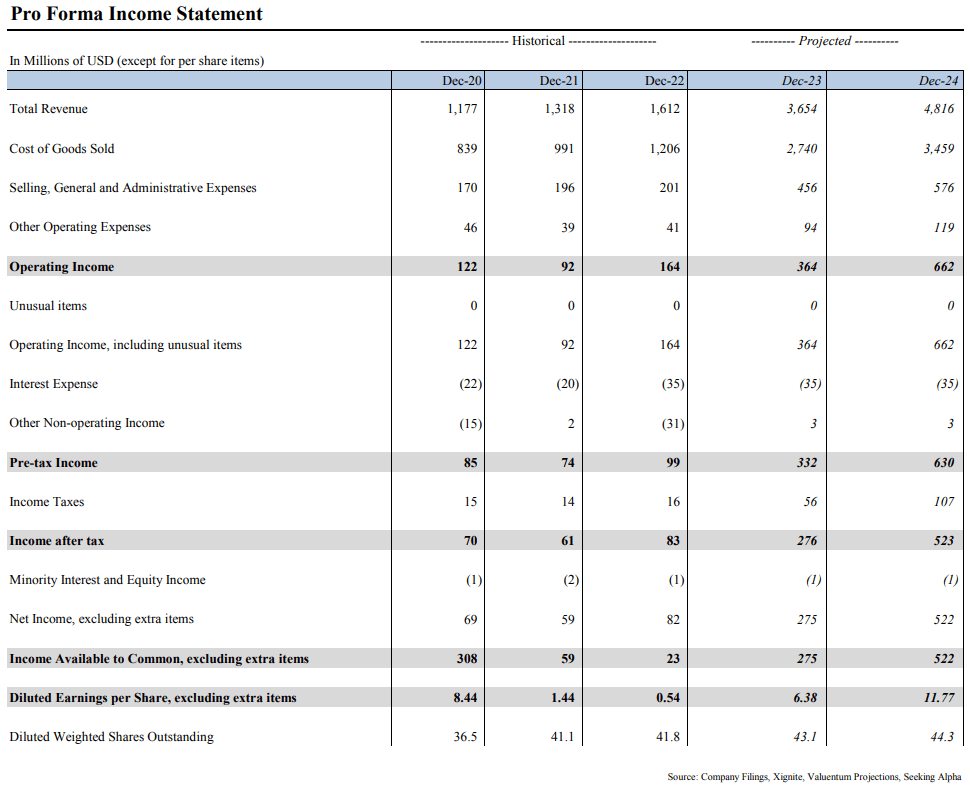
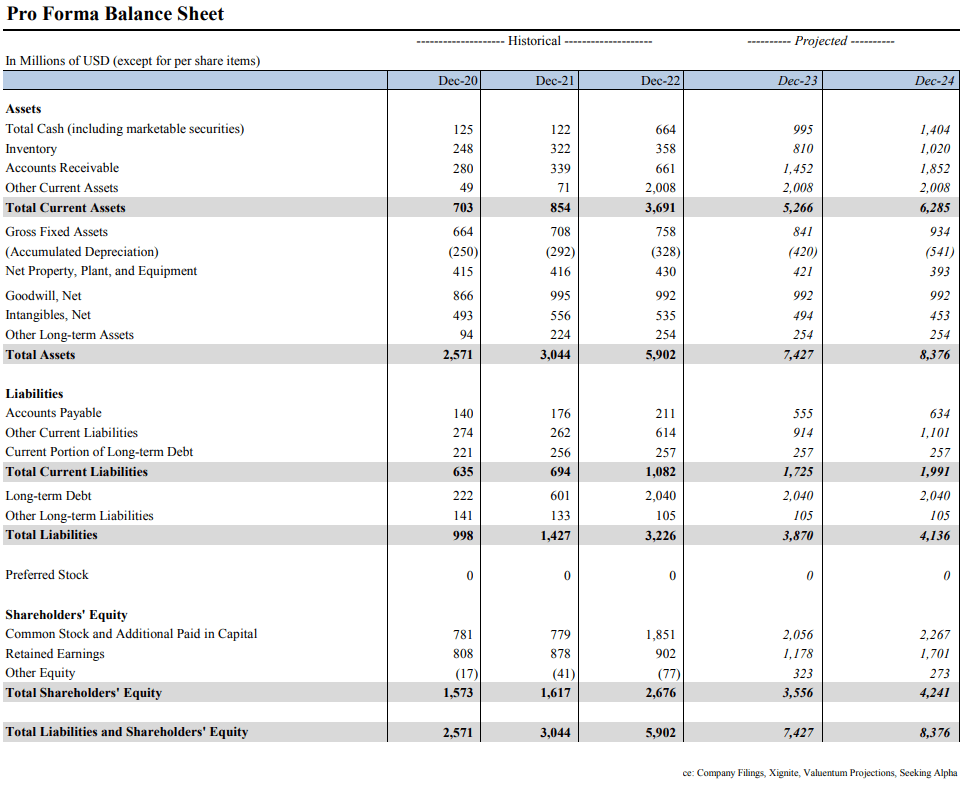
Pro Forma Income Statement (Valuentum) Pro Forma Balance Sheet (Valuentum) Cash Flow Statement (Valuentum)
For further details see:
Chart Industries' Free Cash Flow Could Surprise To The Upside