EWMC - Chart Storm For Early January 2023 (Technical Analysis)
Summary
- Stocks outside large cap tech are outperforming.
- Markets outside the U.S. are turning around and in some cases near breakout to all time highs.
- Slowing economy, high interest rates, and the Federal Reserve remain headwinds.
Let’s review charts as they describe facts and then determine if the stock market is likely to go higher or lower in 2023. We will go through stock market charts, economic charts, and valuation.
Stock Market Charts
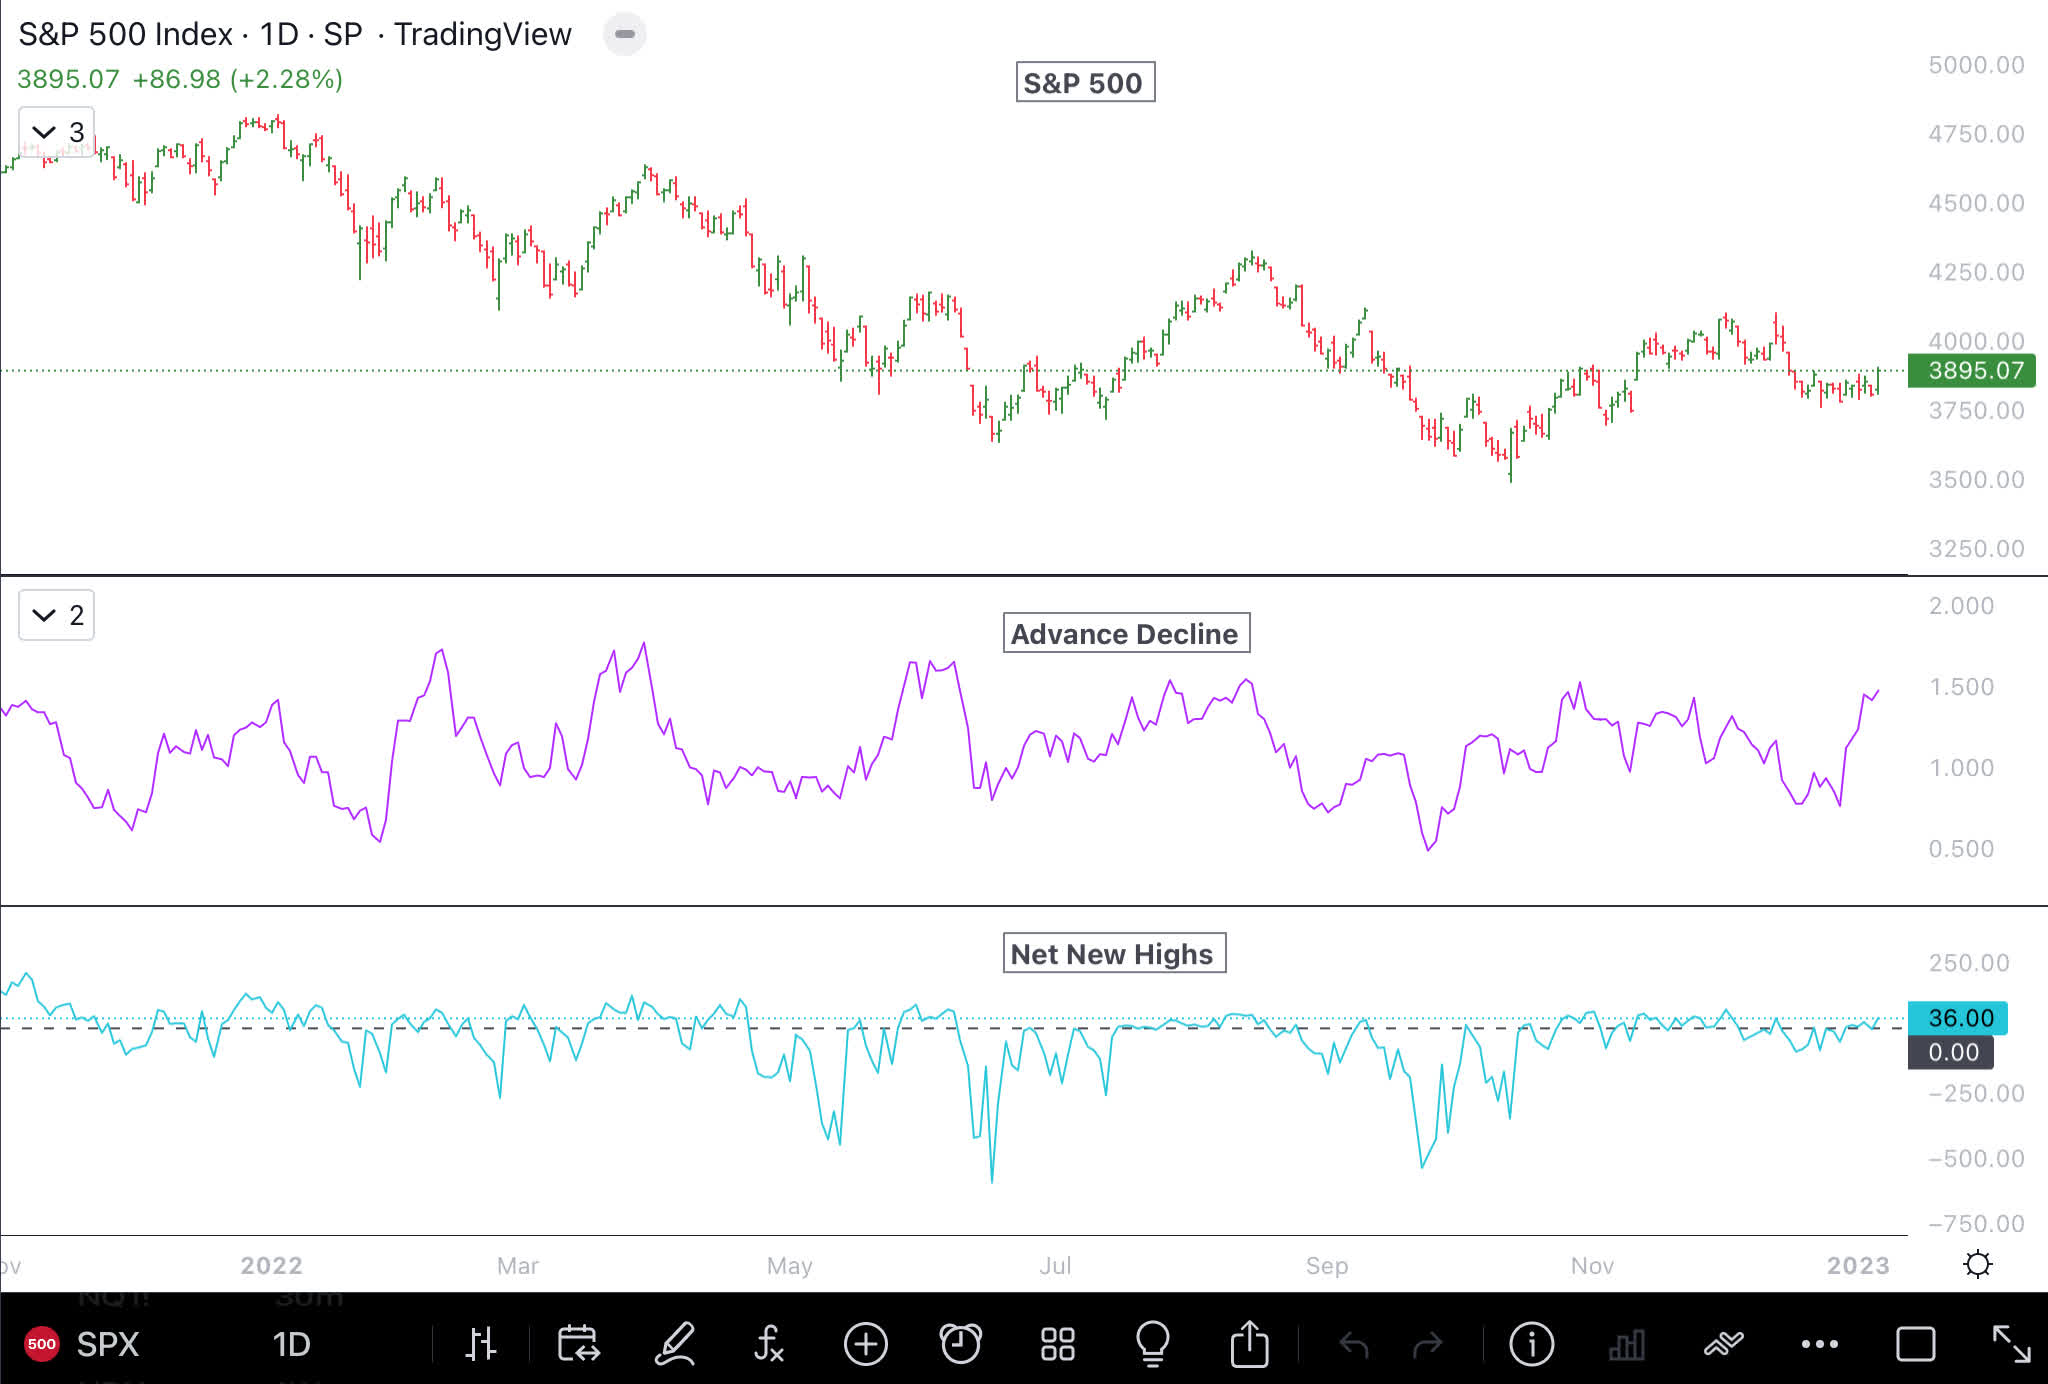
The weekly chart of the S&P 500 ( SP500 ) continues to trend down, but for the past 6 months it has been going sideways. For the uptrend to resume, the S&P 500 needs to close and stay above 4050 and close above the cloud. If that were to happen, then it would be the first step toward starting an uptrend.
There are green shoots, and the chart below captures one of them. Net new highs (new highs minus new lows) for the New York Stock Exchange and NASDAQ have remained positive for the past few weeks. For months until October 2022, net new highs were negative. Advancing stocks (shown as a 10-day moving average) have moved up and need to continue to move up for the overall stock market to go into an uptrend.
S&P 500 Advancers Net New High (Author )
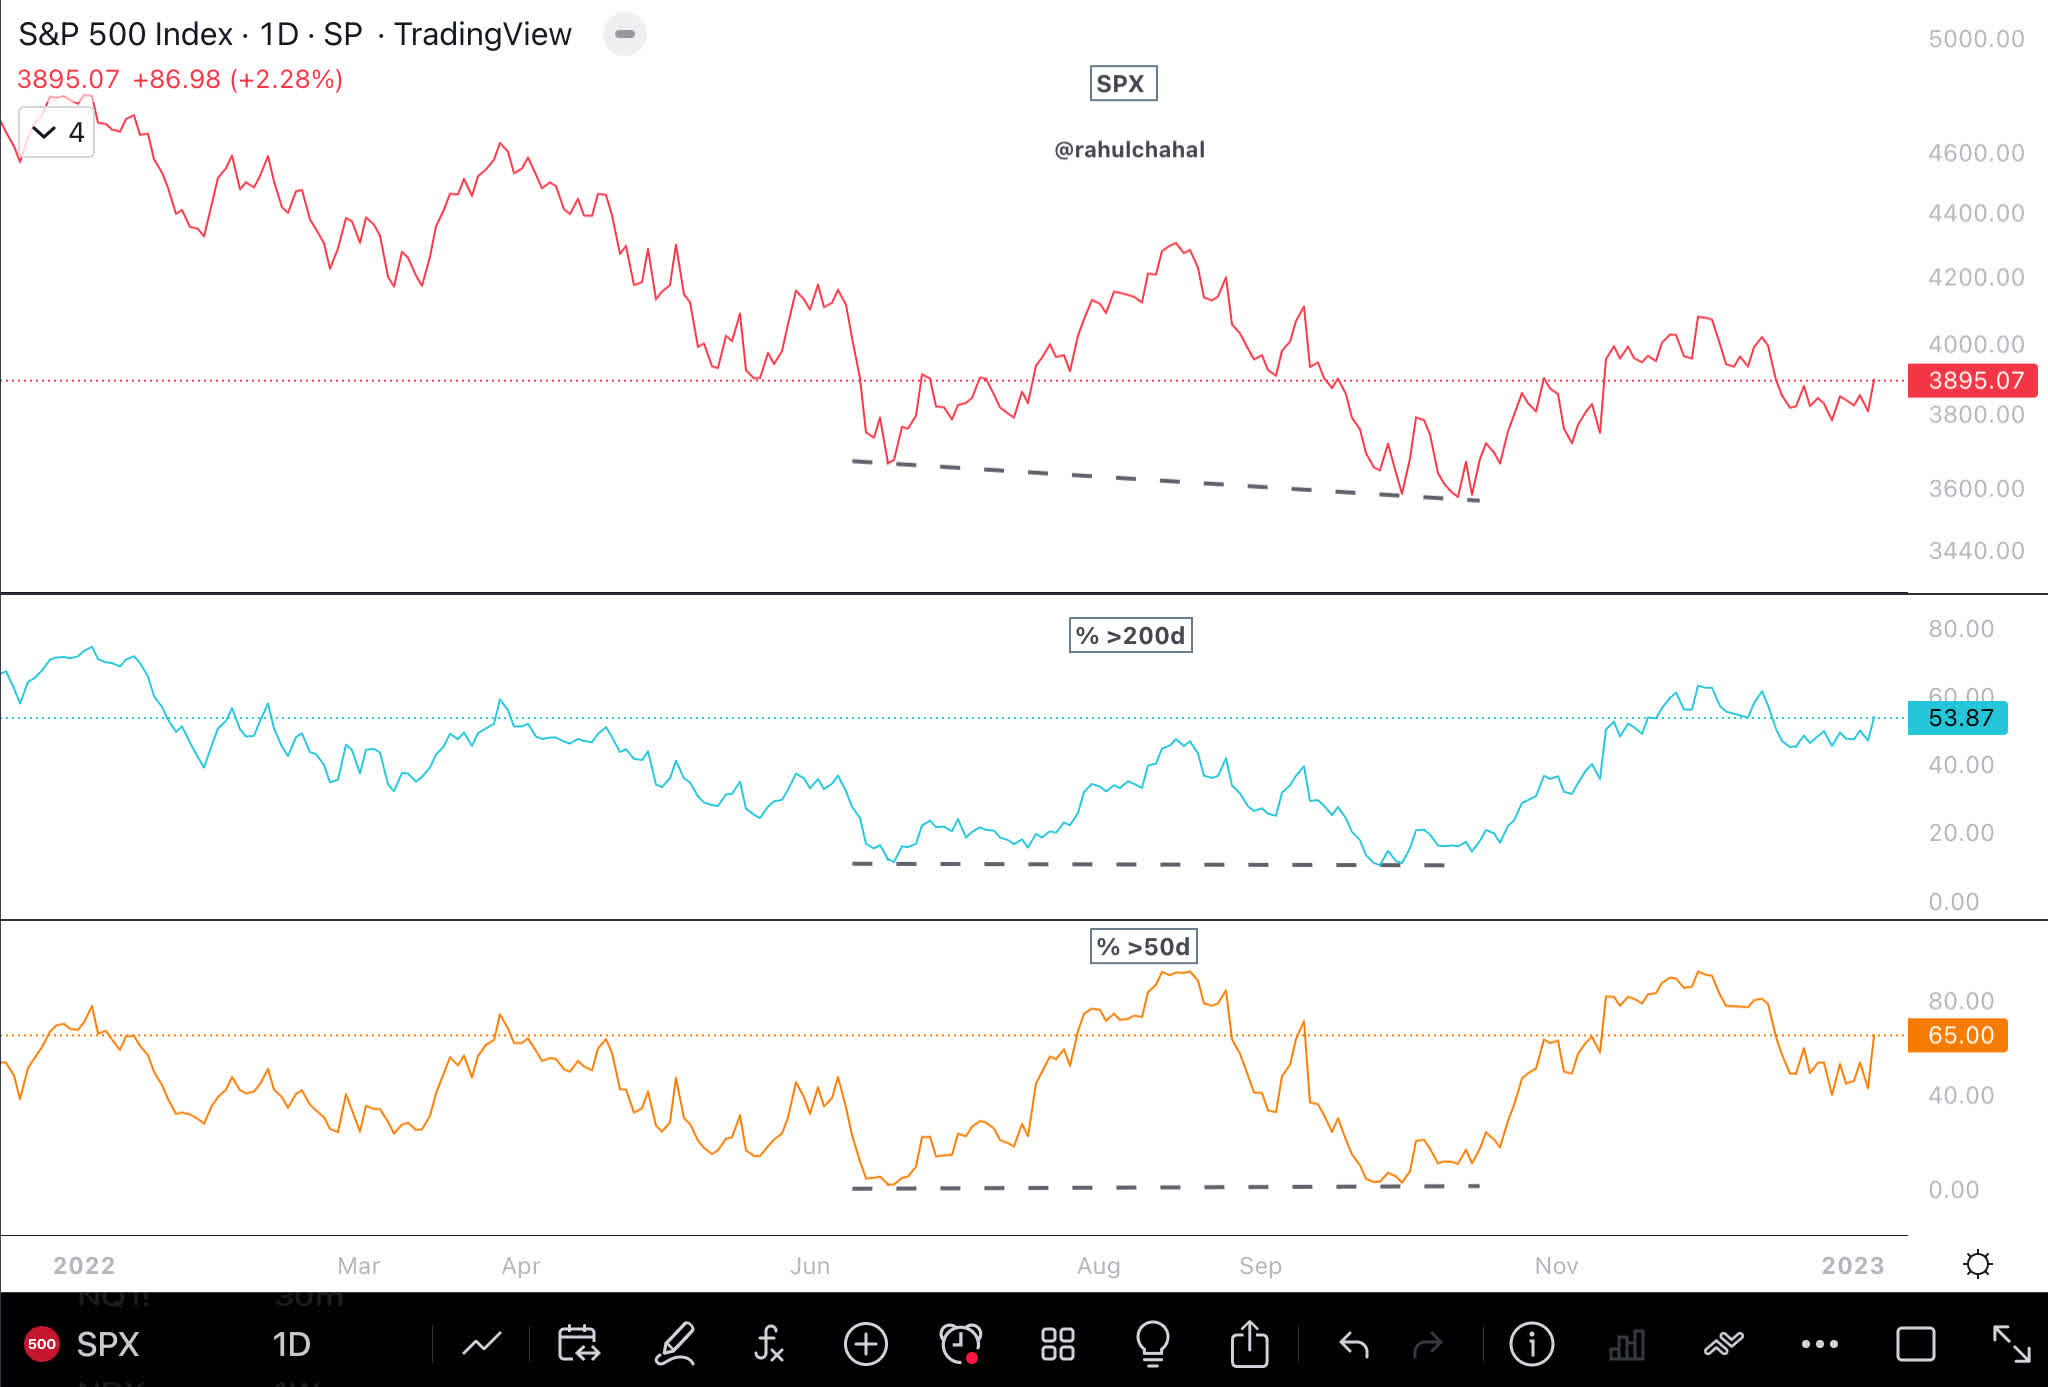
Percentage of S&P 500 stocks above the 200- and 50-day moving average are holding up, which is supportive for the overall stock market.
S&P 500 and % above 200 and 50 day moving average (Author )
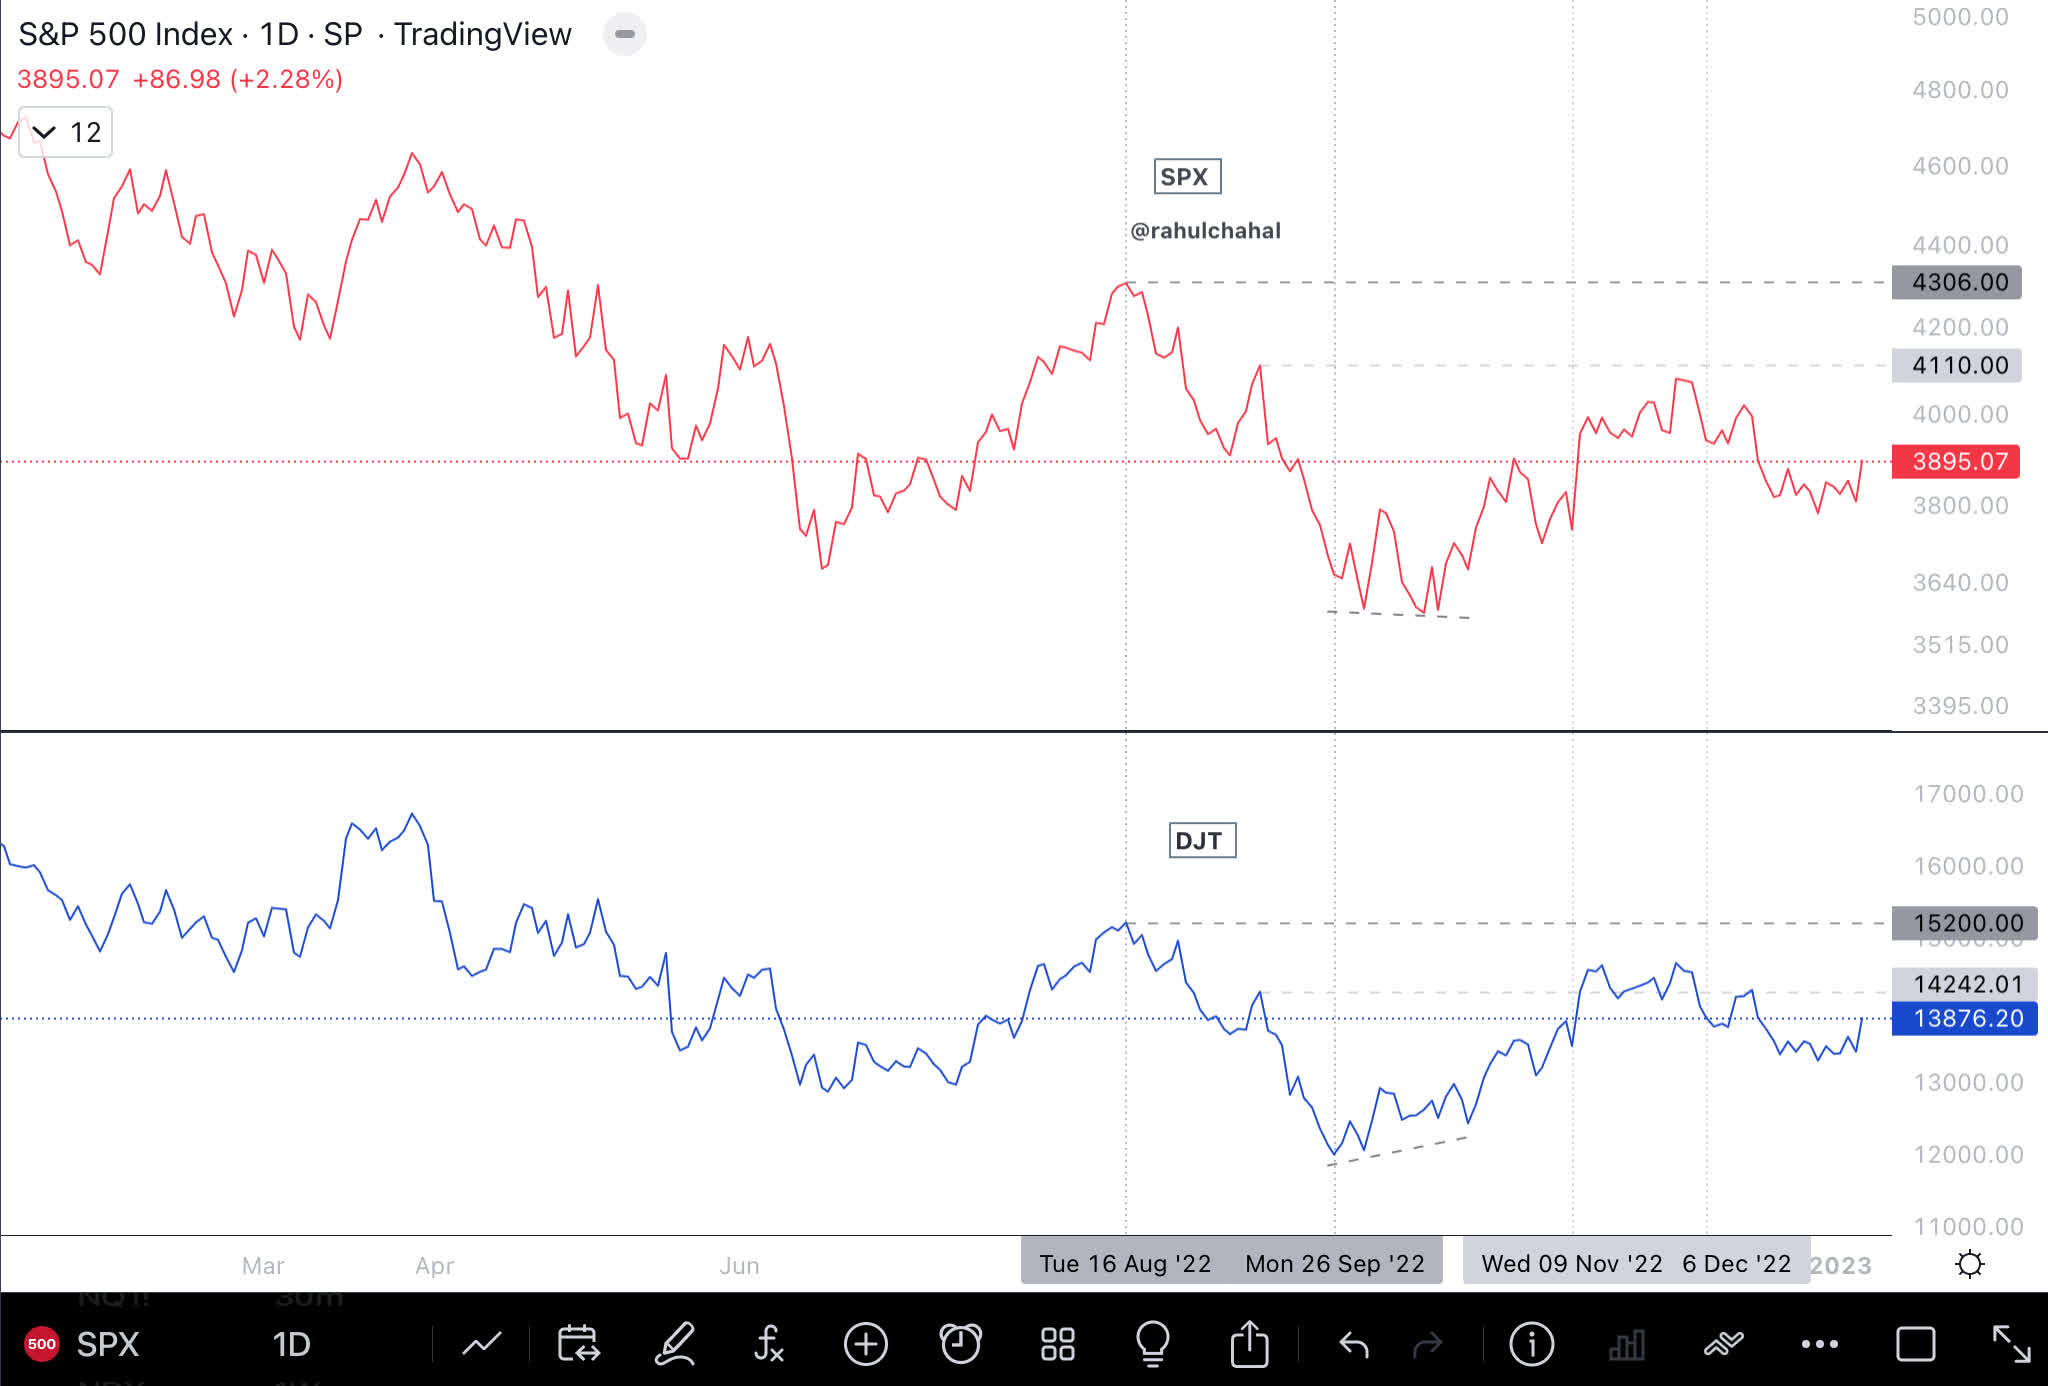
Dow transports index ( DJT ) is holding up, and if it were to close above 15,200, then it would be supportive for the overall stock market.
S&P 500 Dow Jones Transport Average (Author )
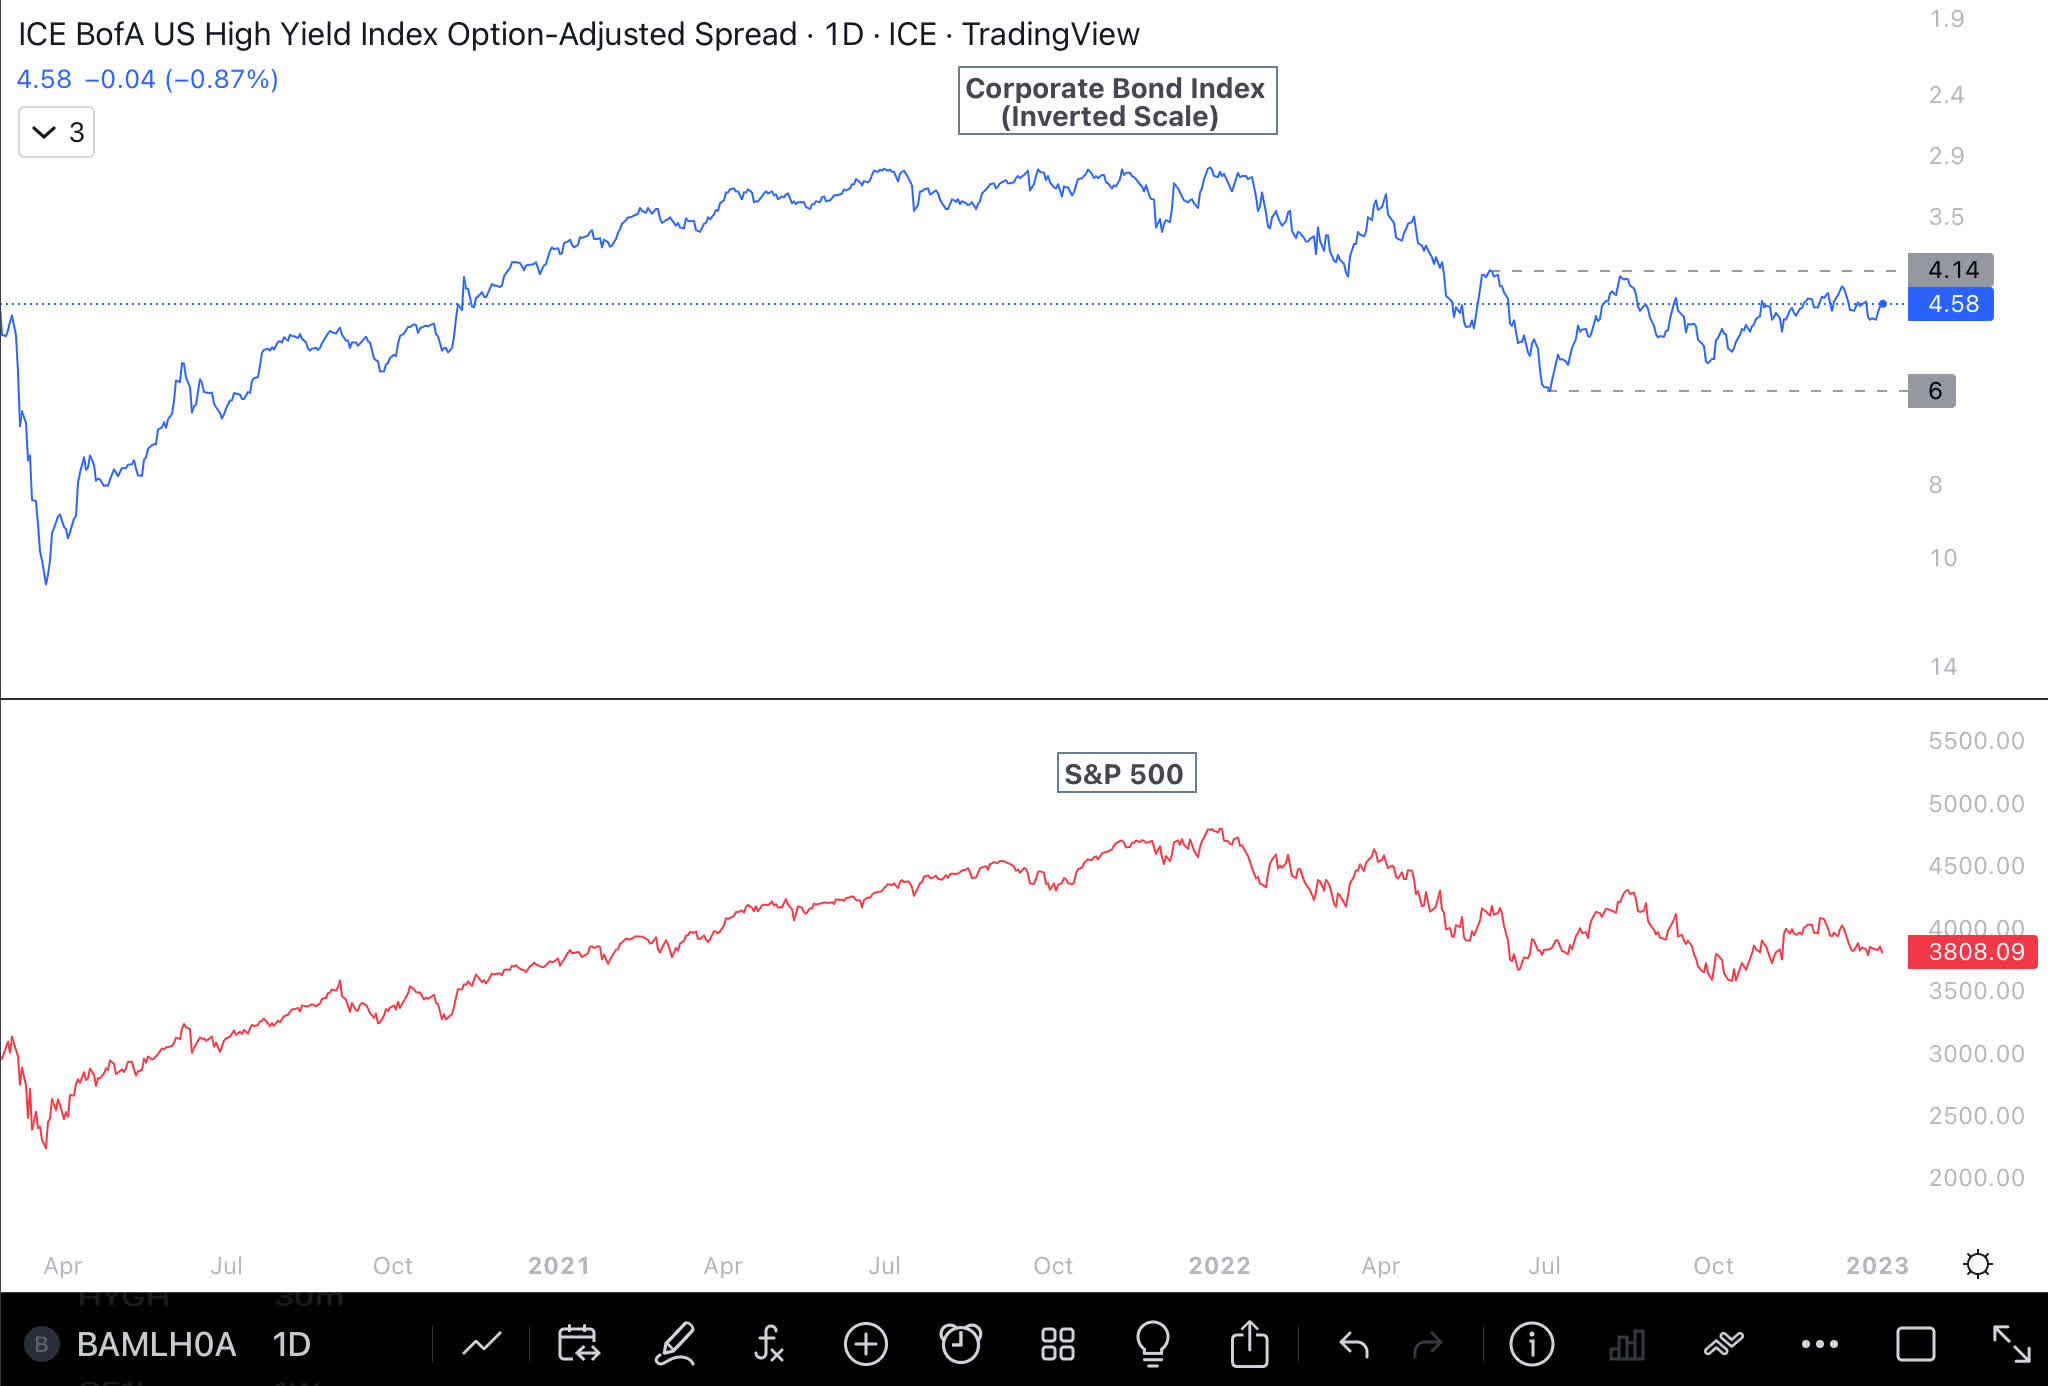
The corporate bond index is shown below on an inverted scale so that it can be compared to the S&P 500. Over the past few weeks, the corporate bond index has held up, and continuing to trend up would be positive for the stock market.
Corporate Bond Index and S&P 500 (Author )
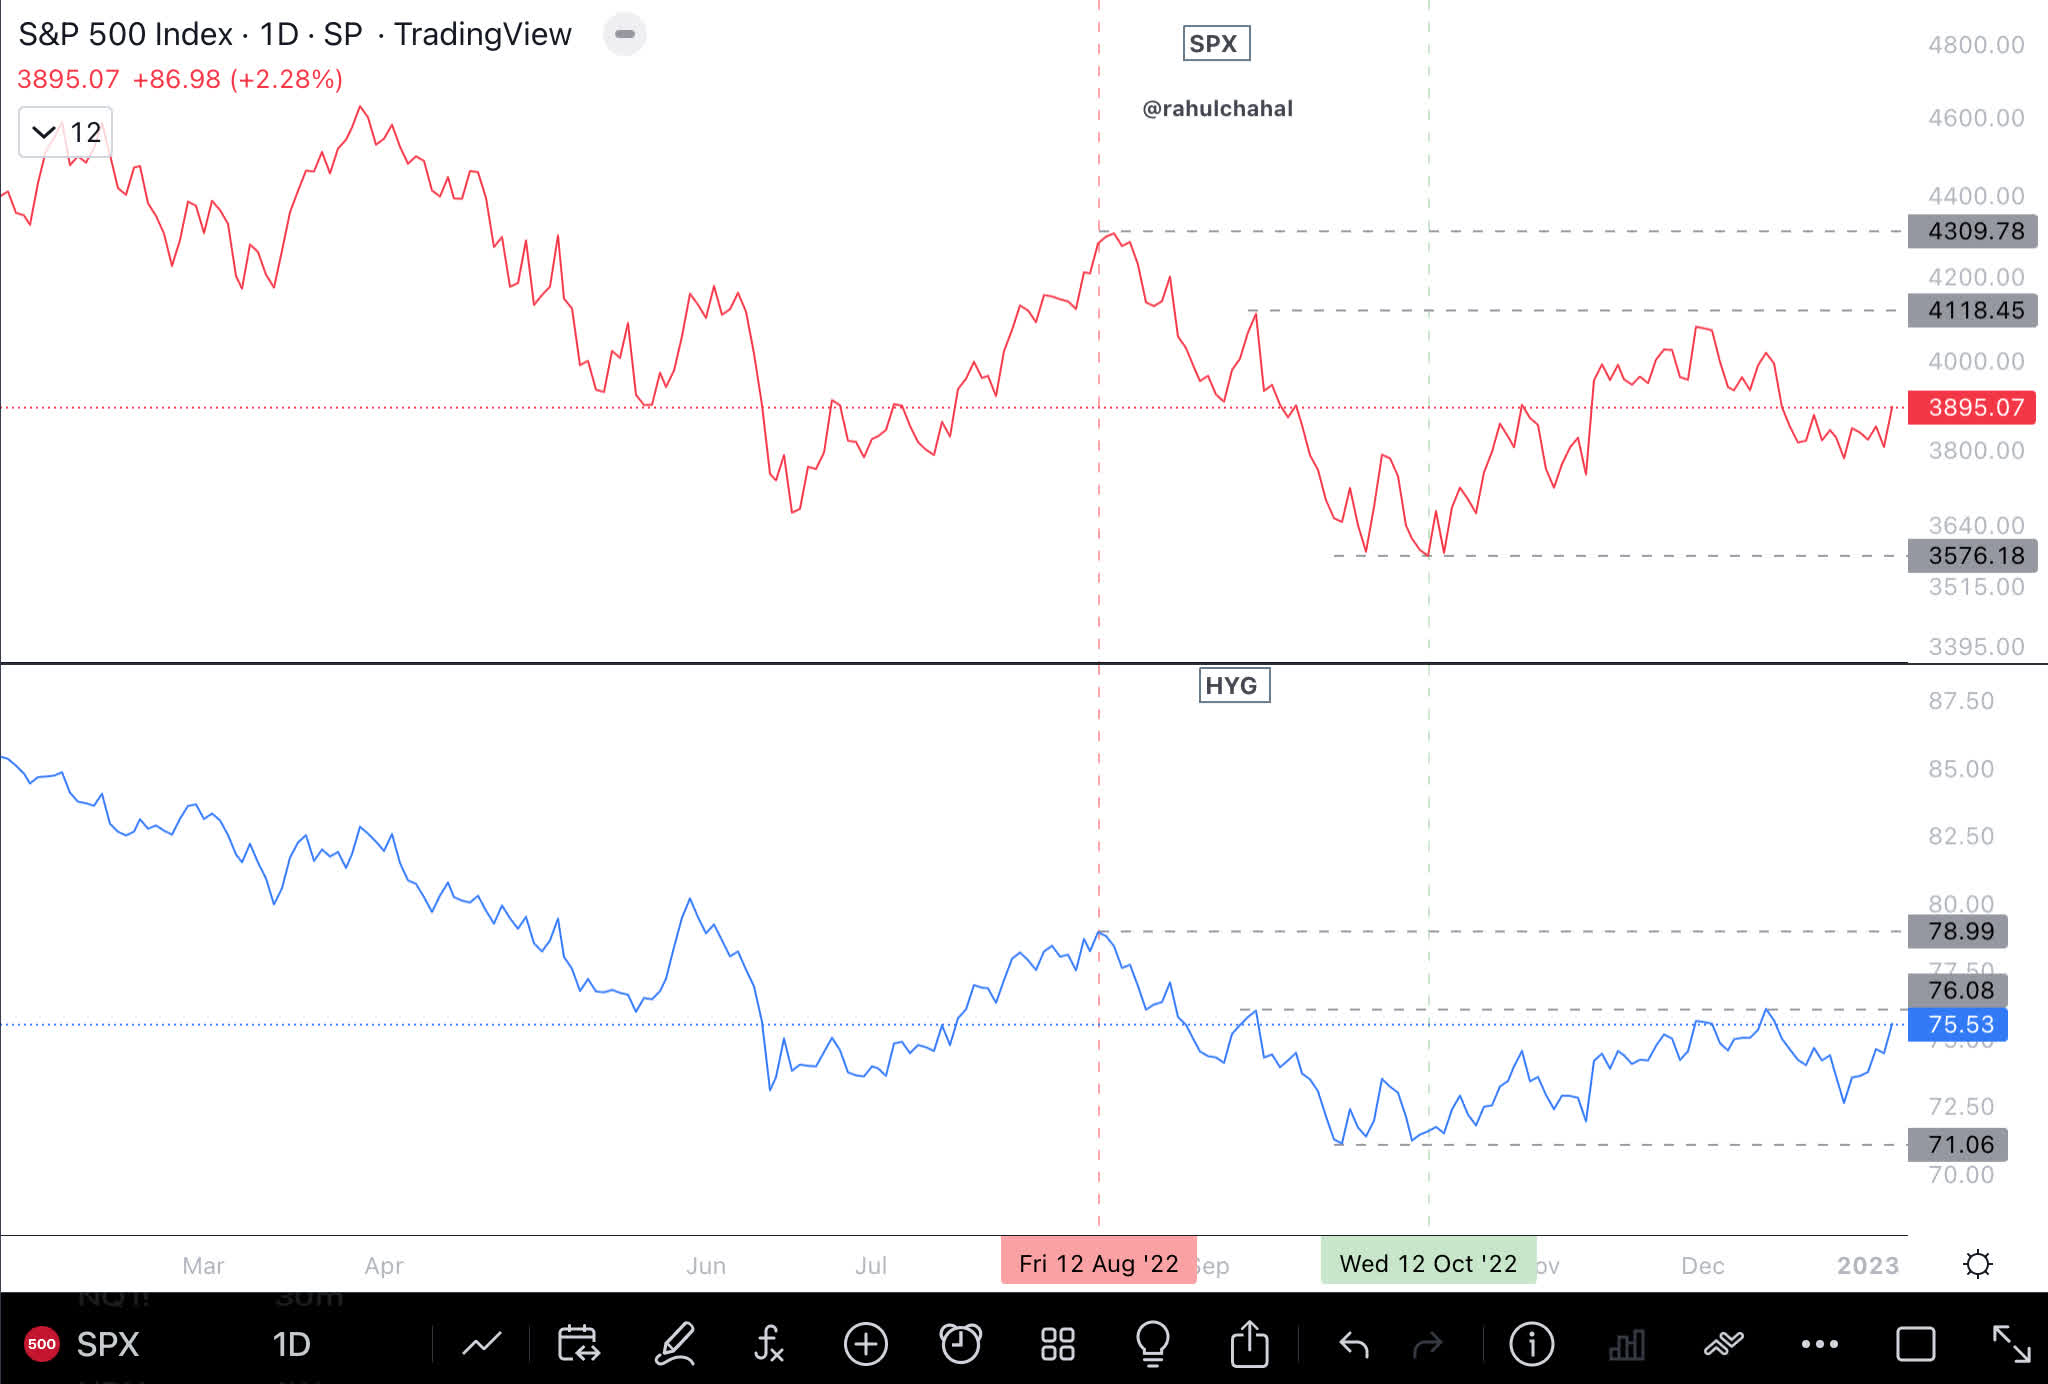
High yield bond ( HYG ) is also holding up, and that is supportive for the overall stock market.
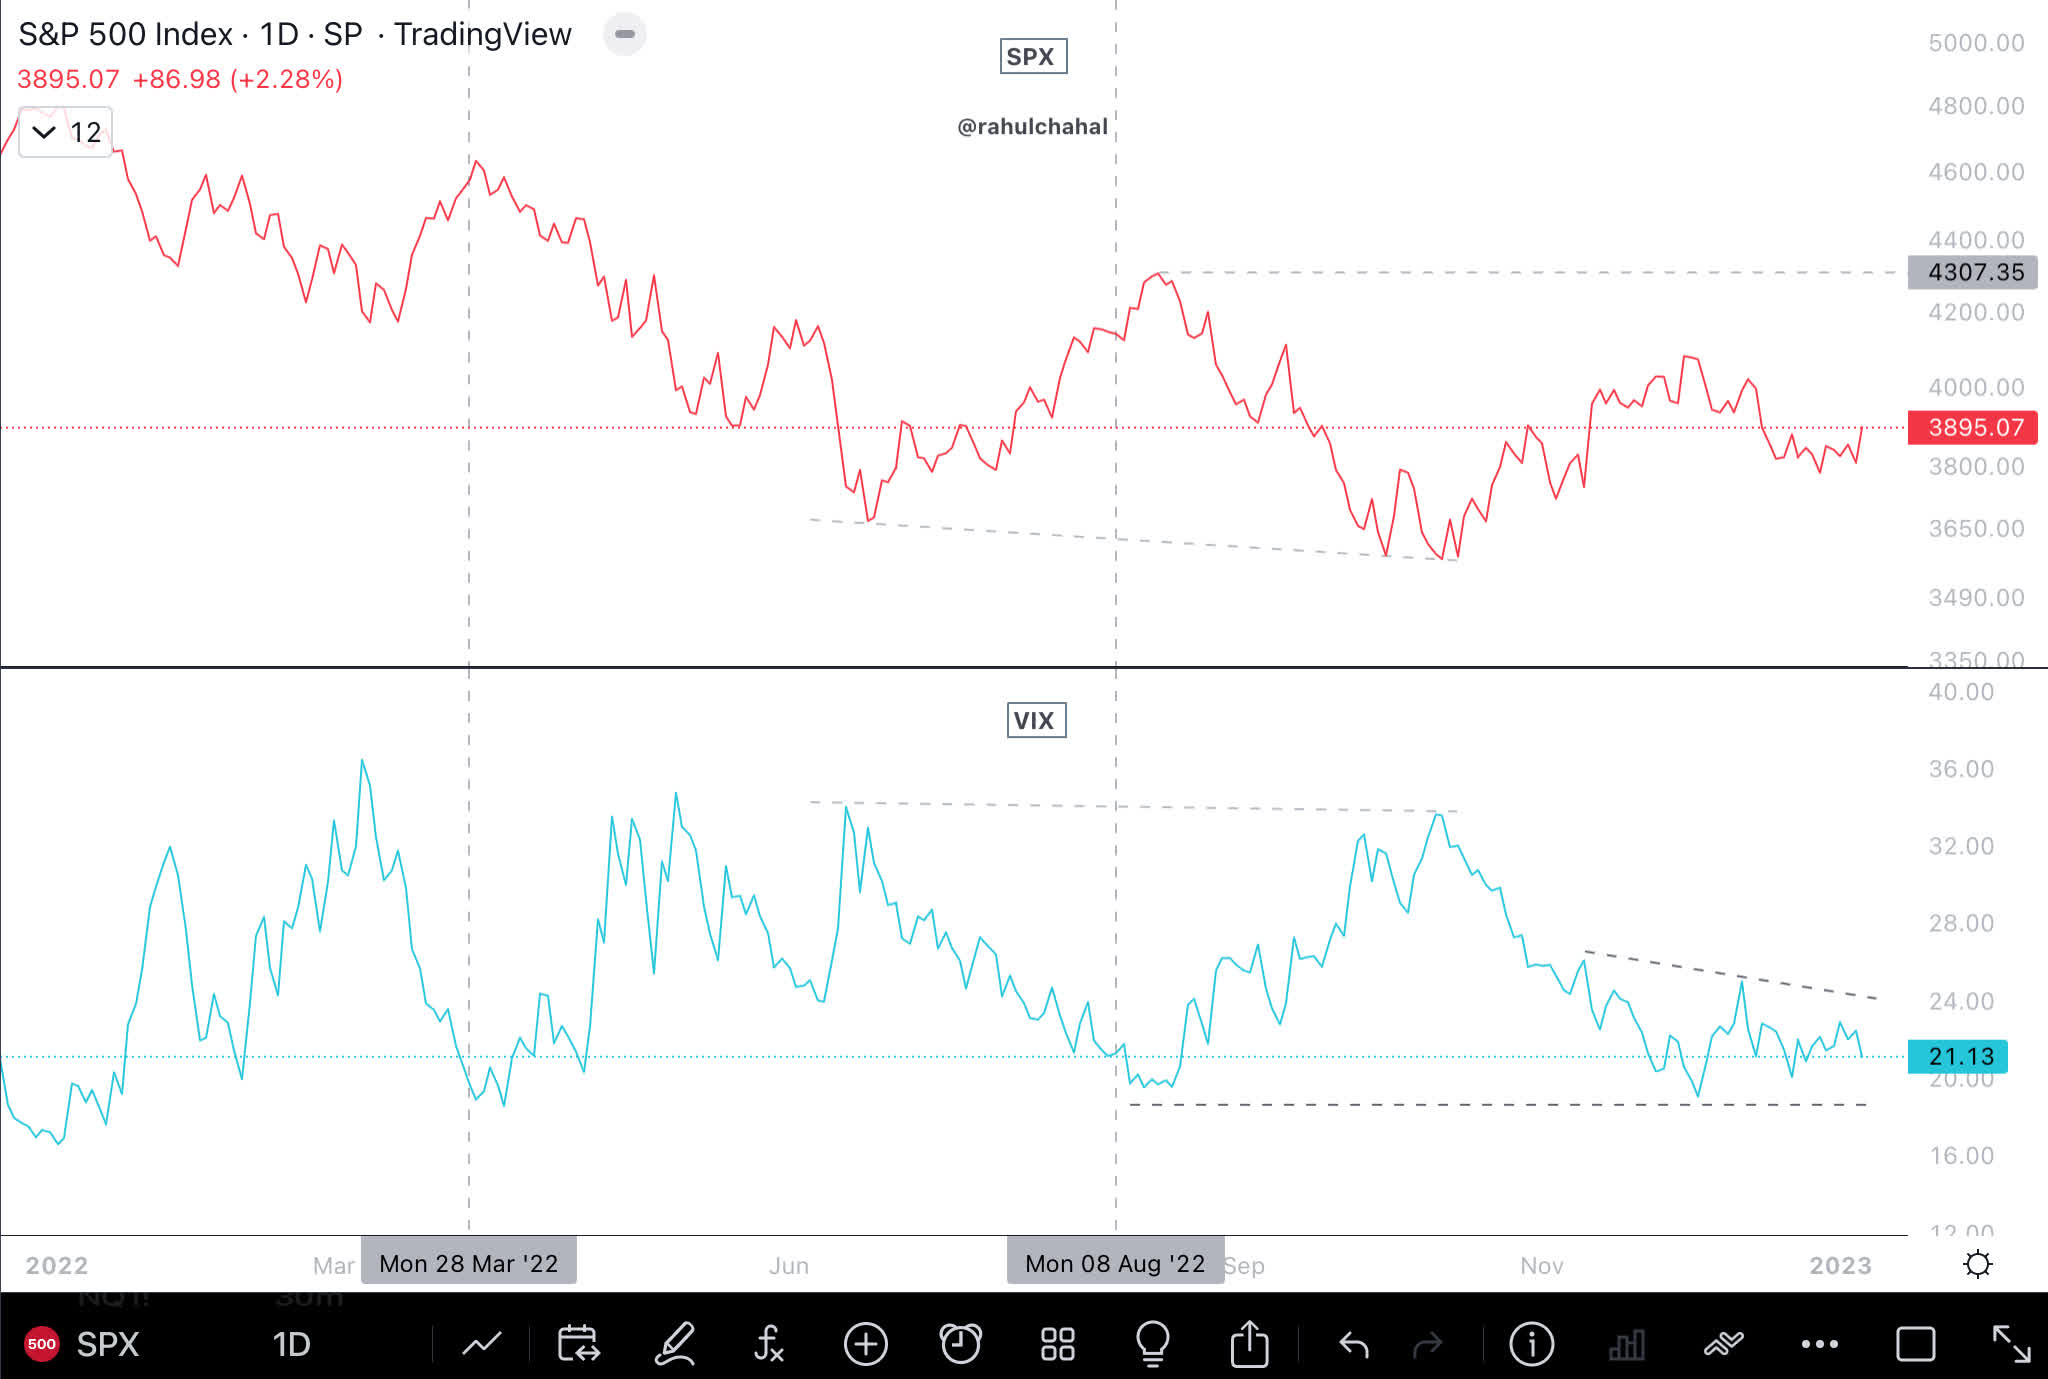
VIX, while still above the critical level of 20, has remained calm the past few weeks considering all the economic and geopolitical issues out there.
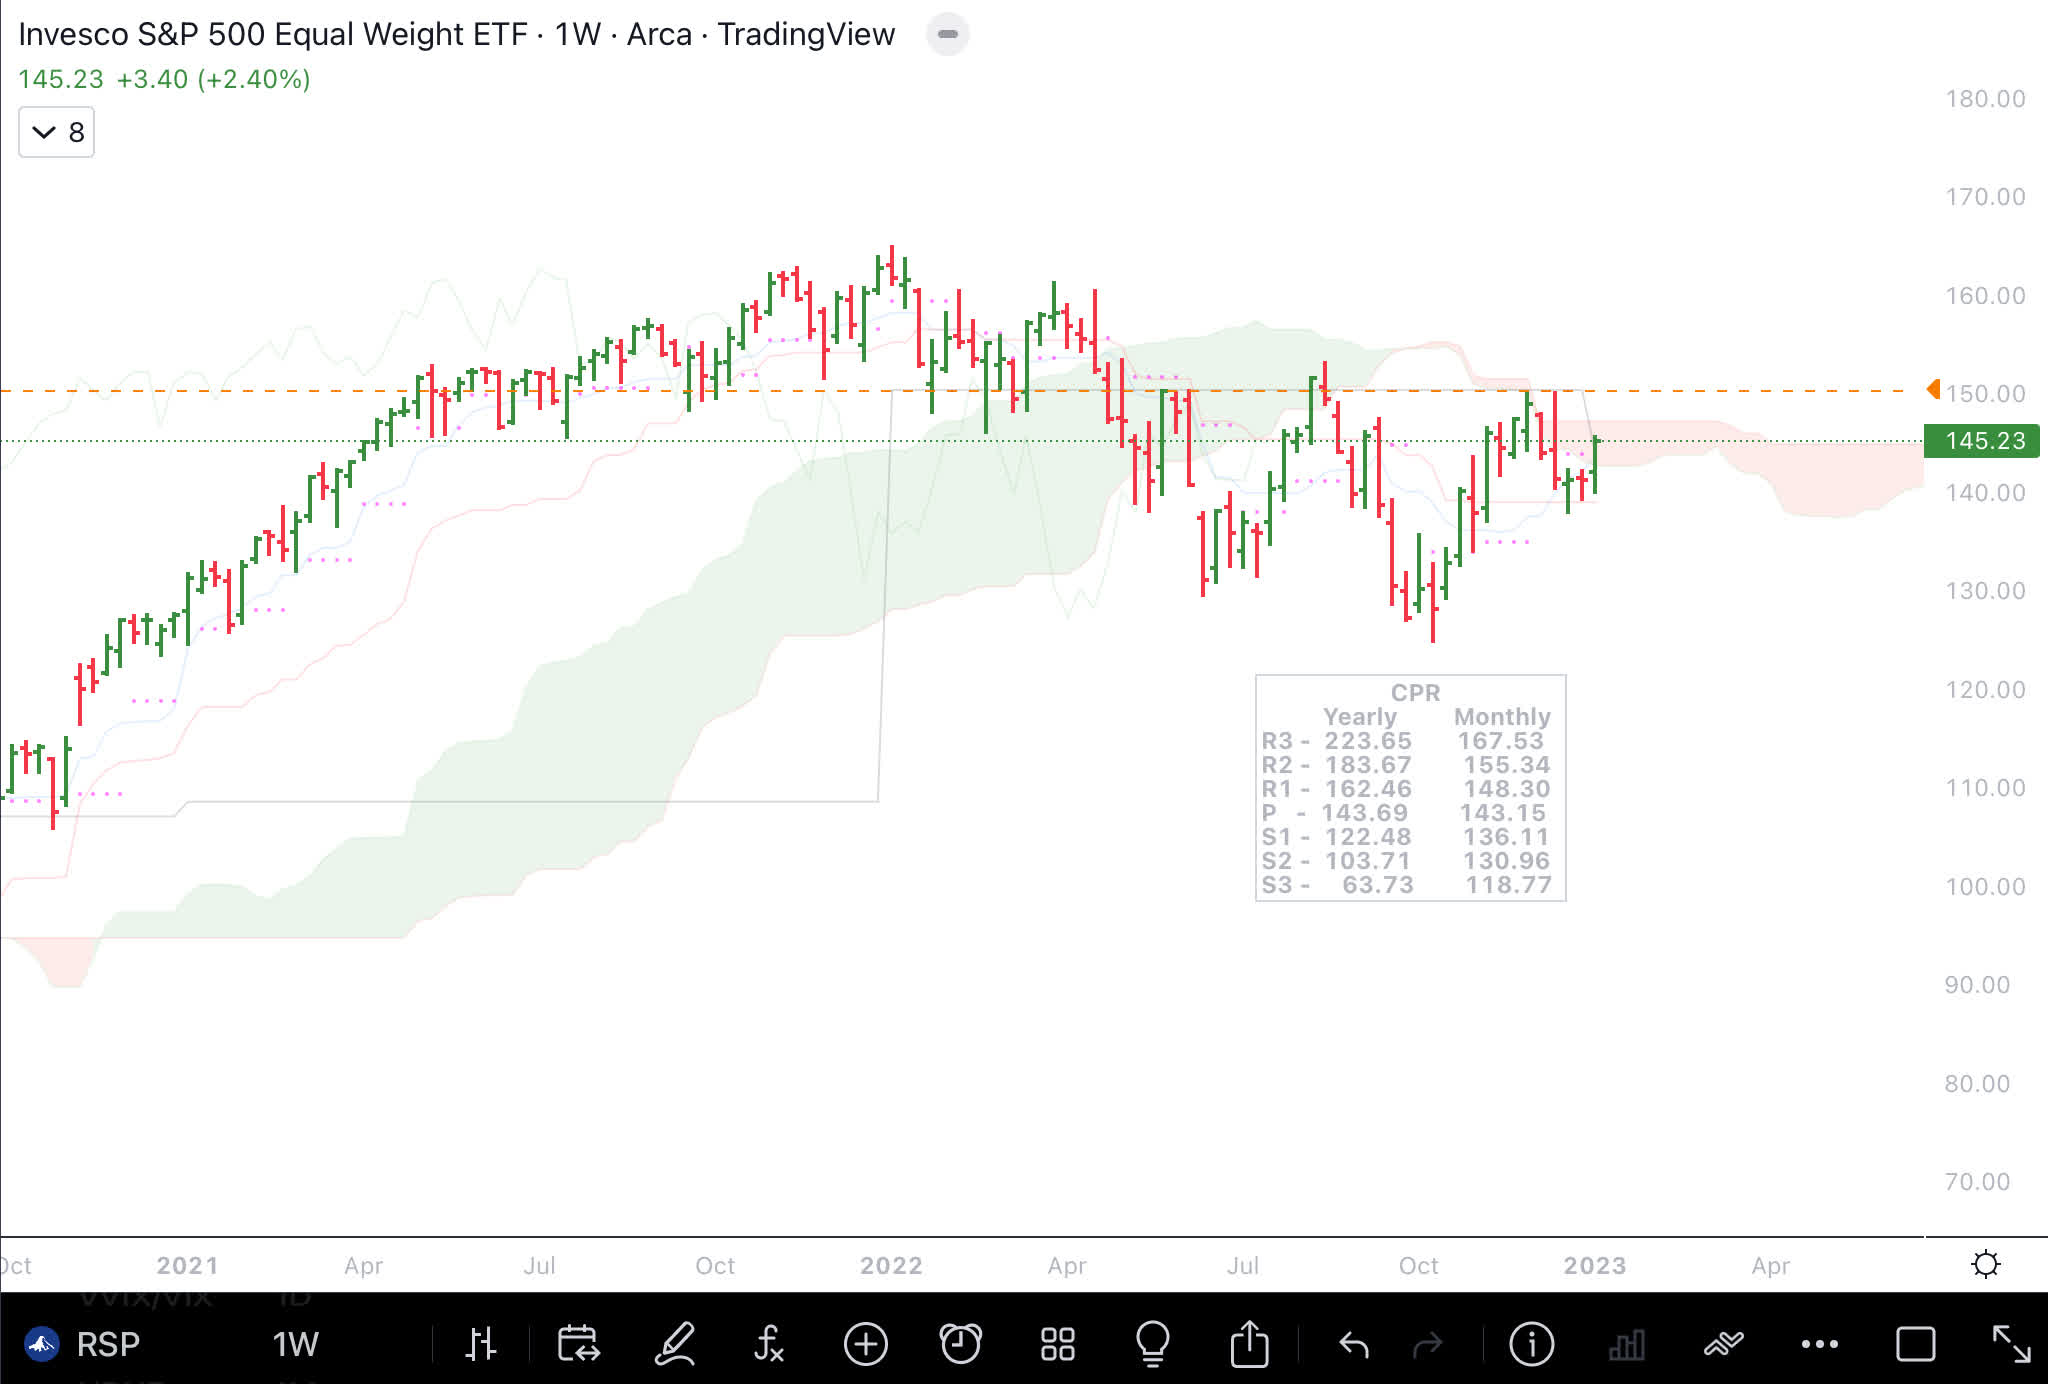
Equally weighted S&P 500 ( RSP ) is just closer to breaking out above the Ichimoku Ashi cloud and the resistance level of 150. Breaking above and staying above 150 would be positive, as it would mean the average stock is performing well.
Equally weighted S&P 500 (Author )
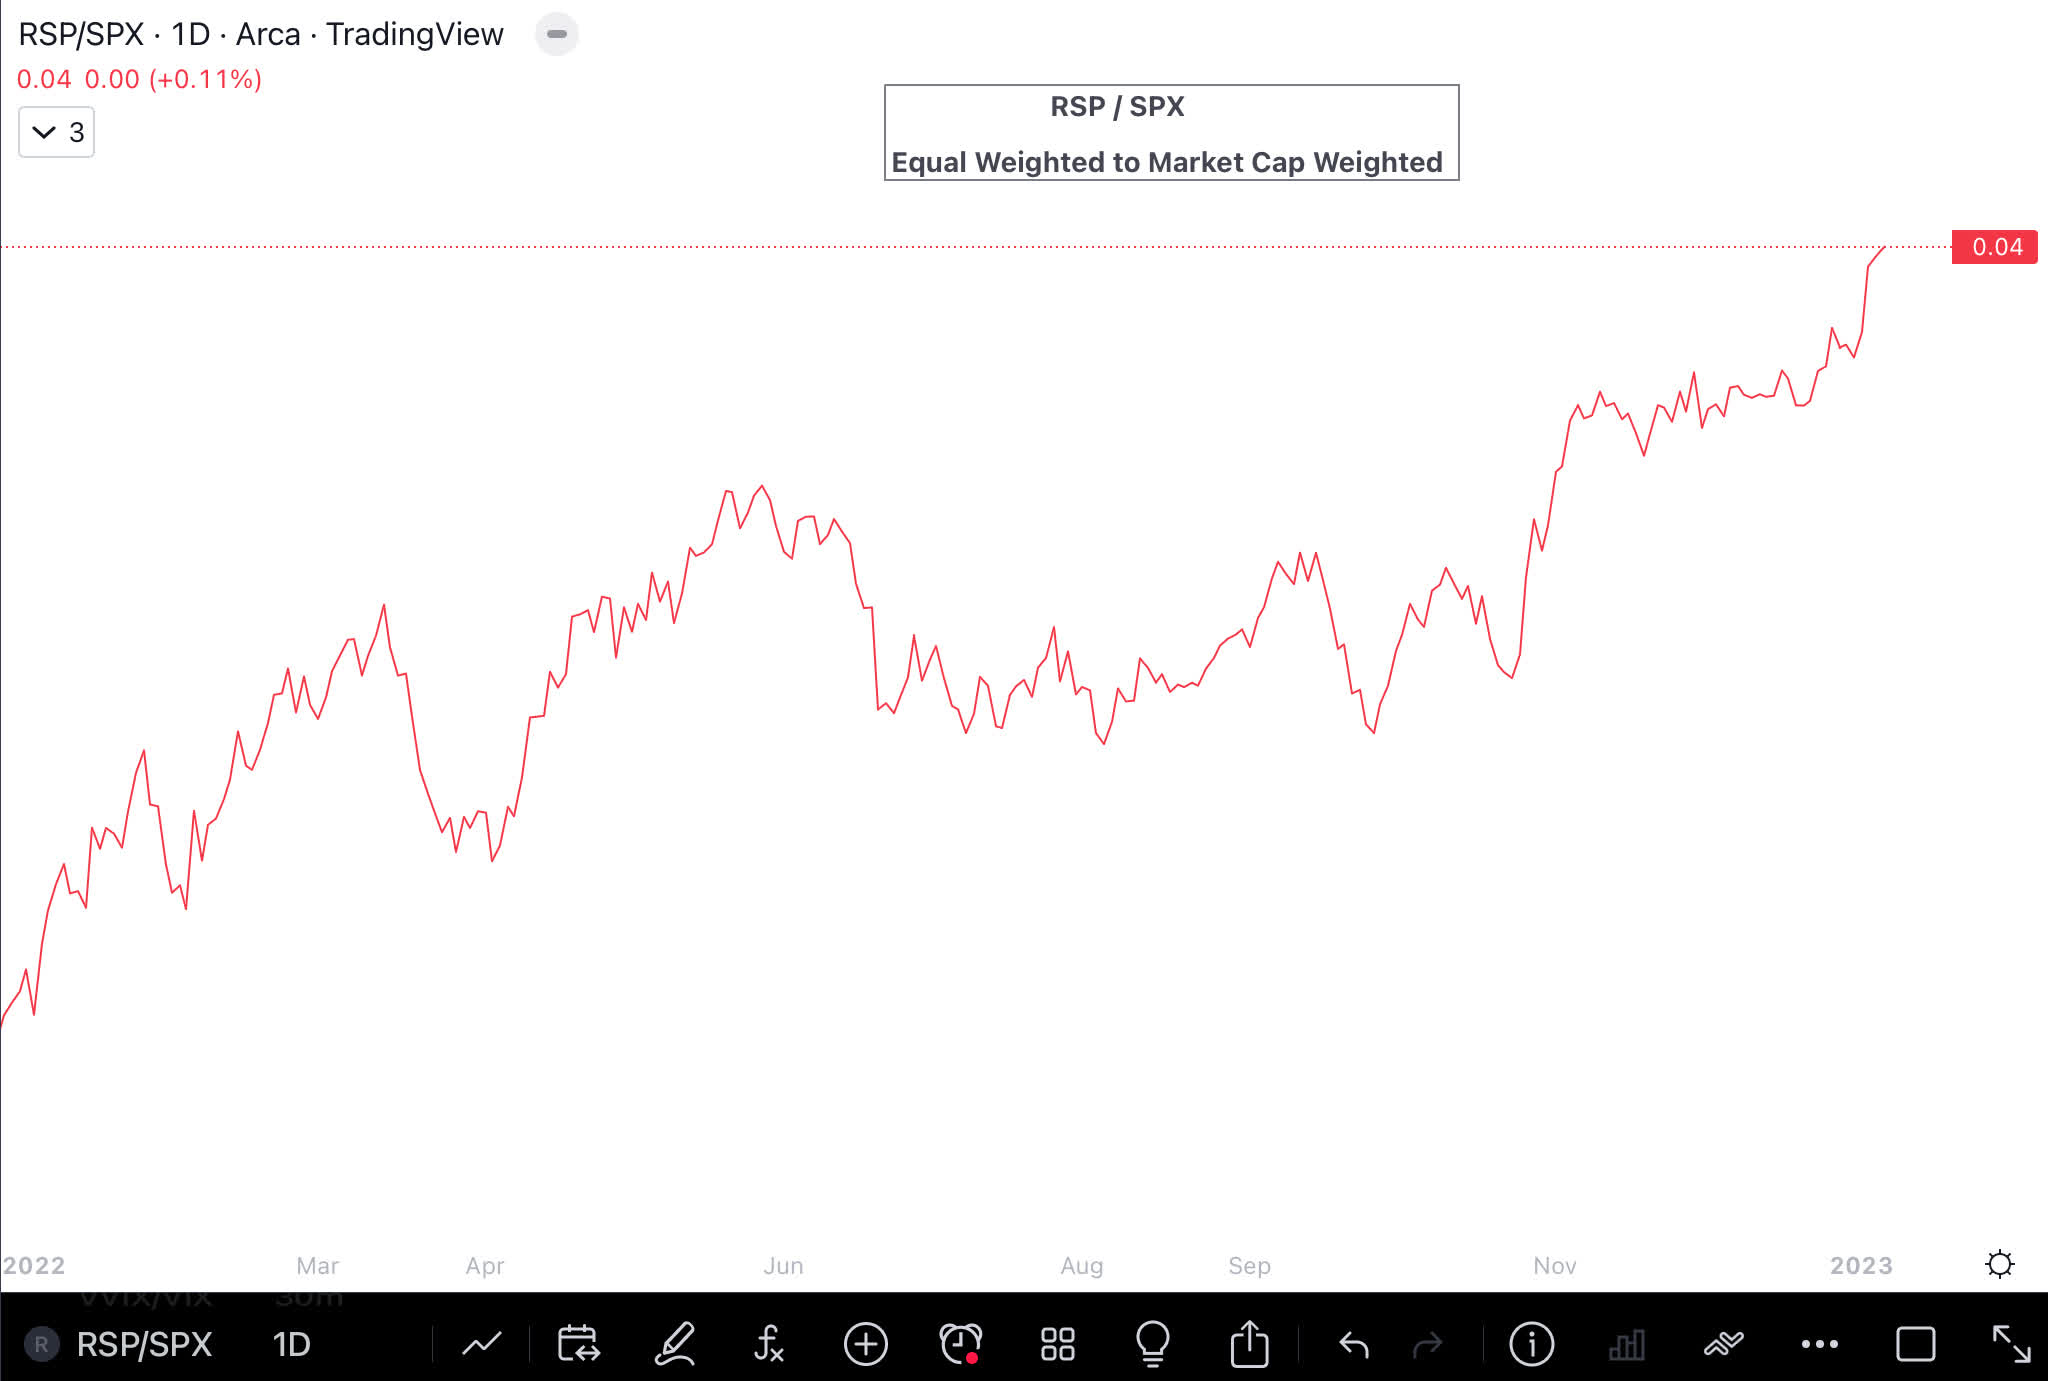
Equally weighted S&P 500 is outperforming the S&P 500, which means that the average stock is outperforming the largest market cap weighted stocks within S&P 500.
RSP to S&P 500 Ratio Chart (Author )
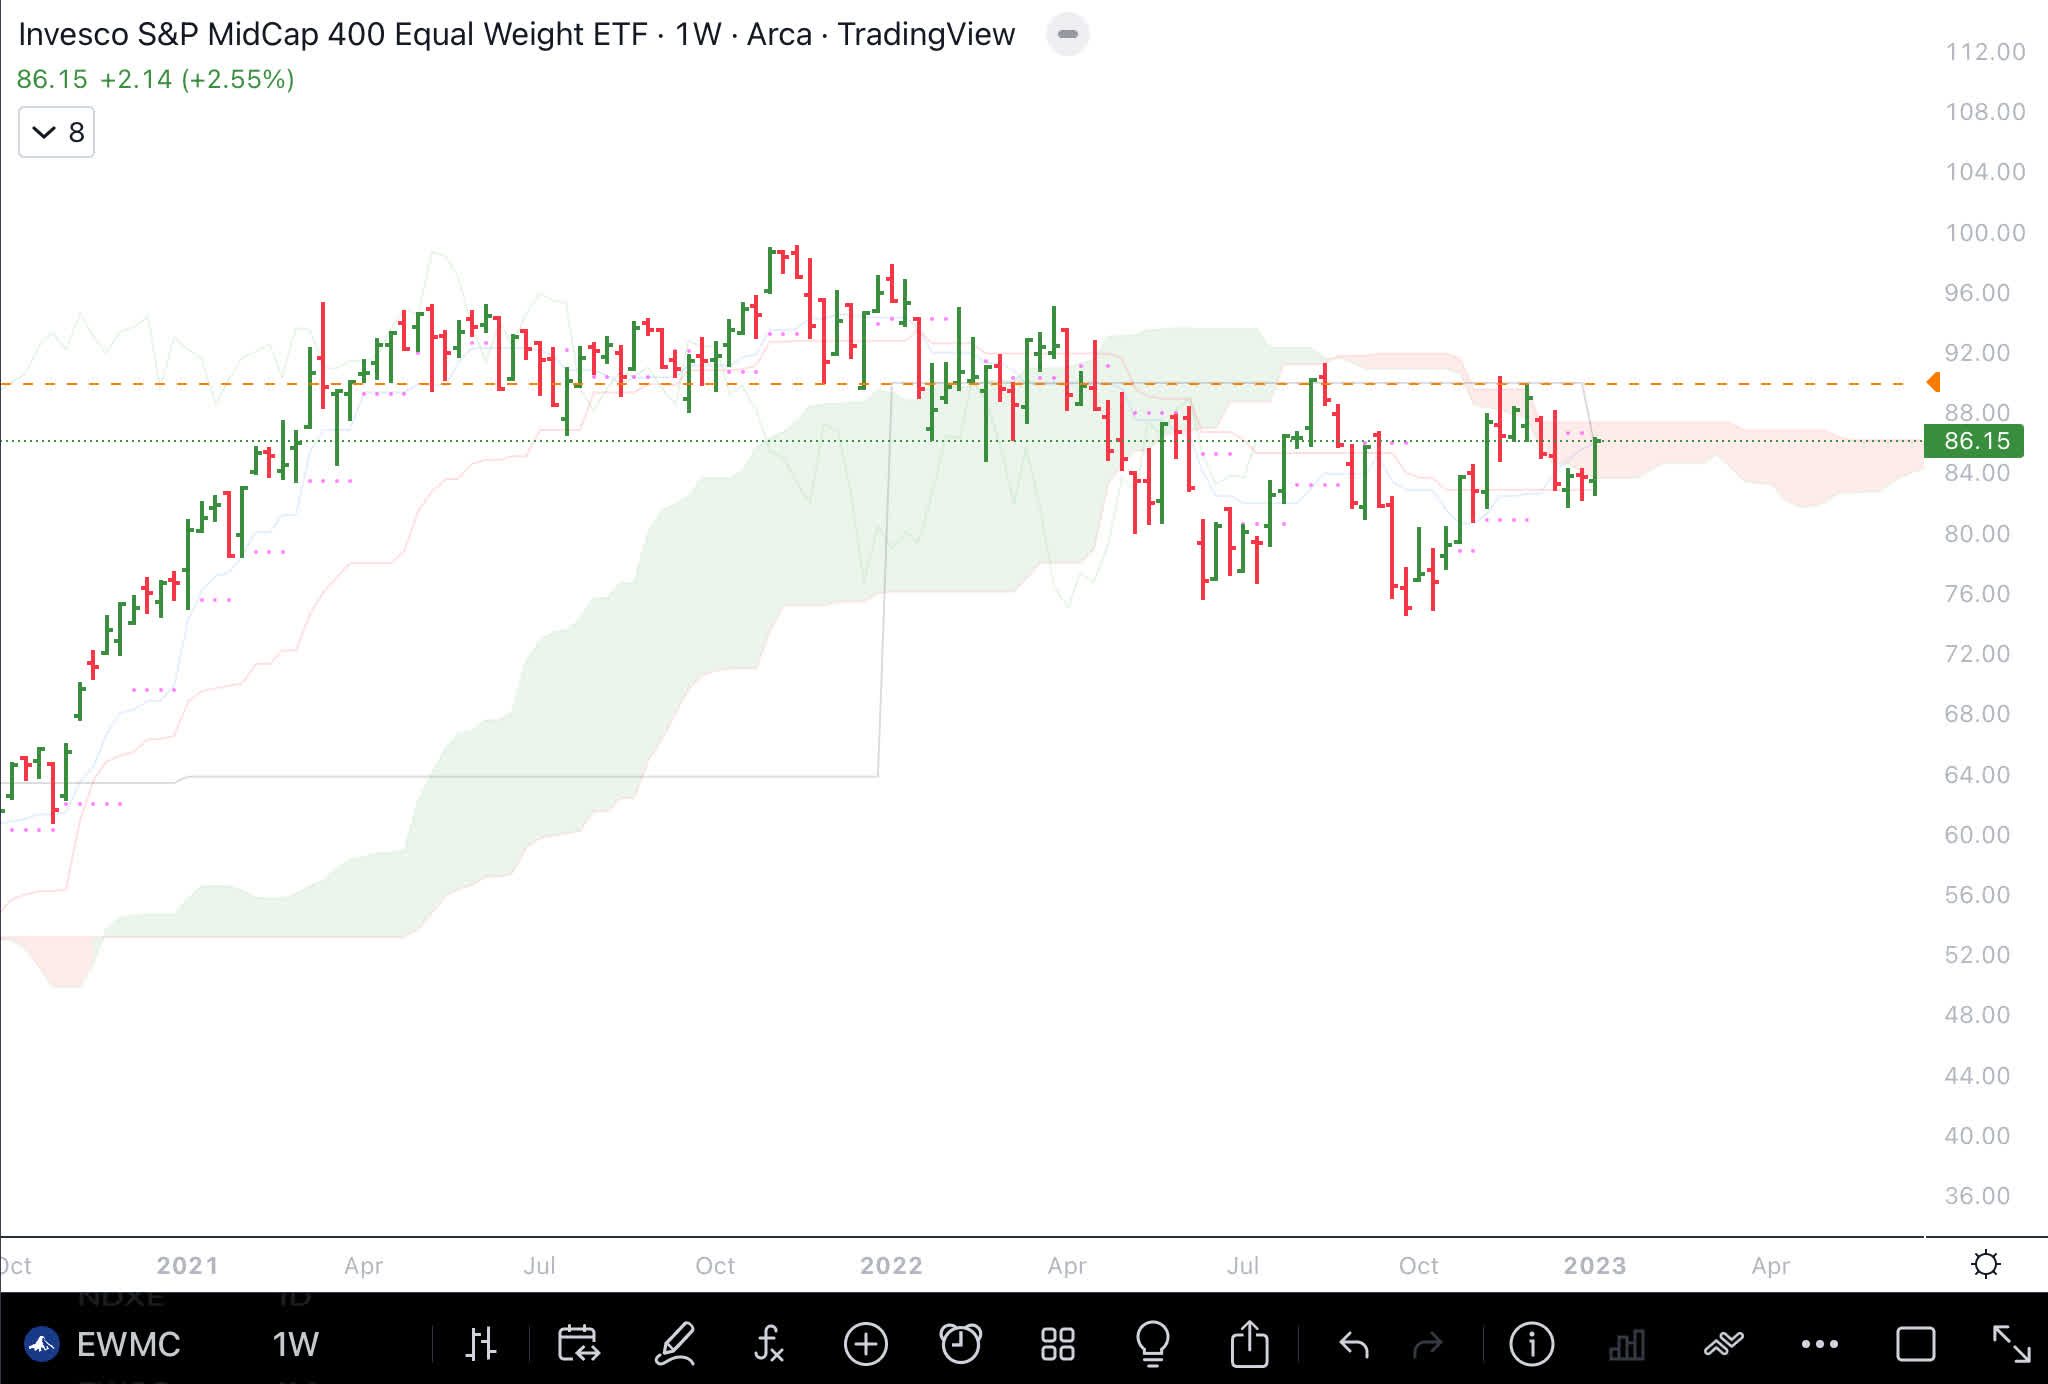
Mid cap equally weighted index ( EWMC ) is about to break out and close above the resistance level of around 91 and above the Ichimoku Ashi cloud.
EWMC Mid Cap Equal Weighted (Author )
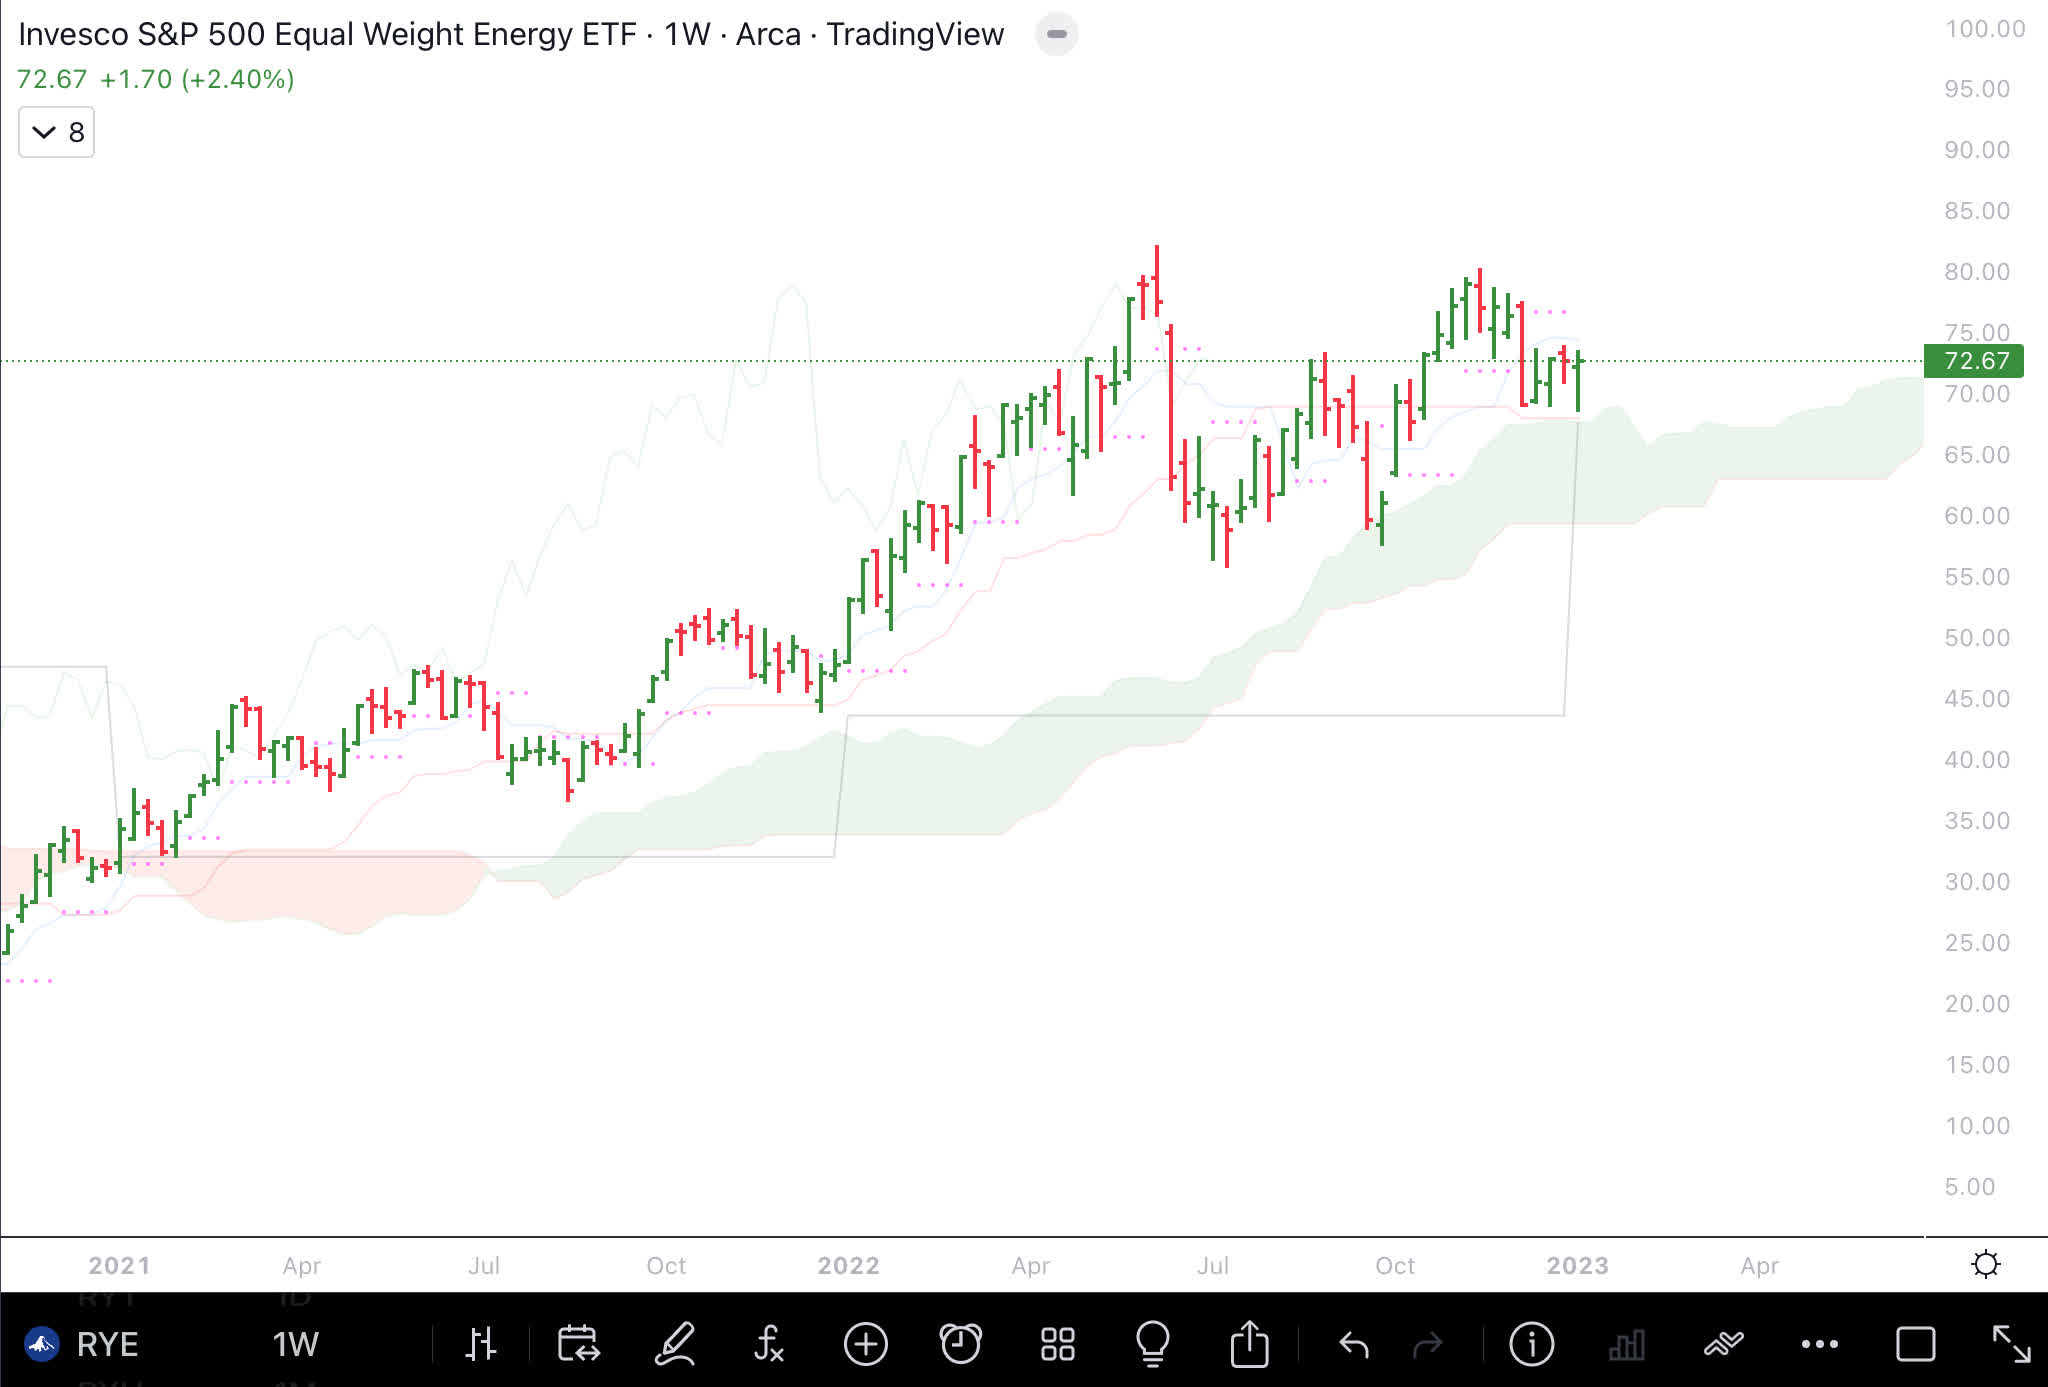
On an equal weighted basis, a number of industries are performing well. The first one is the energy sector. The equally weighted S&P 500 energy sector ( RYE ) has gone sideways in 2022 after a big move up in 2021. The weekly chart does look bullish as long as prices remain above the cloud.
Equally weighted S&P Energy Sector (Author )
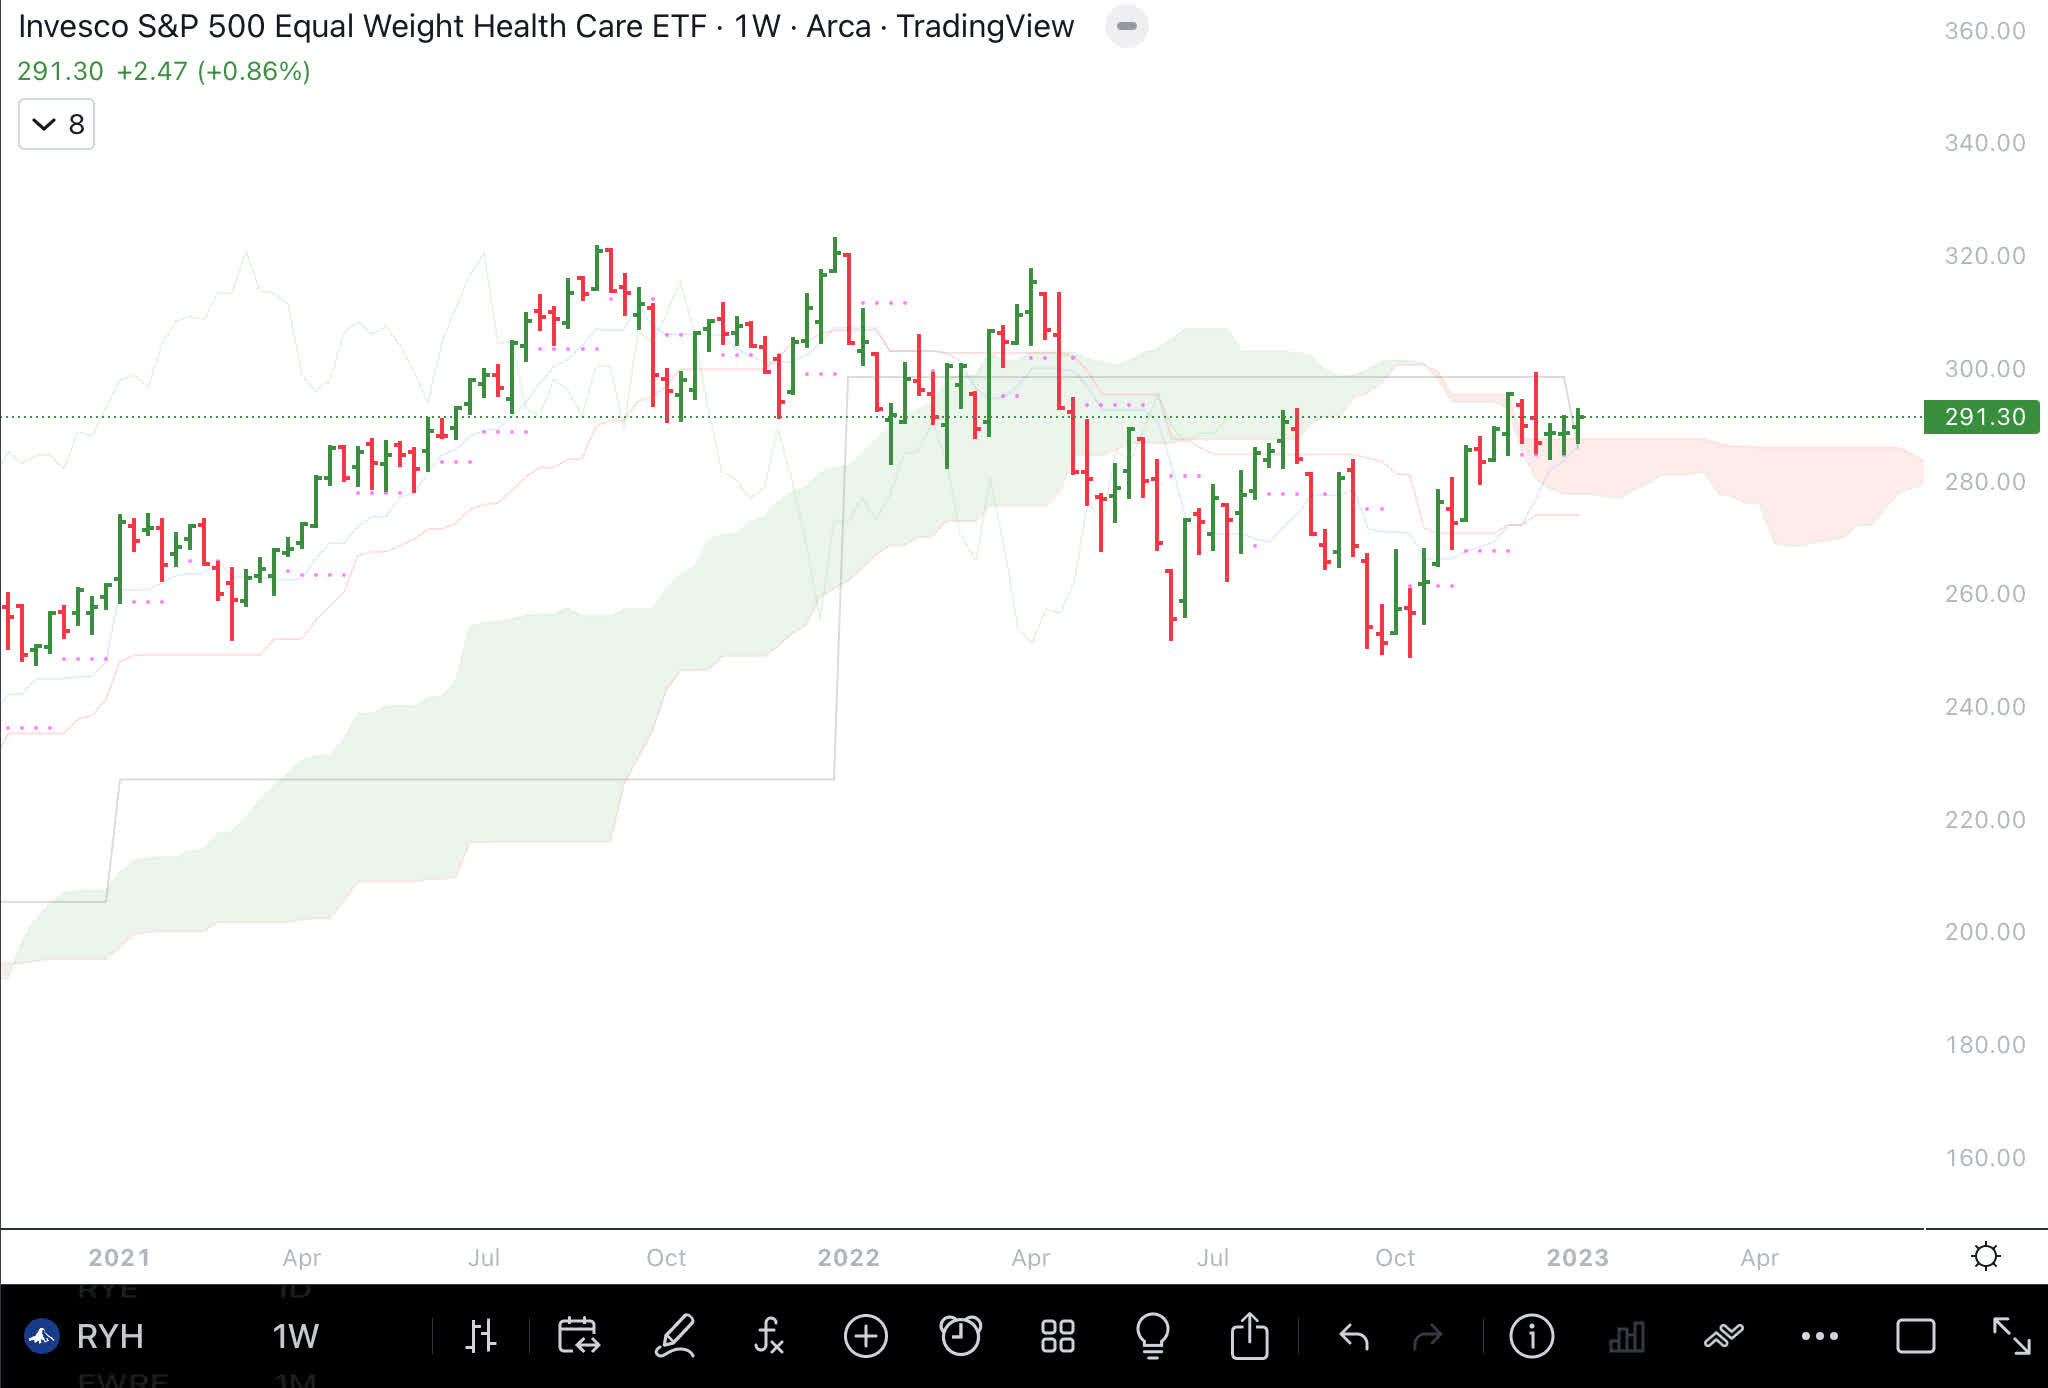
Equally weighted S&P 500 healthcare ( RYH ) is breaking out and about to go on an uptrend if it can close and stay above 300.
Equally weighted S&P Health Care (Author )
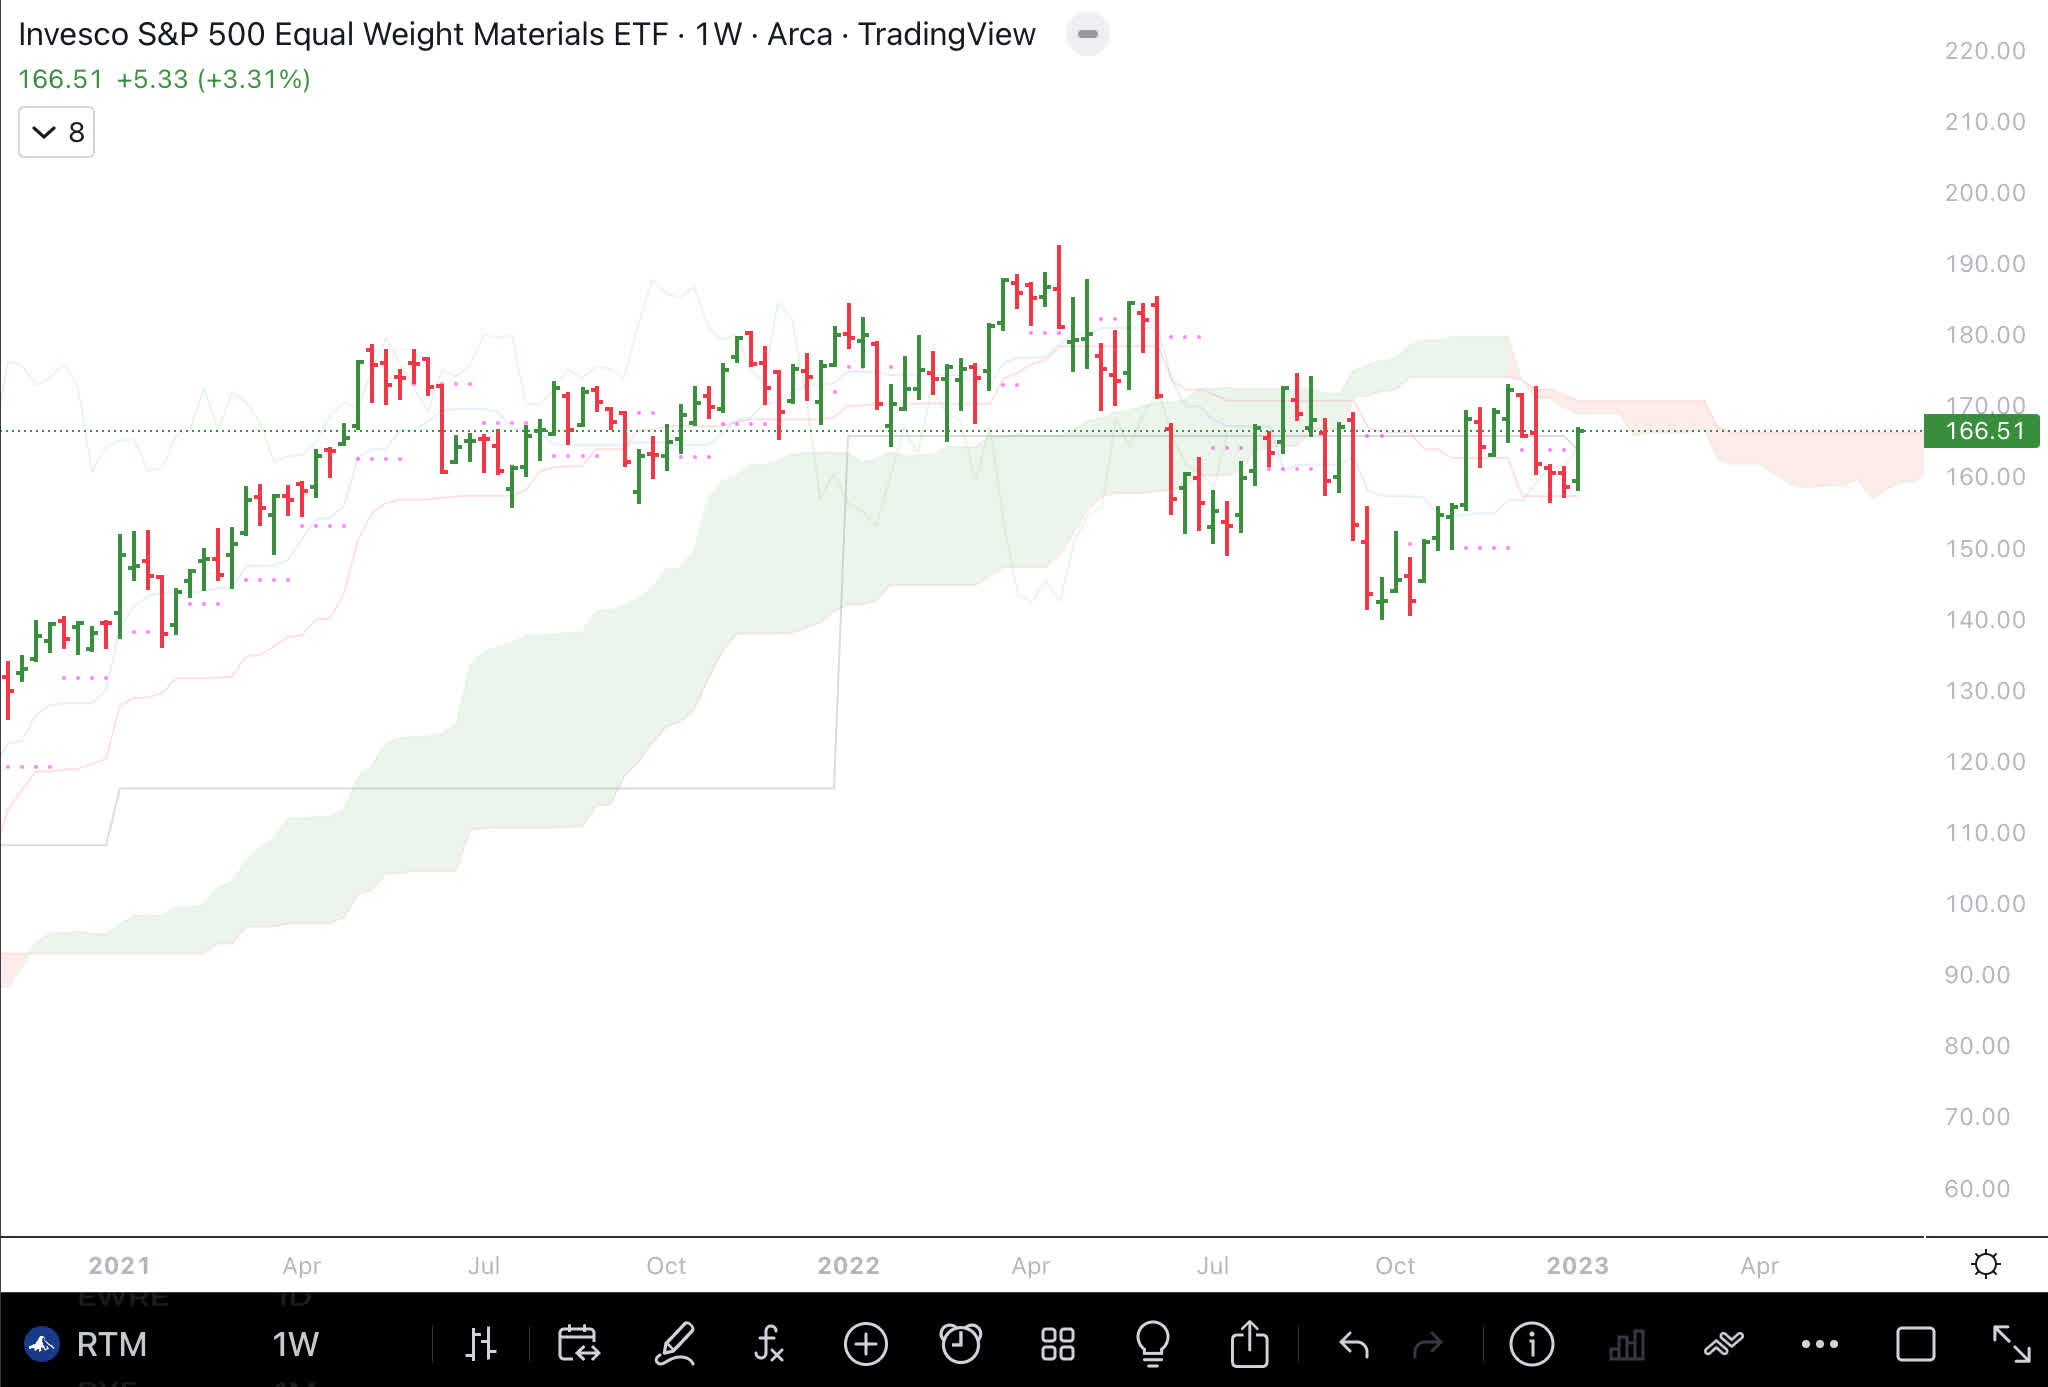
Equally weighted S&P 500 material sector ( RTM ) is also getting close to starting an uptrend if it can break and close above the cloud.
Equally weighted S&P Material (Author)
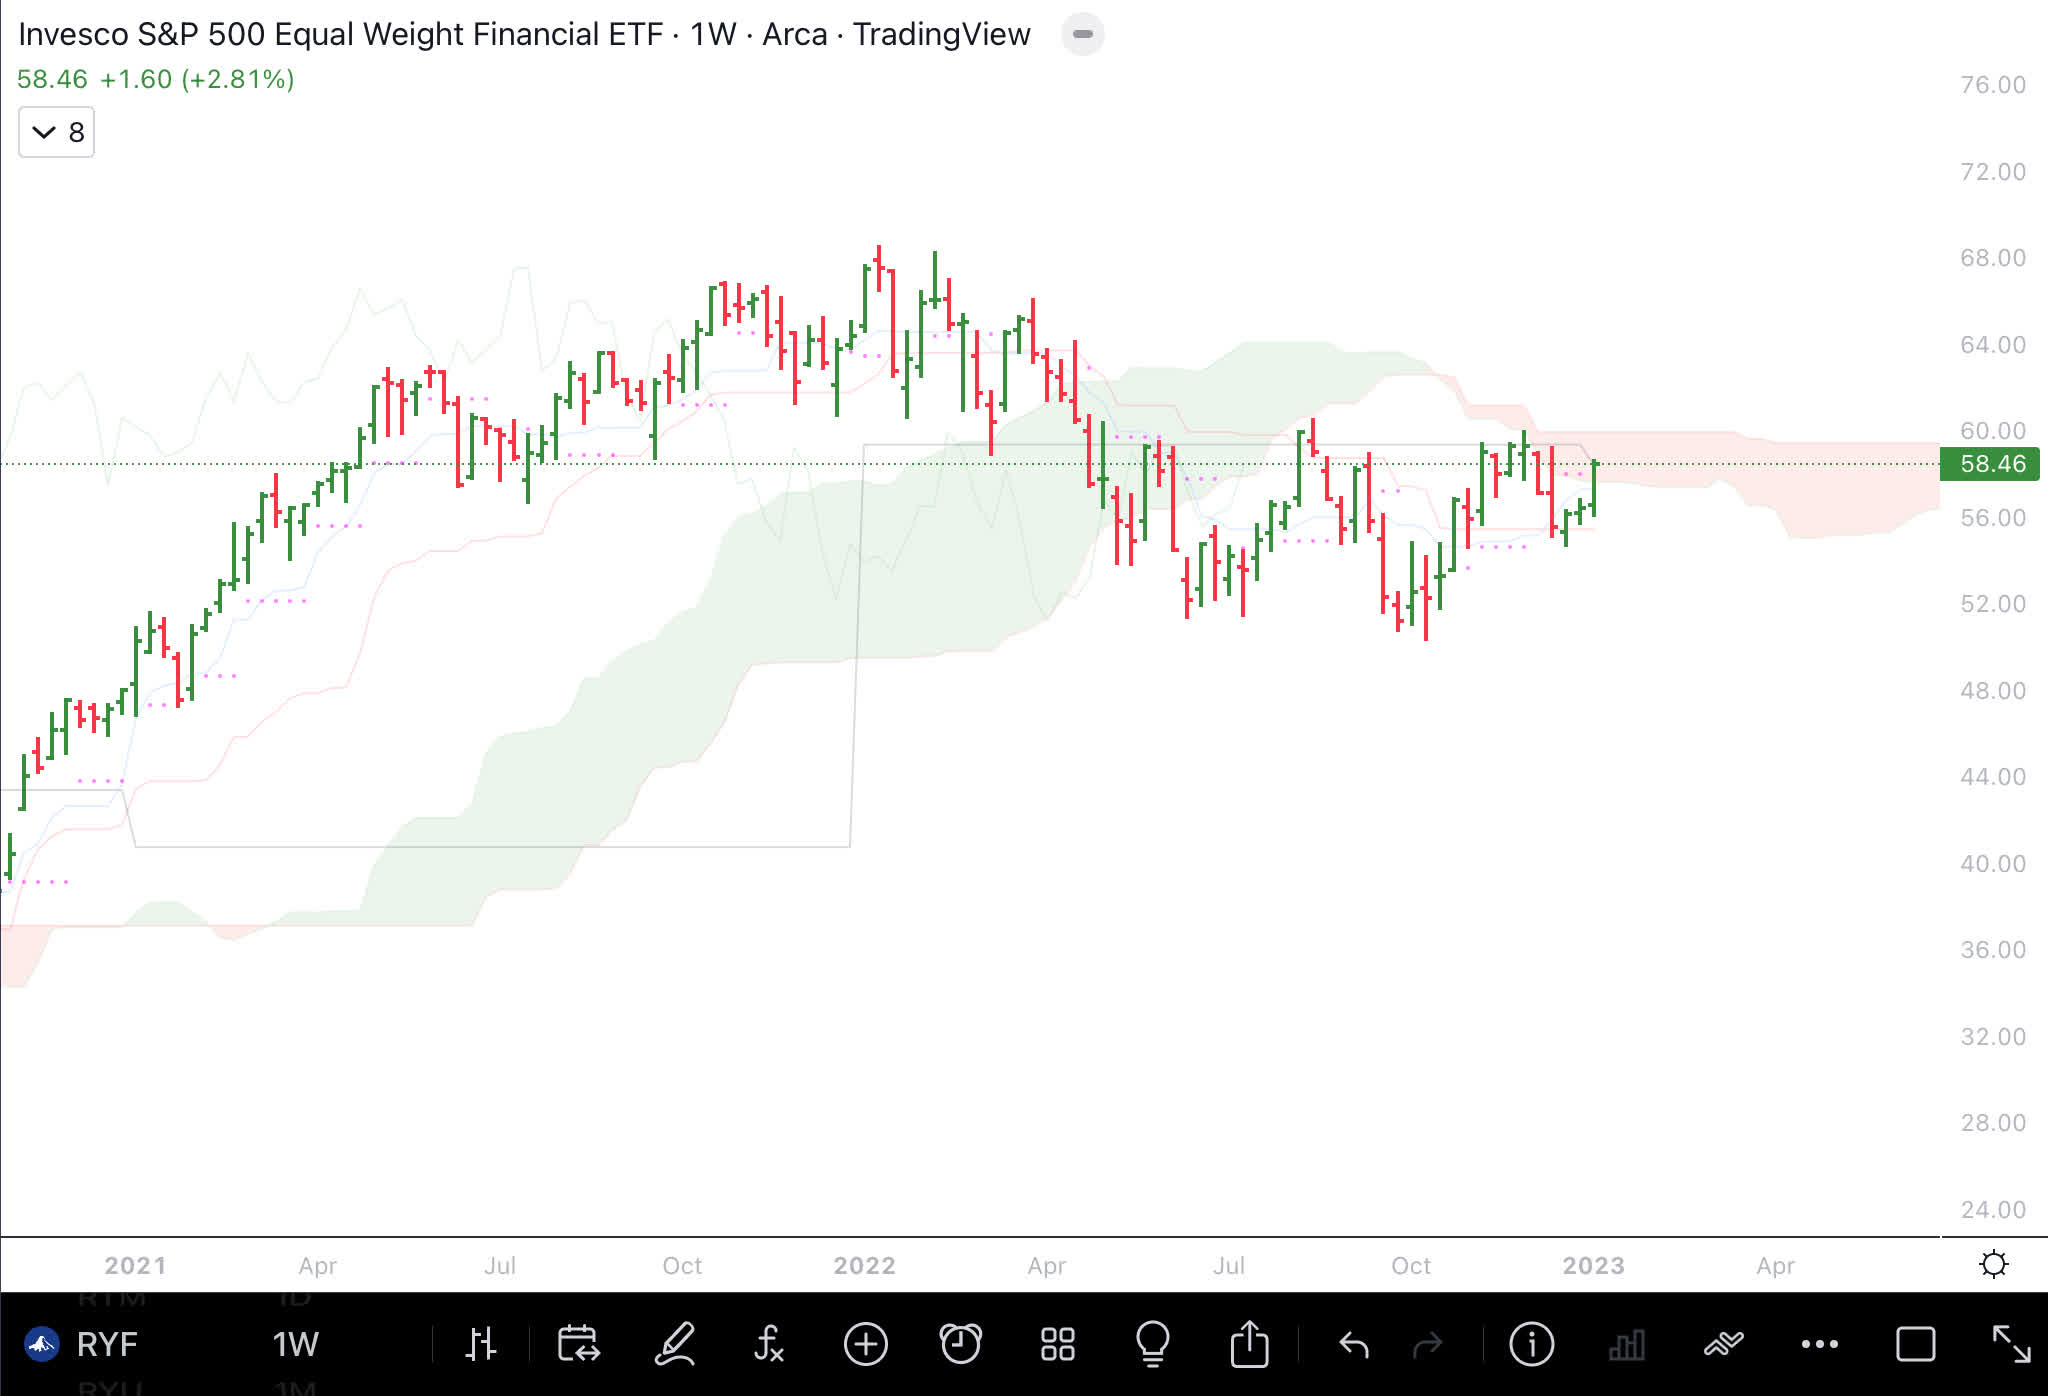
Equally weighted S&P 500 financial (RYF) is also on the verge of breaking out into an uptrend if it can close above the cloud.
Equally weighted S&P Financial (Author )
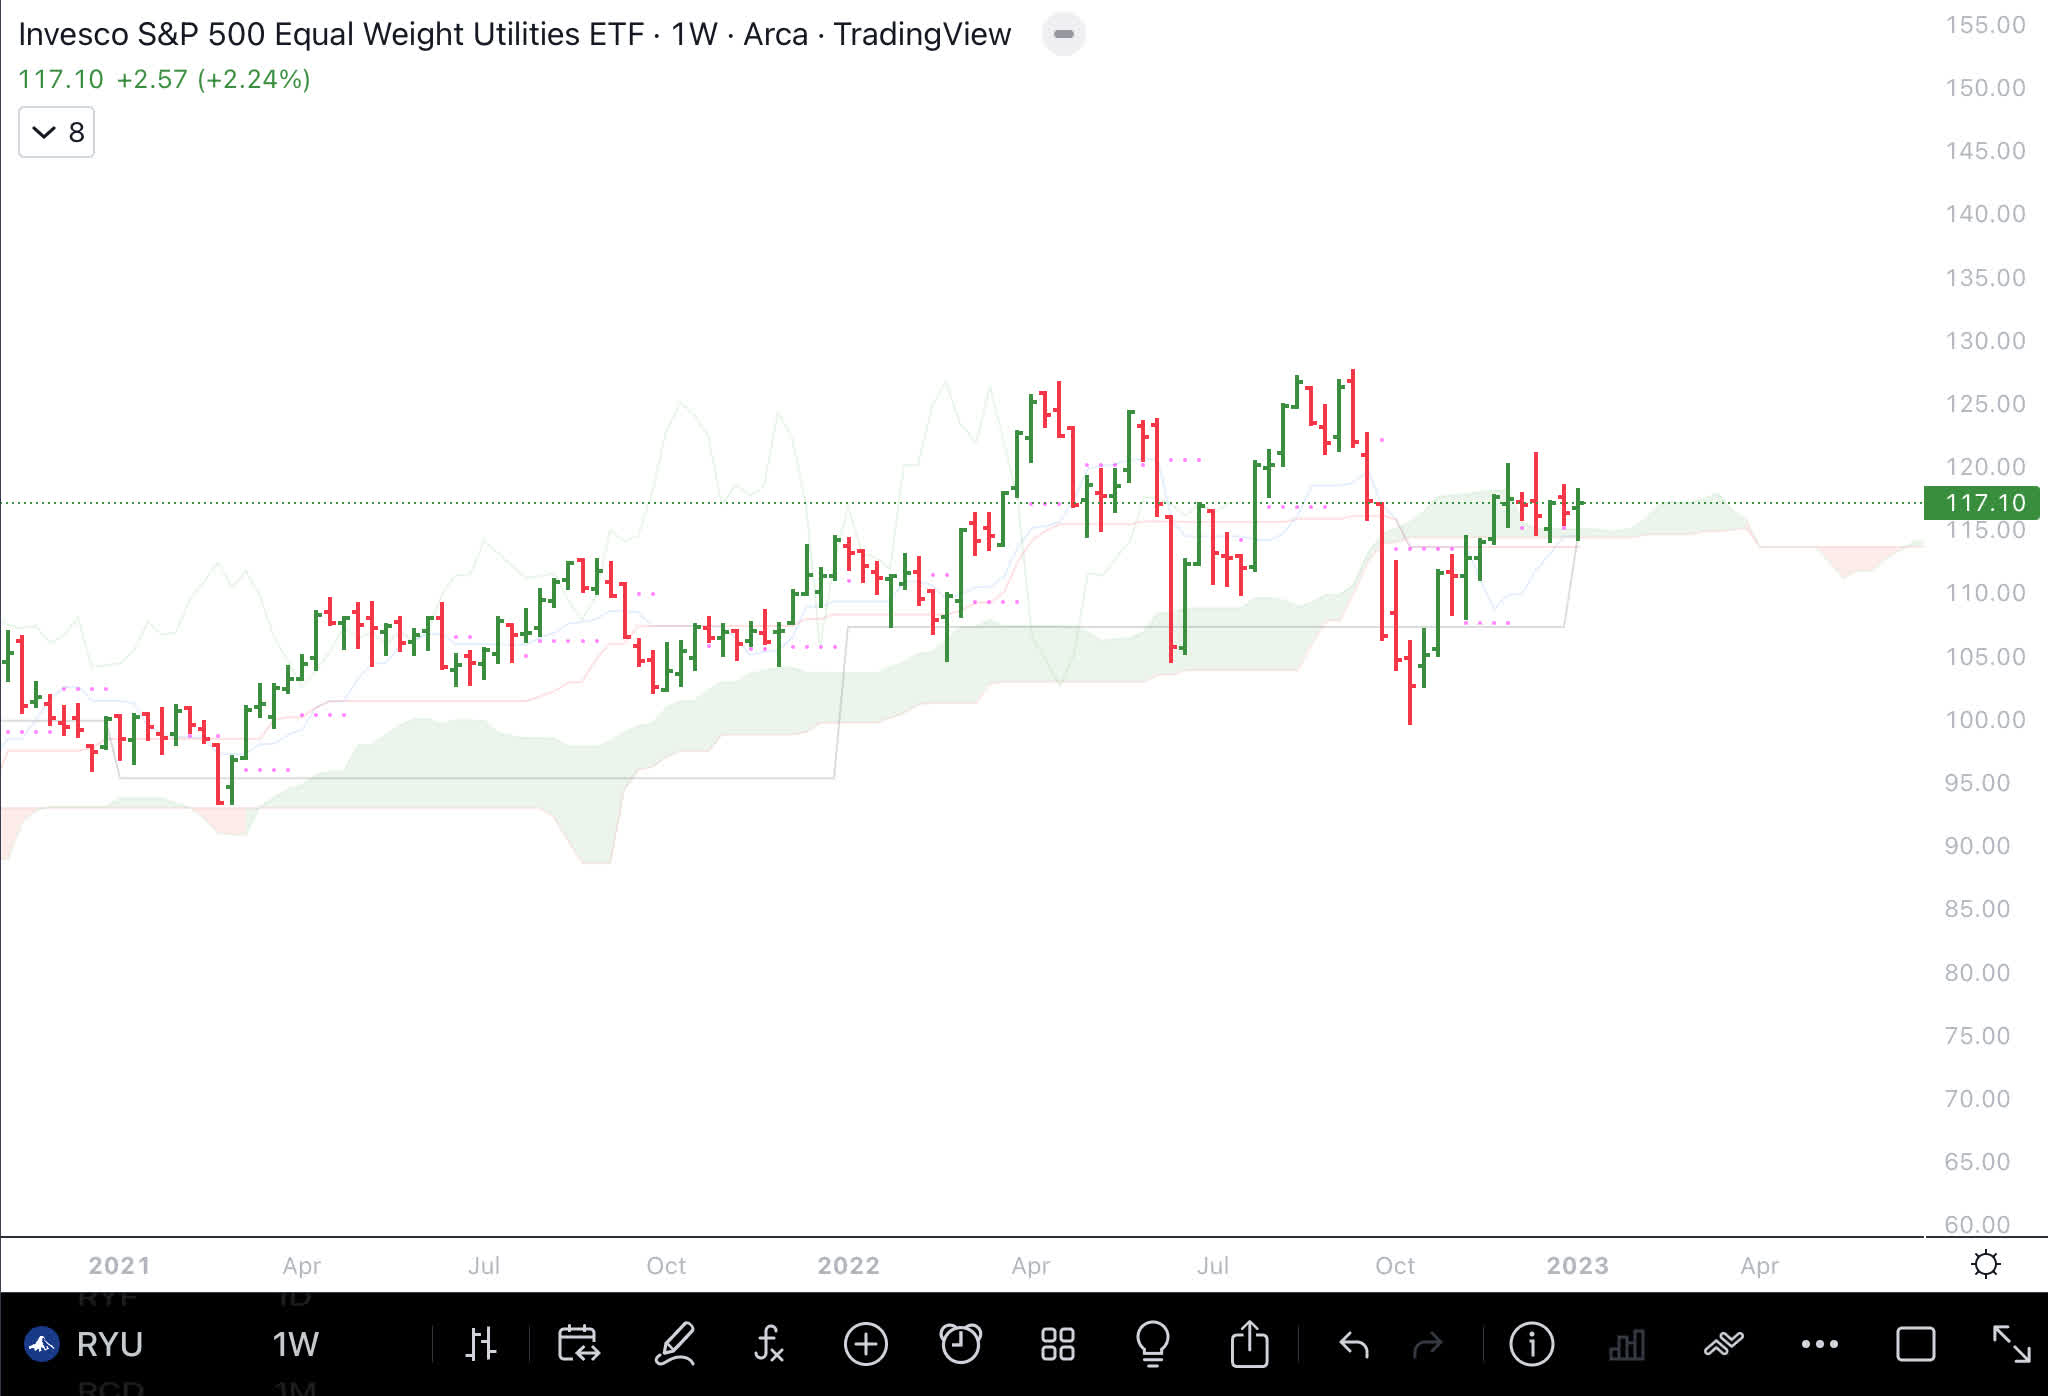
Equally weighted S&P 500 utilities index ( RYU ) is above the cloud.
Equally weighted S&P Utility Sector (Author )
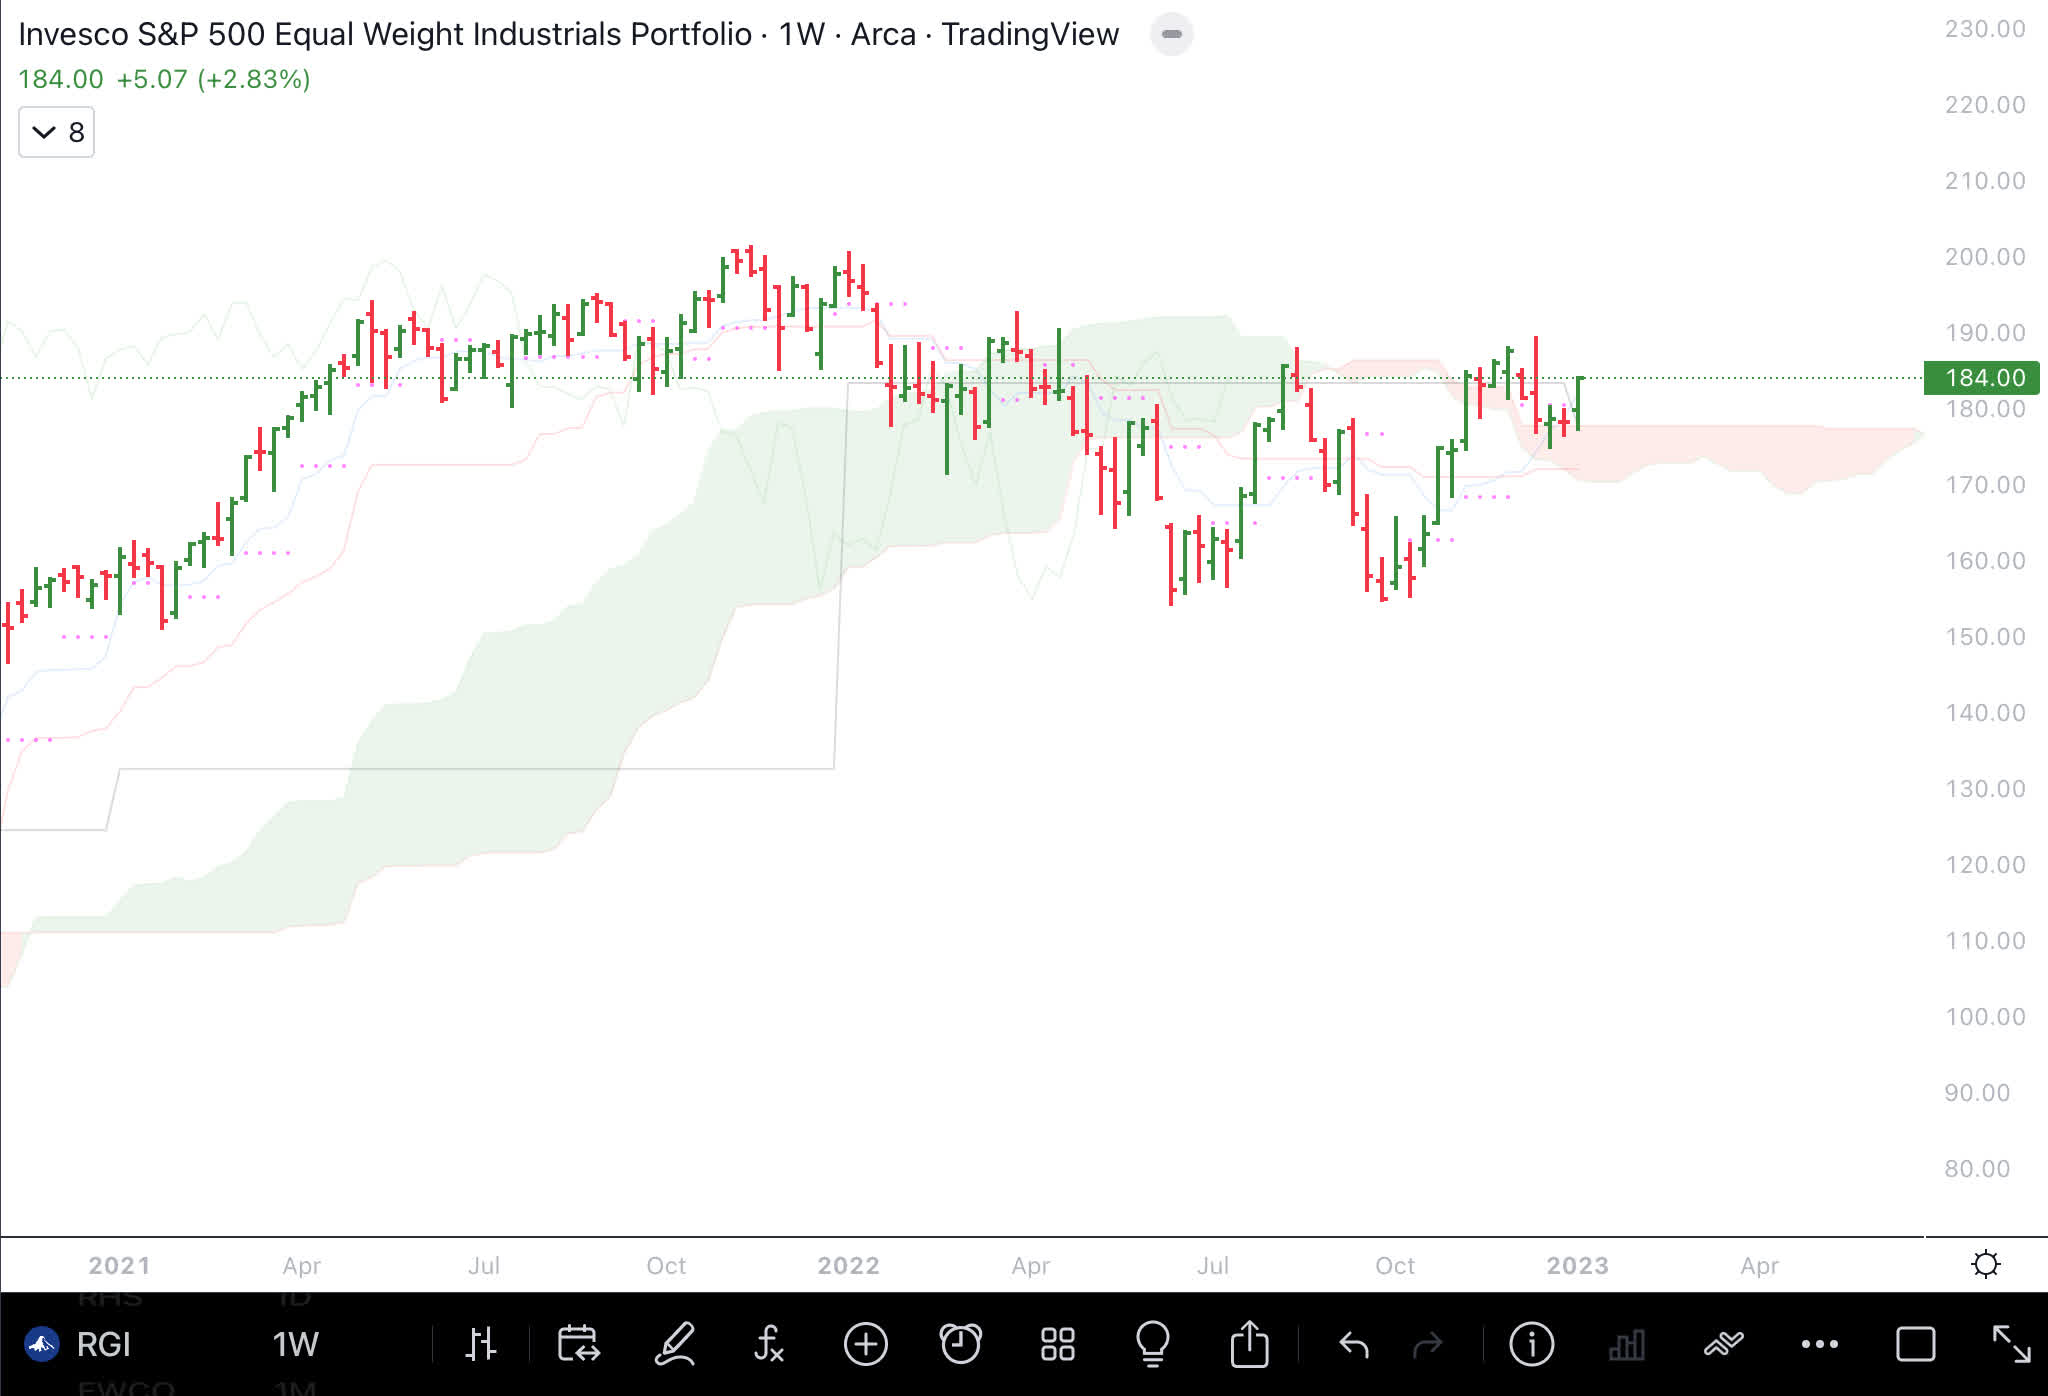
Equally weighted S&P 500 industrial index ( RGI ) is above the cloud and looking likely to go higher.
Equally weighted S&P Industrial Sector (Author )
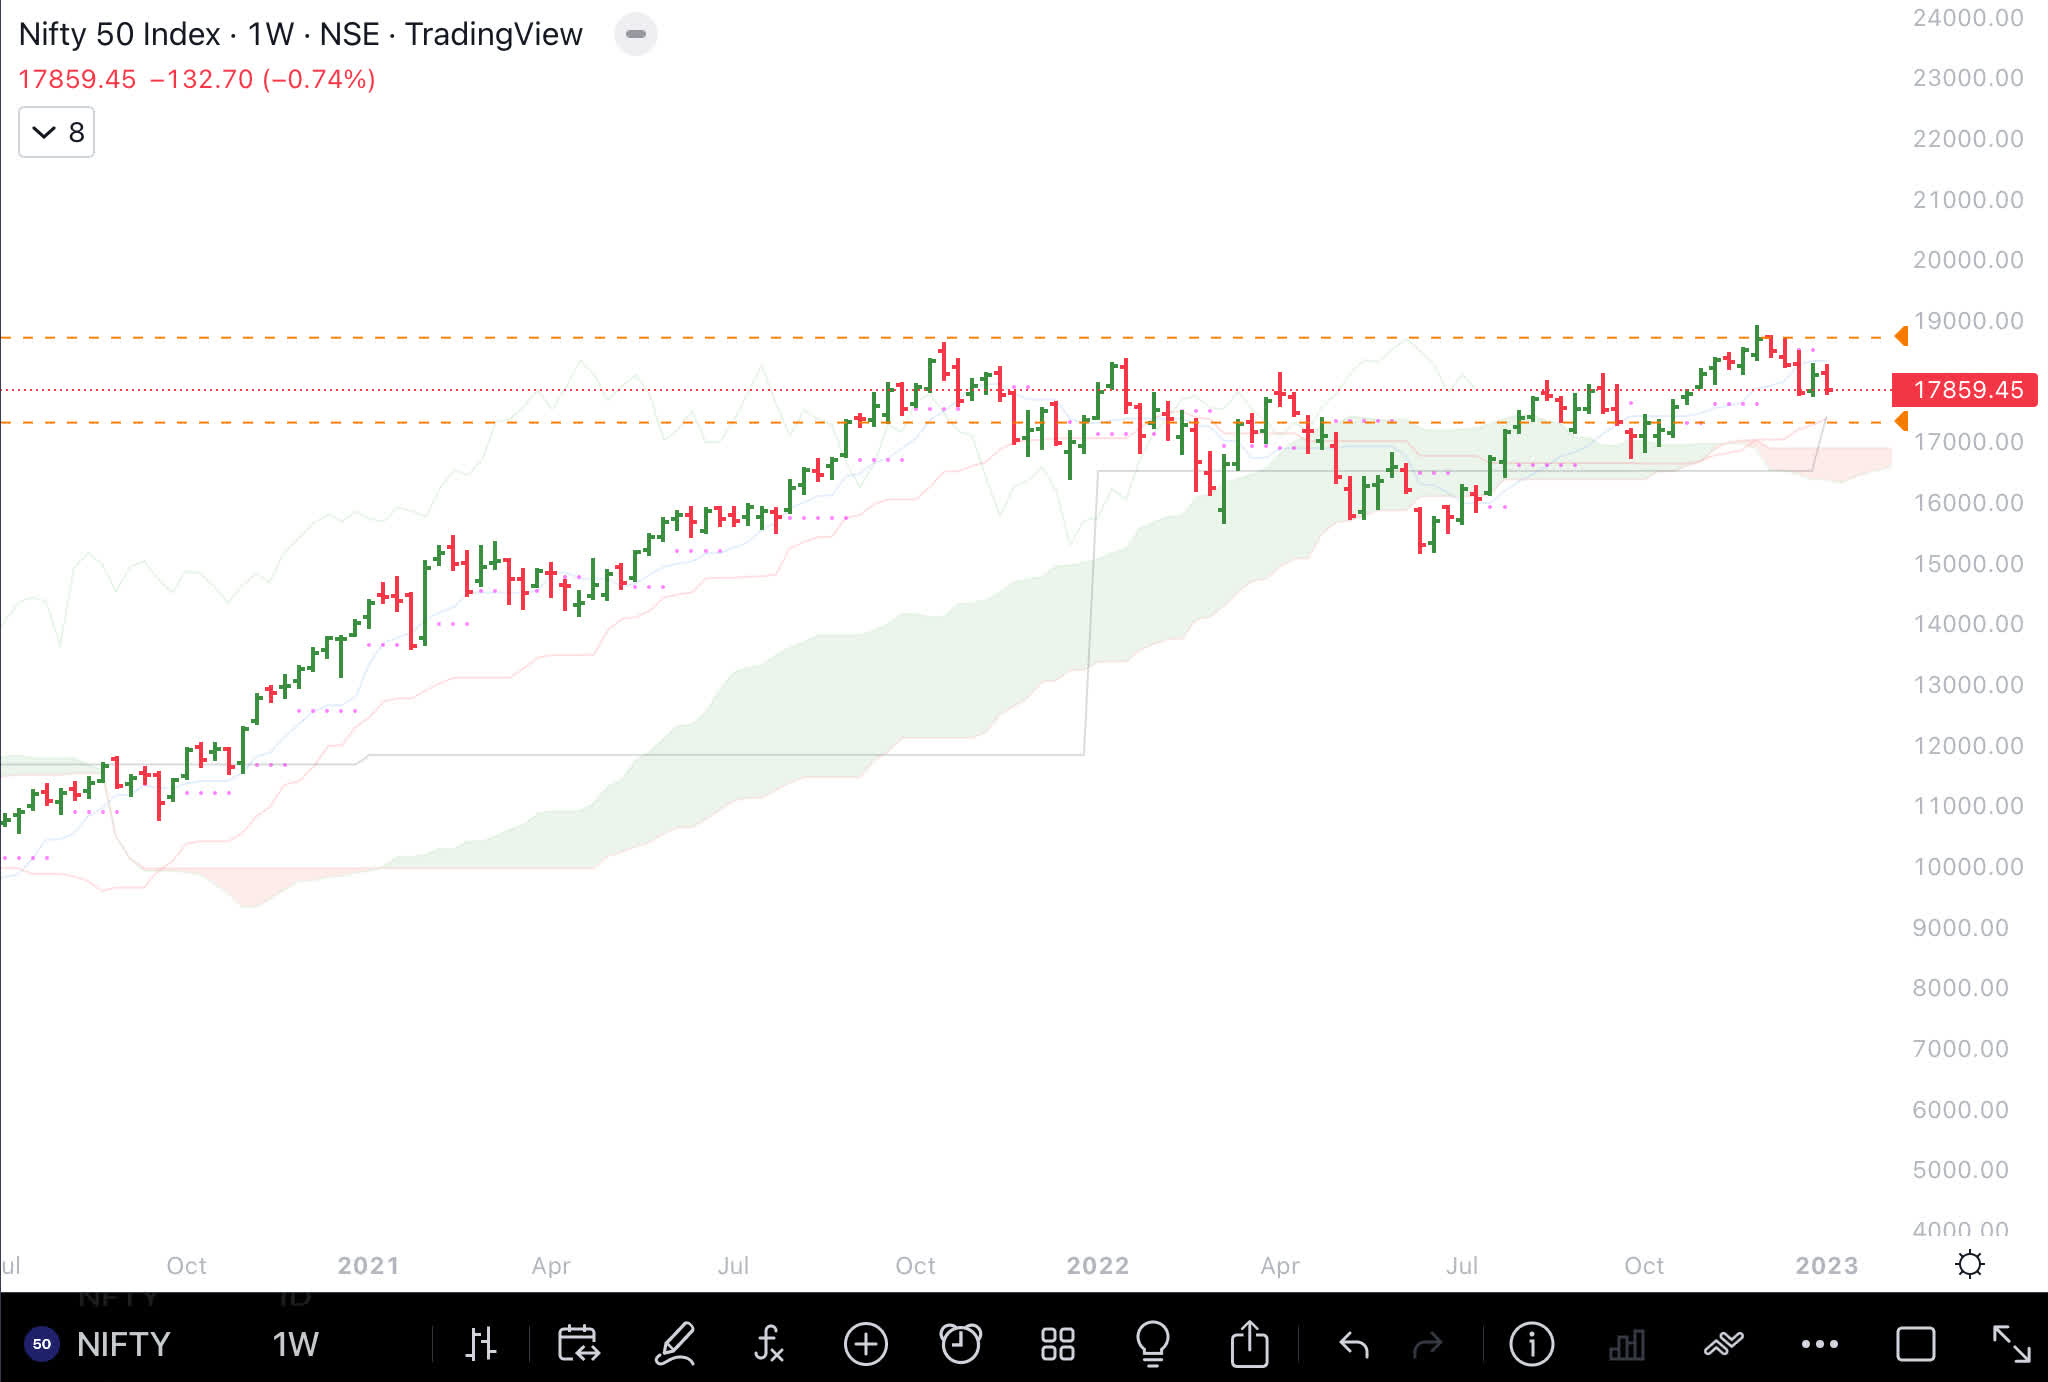
Among the international stock markets, the Indian stock market represented by the Nifty 50 Index ( NFTY ) has been on the cusp of breaking into an uptrend.
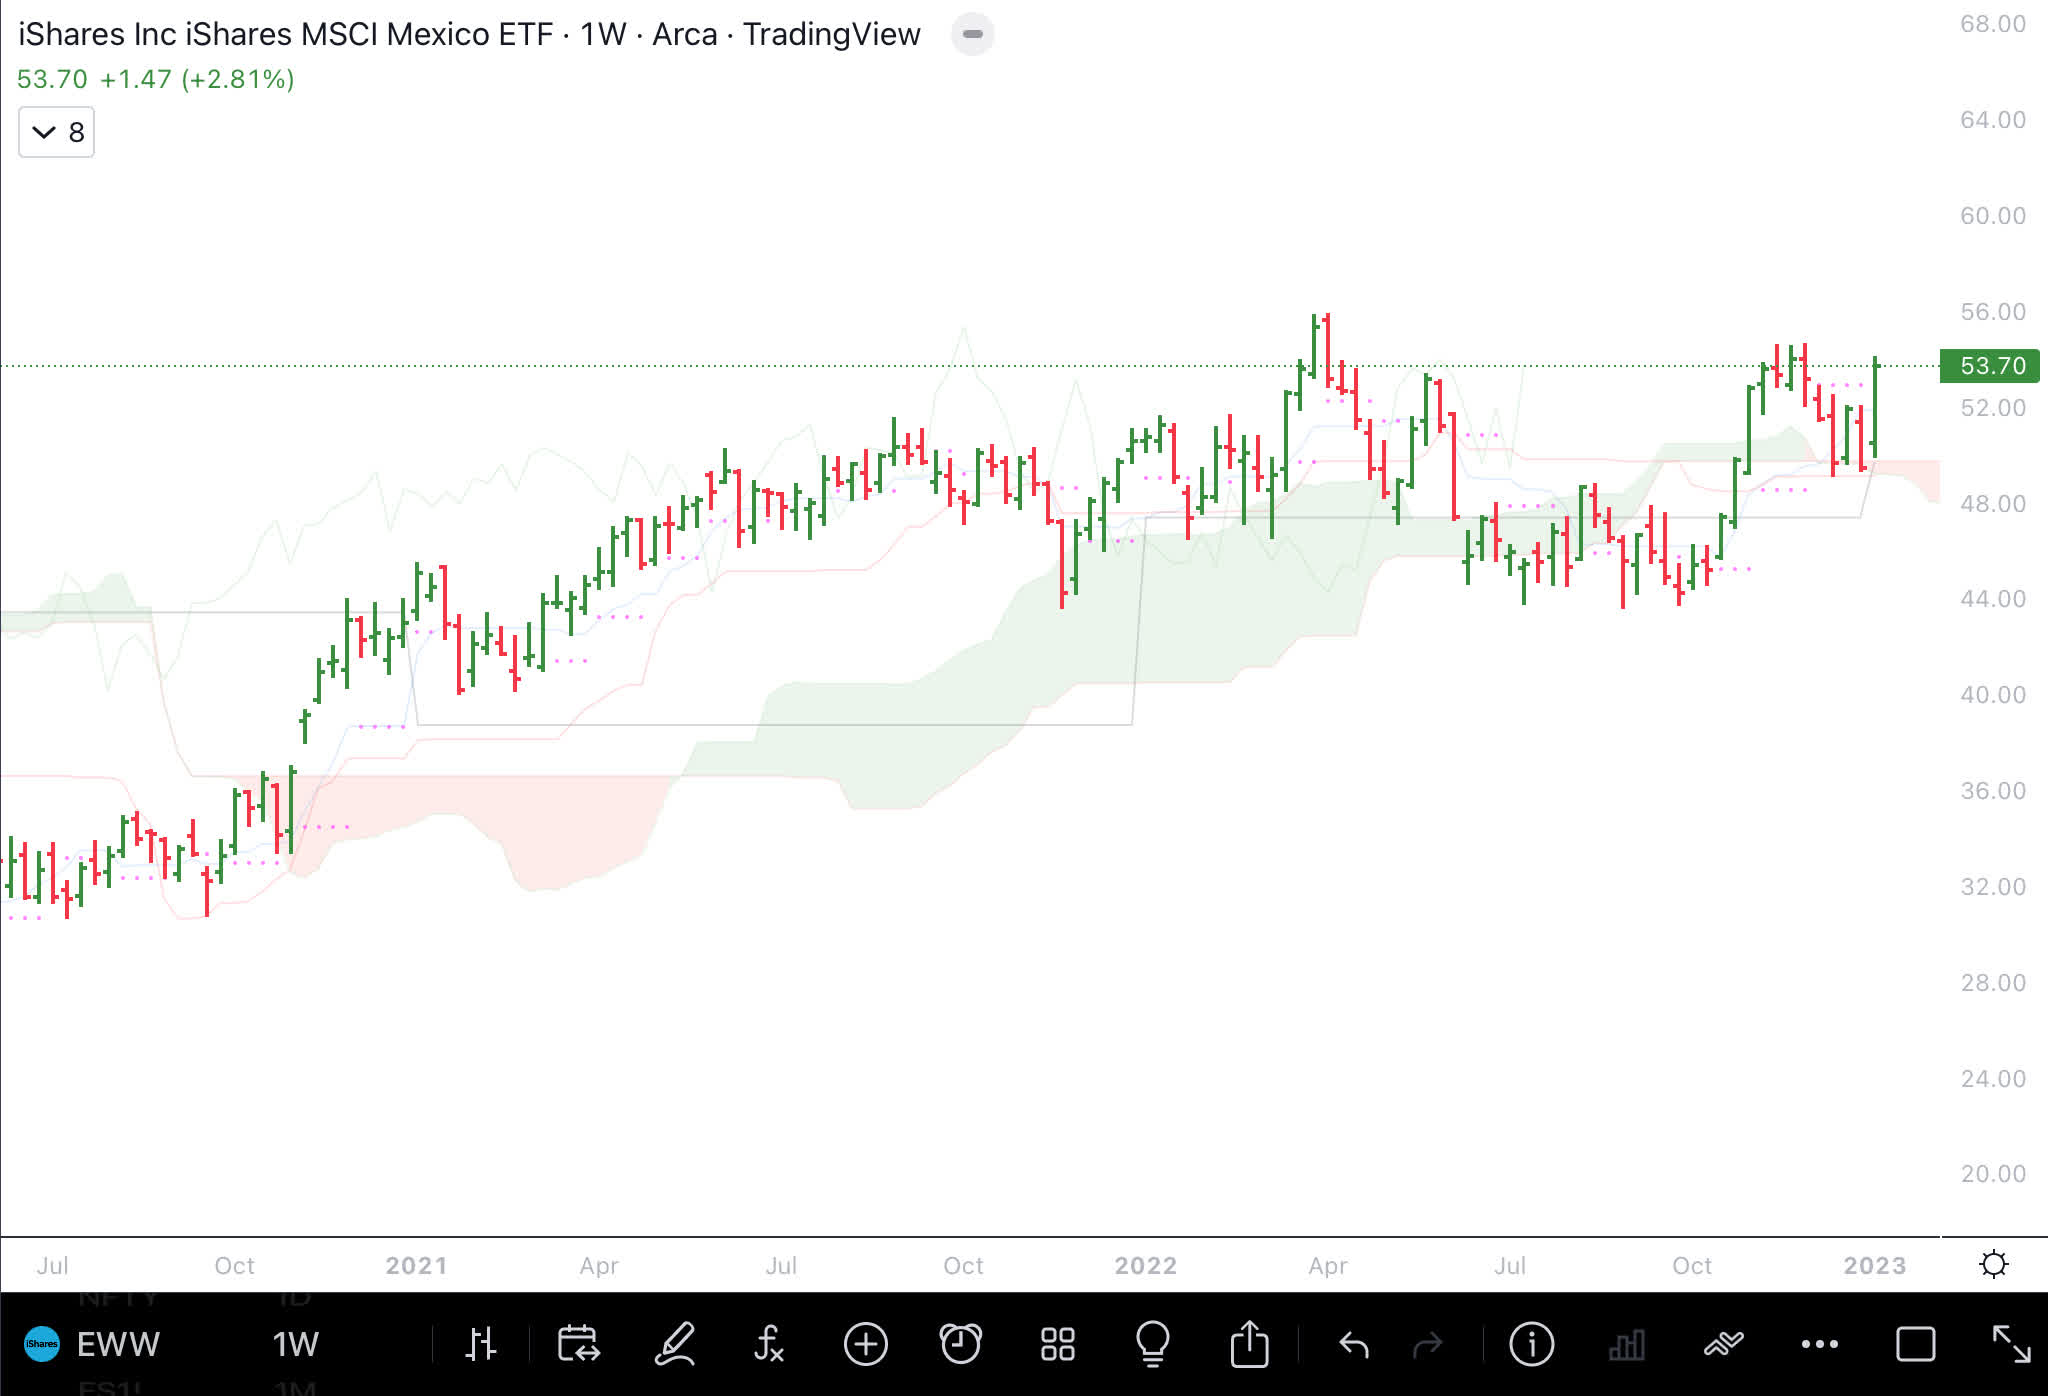
Mexico ( EWW ) is another country index where the stock market is near all-time highs.
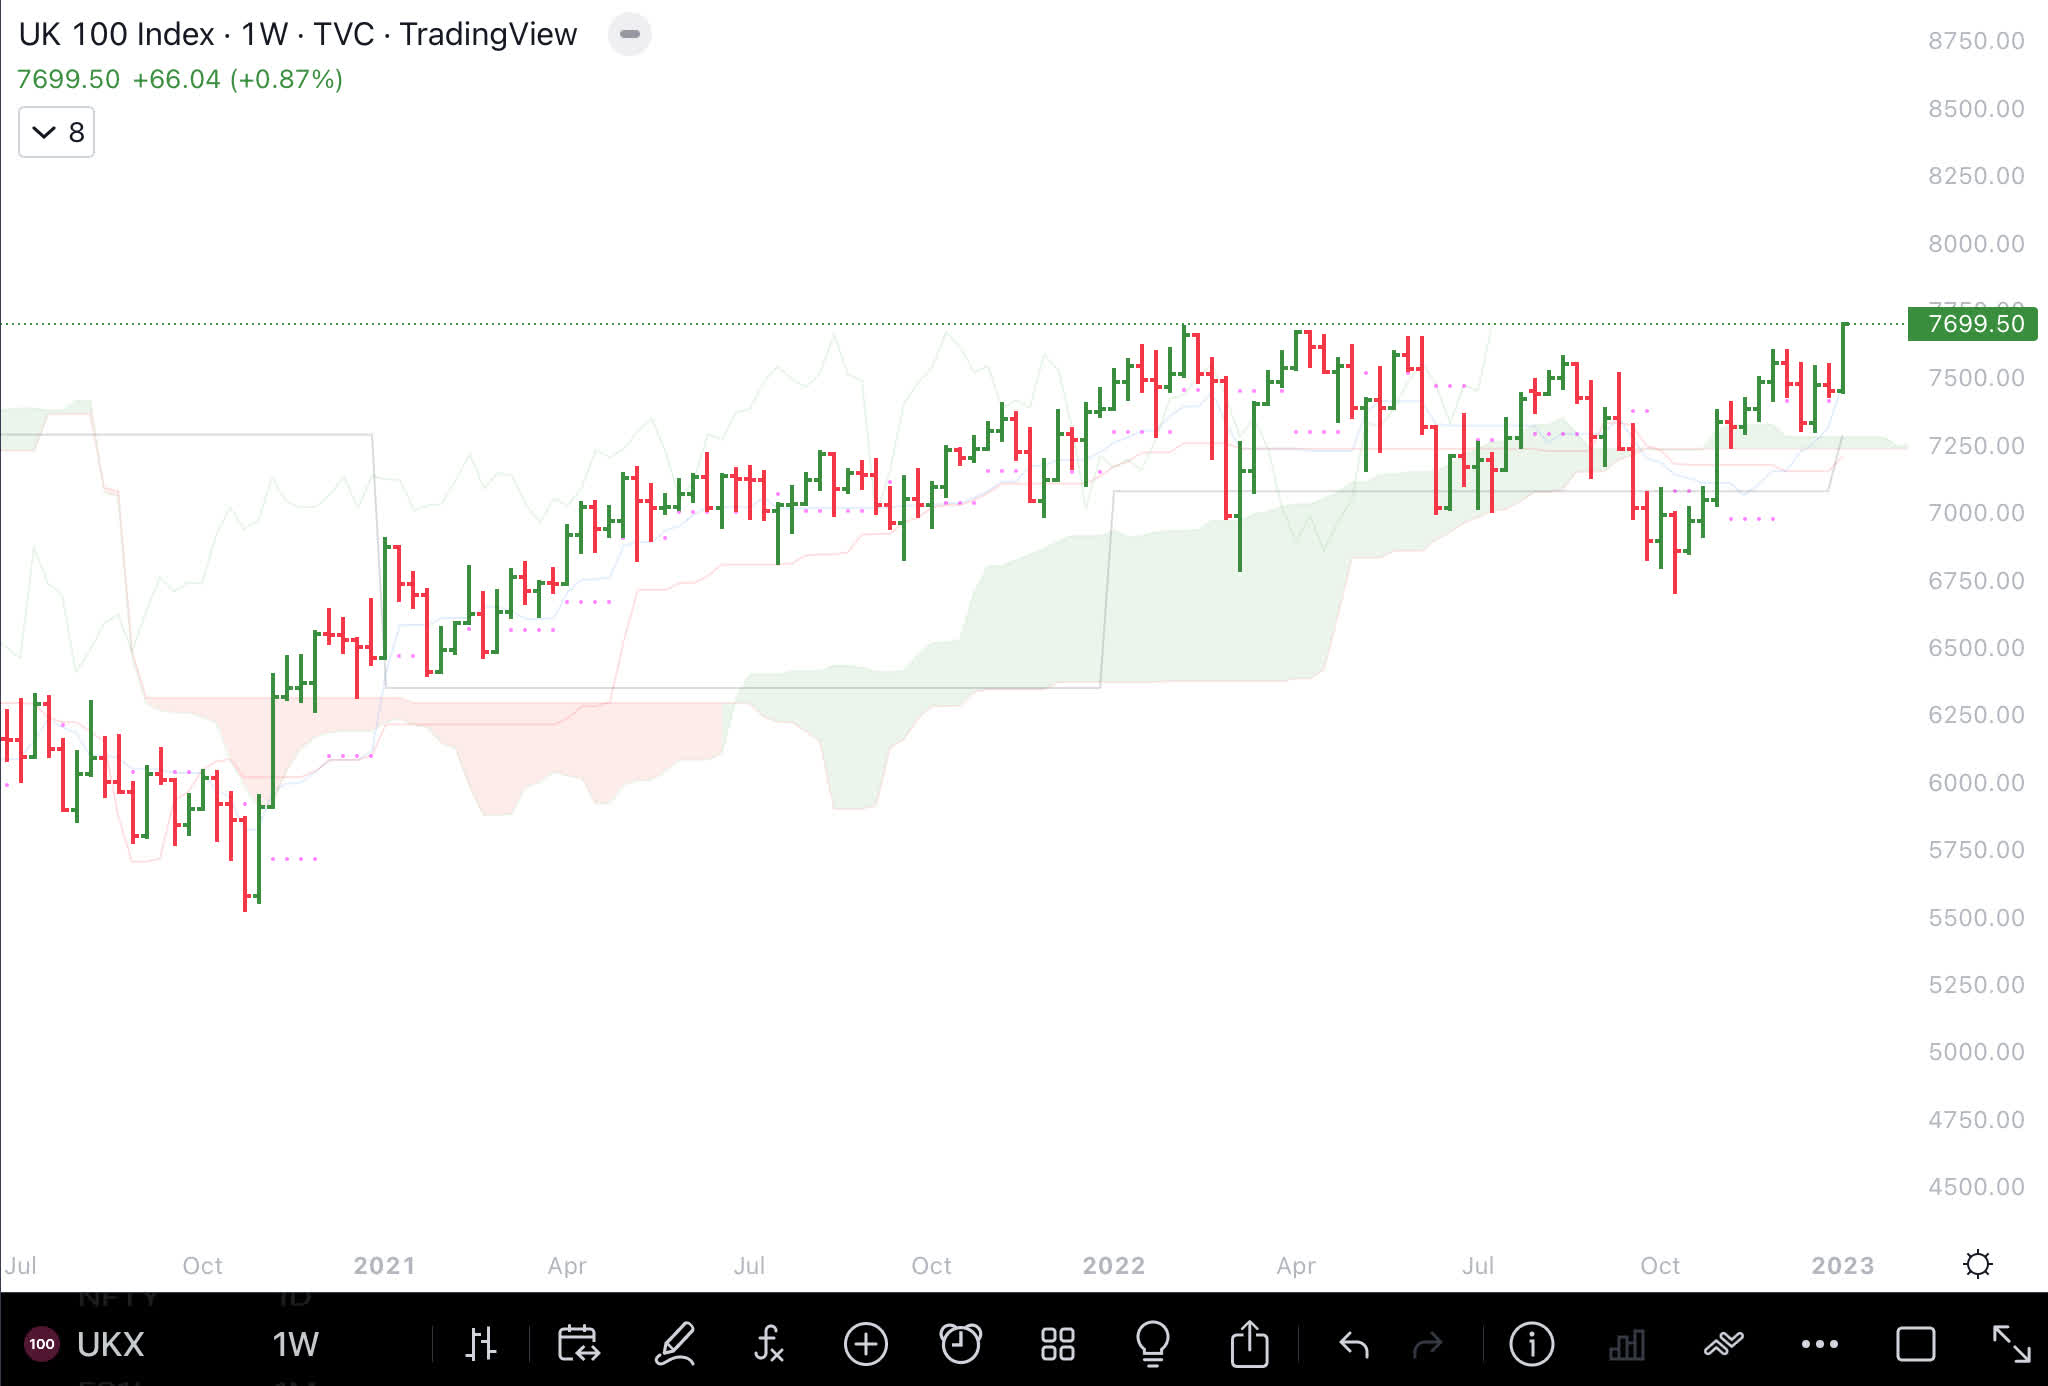
U.K. stock market index ( UKX ) is also on the cusp of an all-time high.
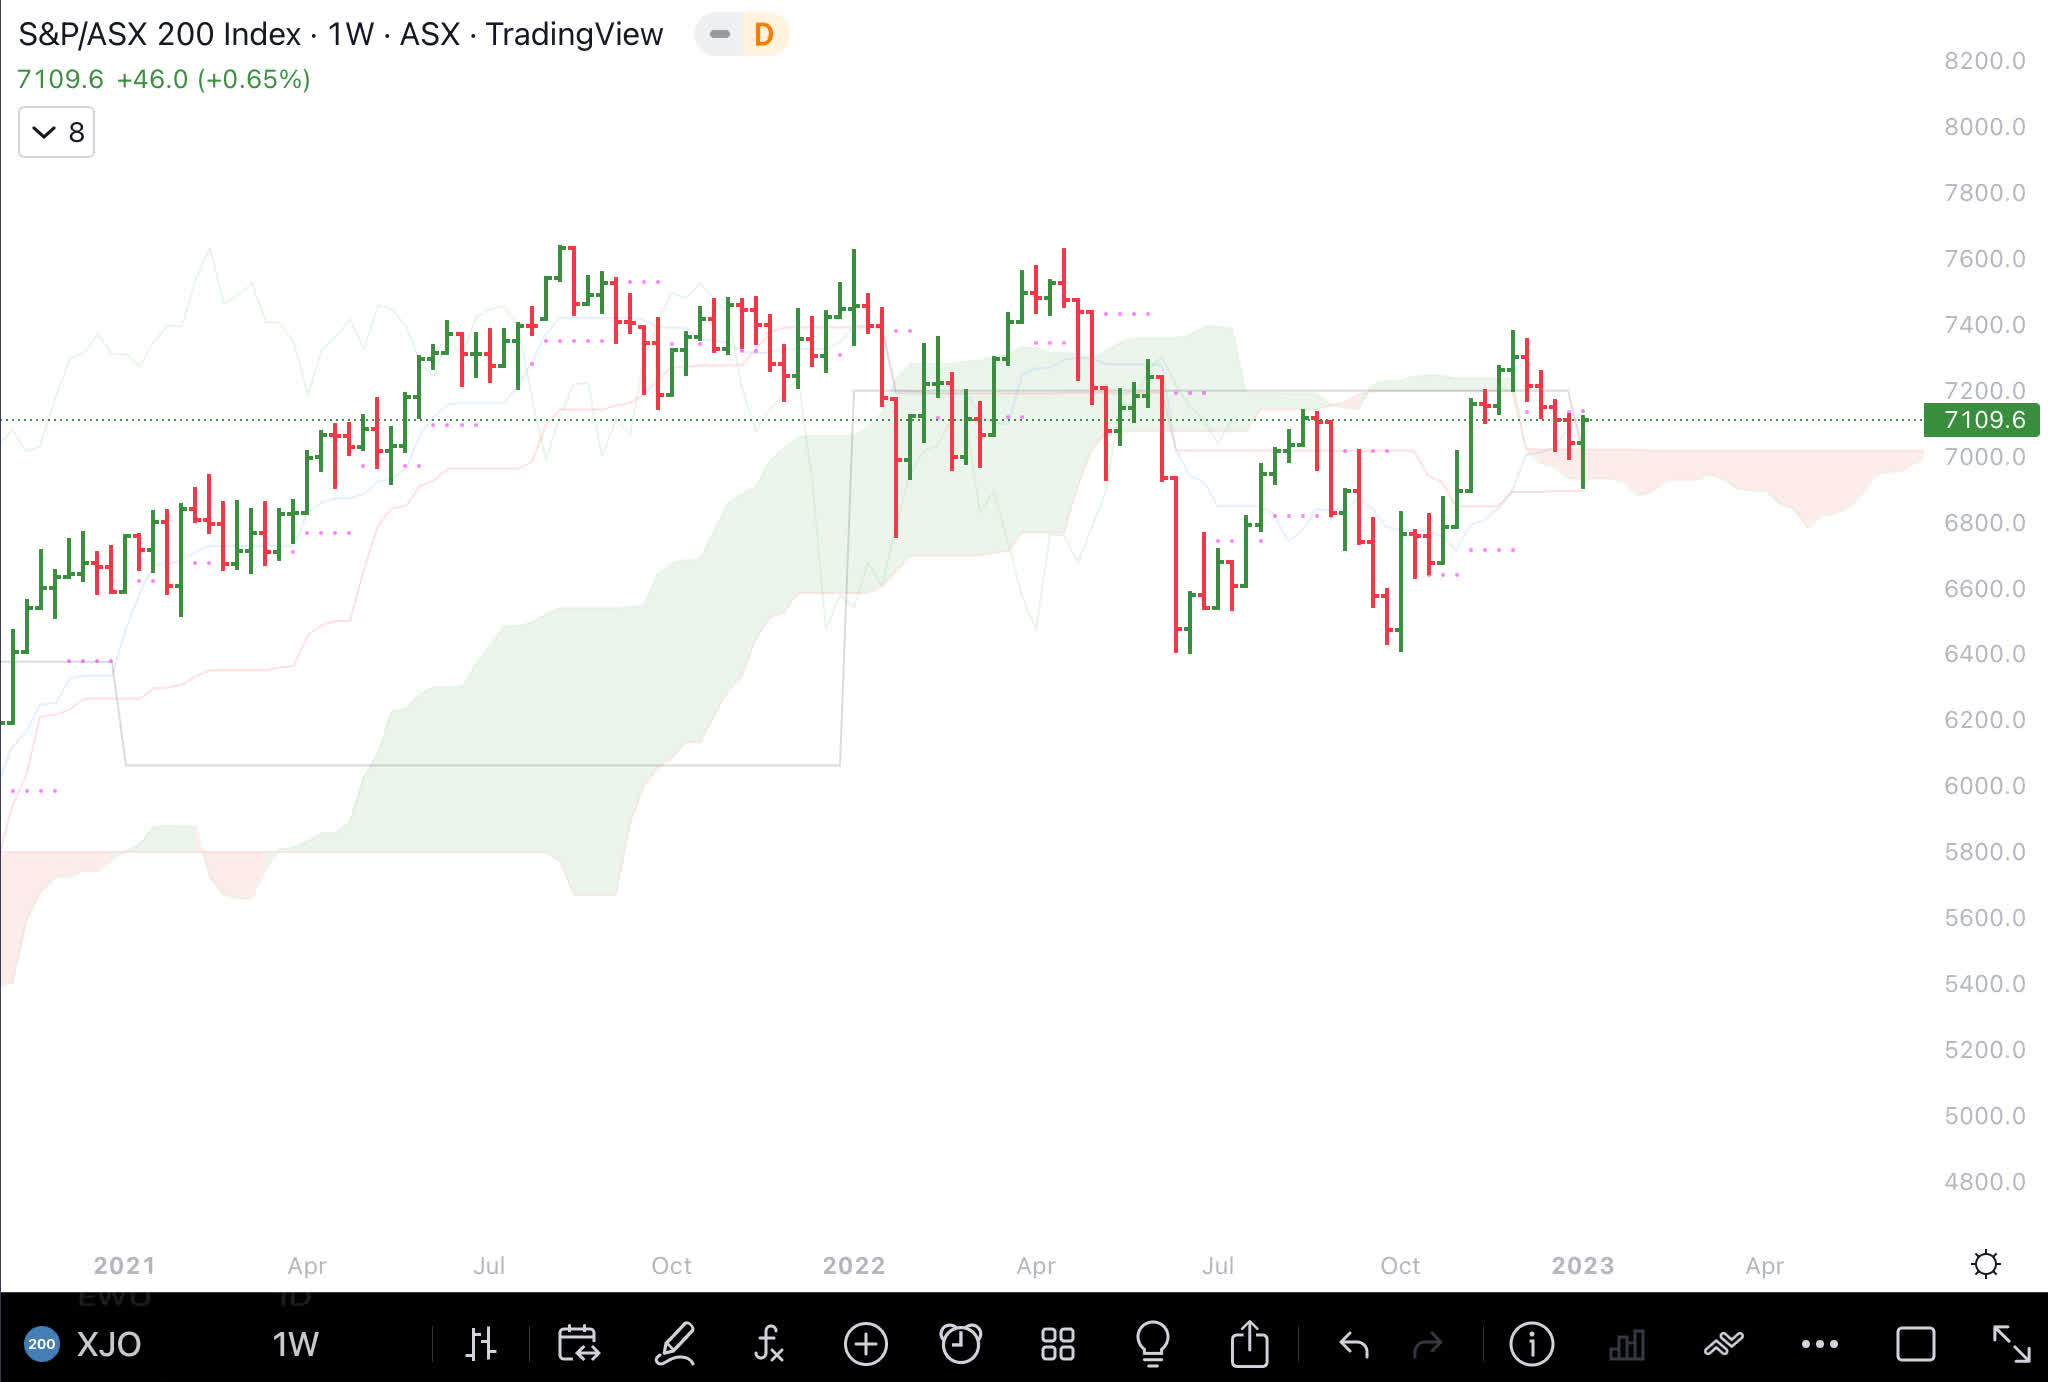
The Australian stock market index (XJO) has started an uptrend if it can stay above the Ichimoku Ashi cloud.
Australian Stock Market Chart (Author )
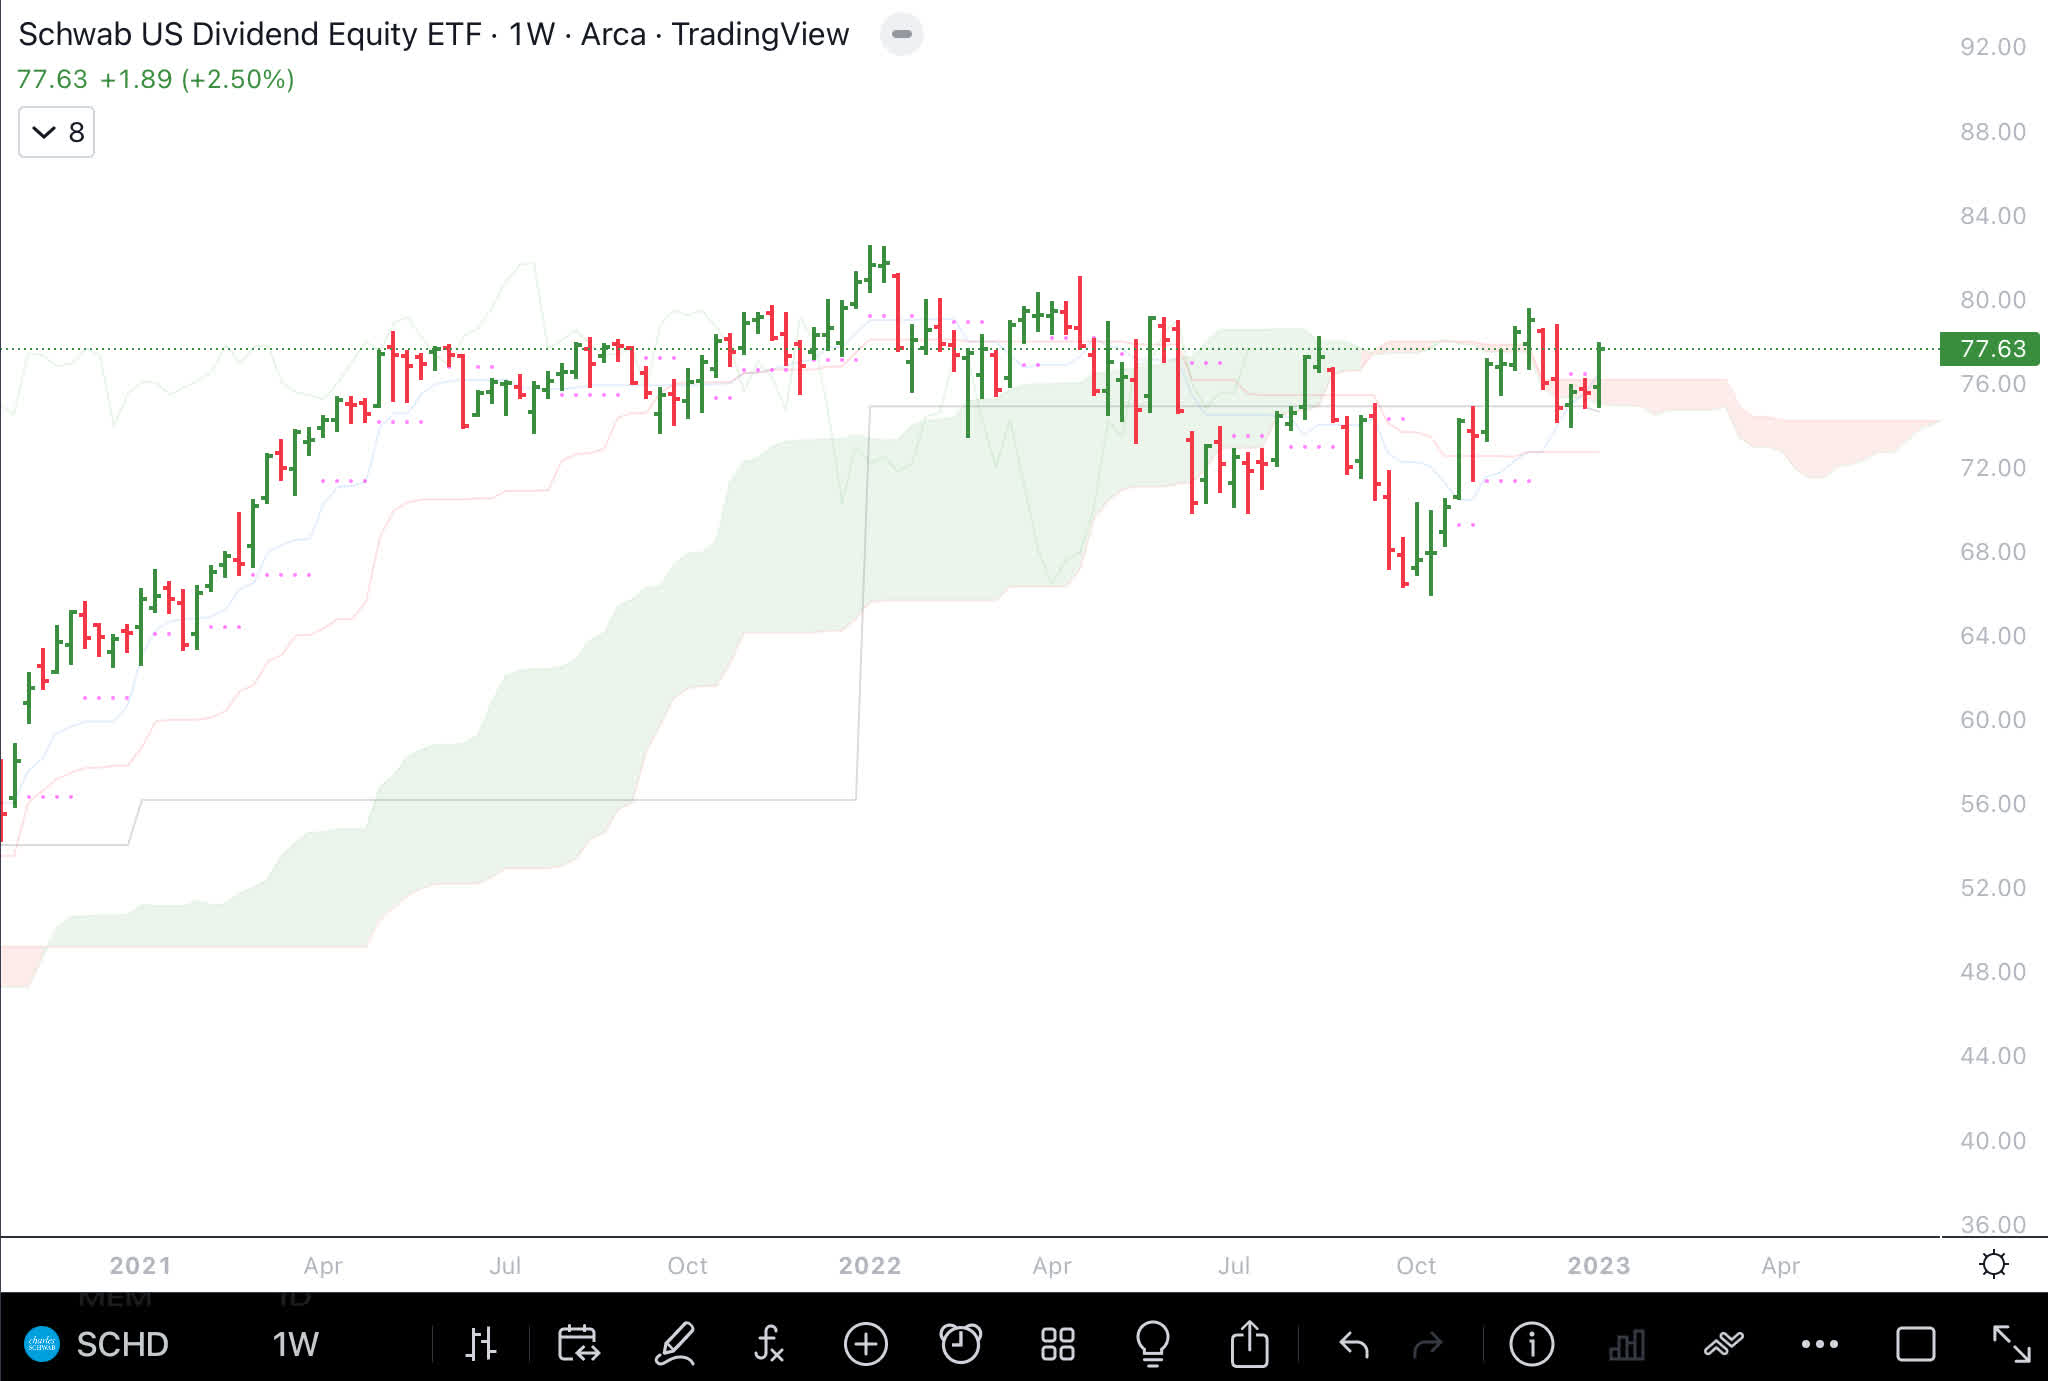
Dividend stocks as represented by Schwab U.S. Dividend Equity ETF ( SCHD ) is holding up well.
Pacer U.S. Cash Cow ETF ( COWZ ), which selects stocks based on cash flow, is also holding up.
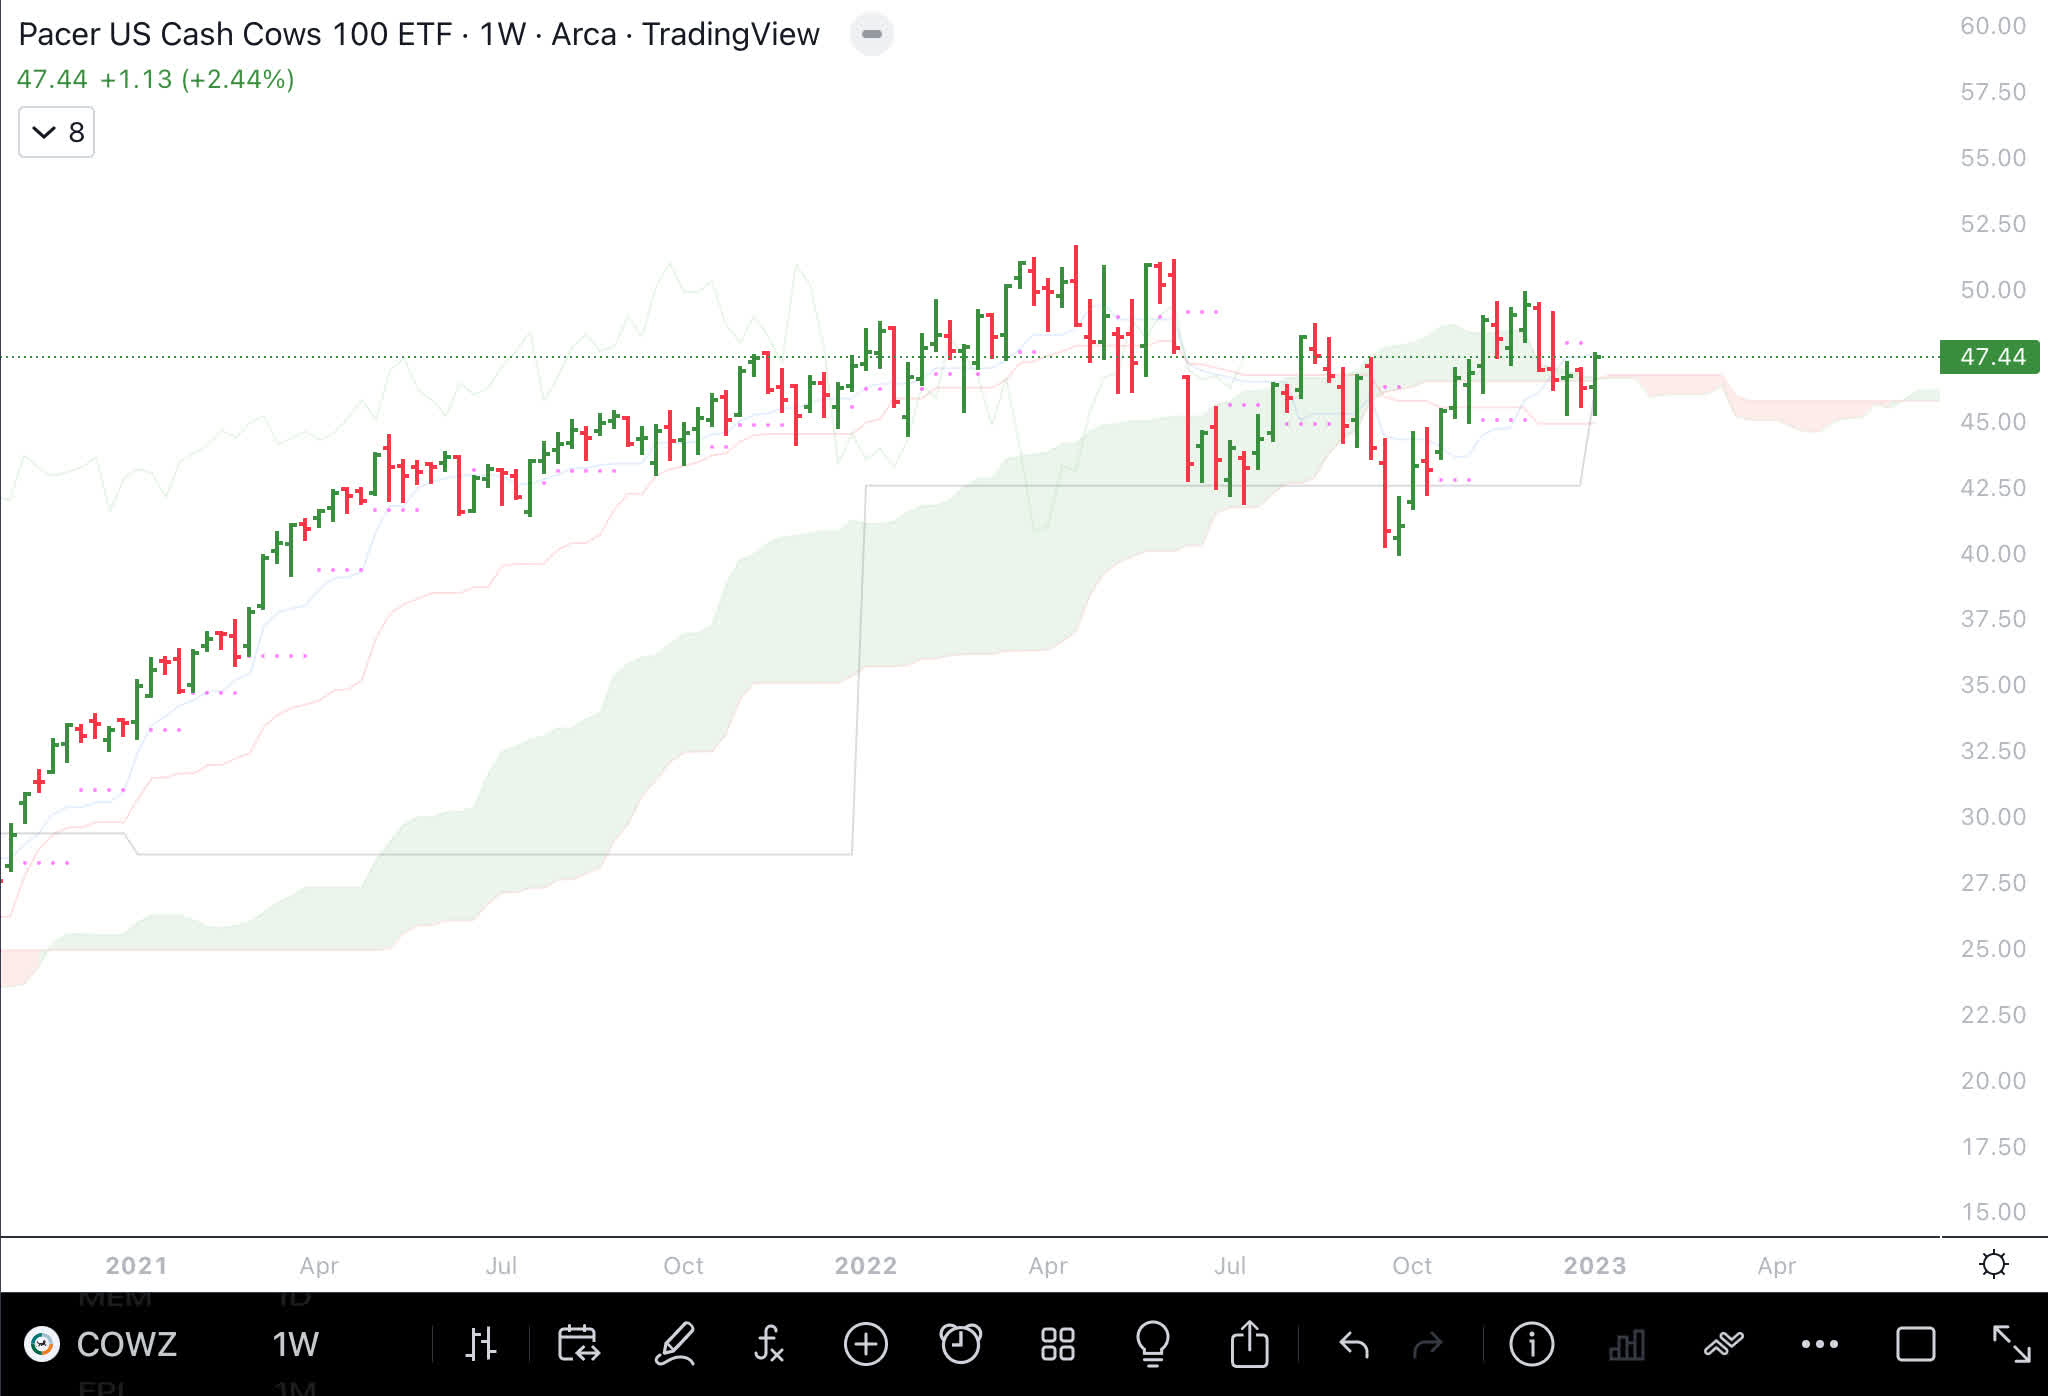
Economic Data
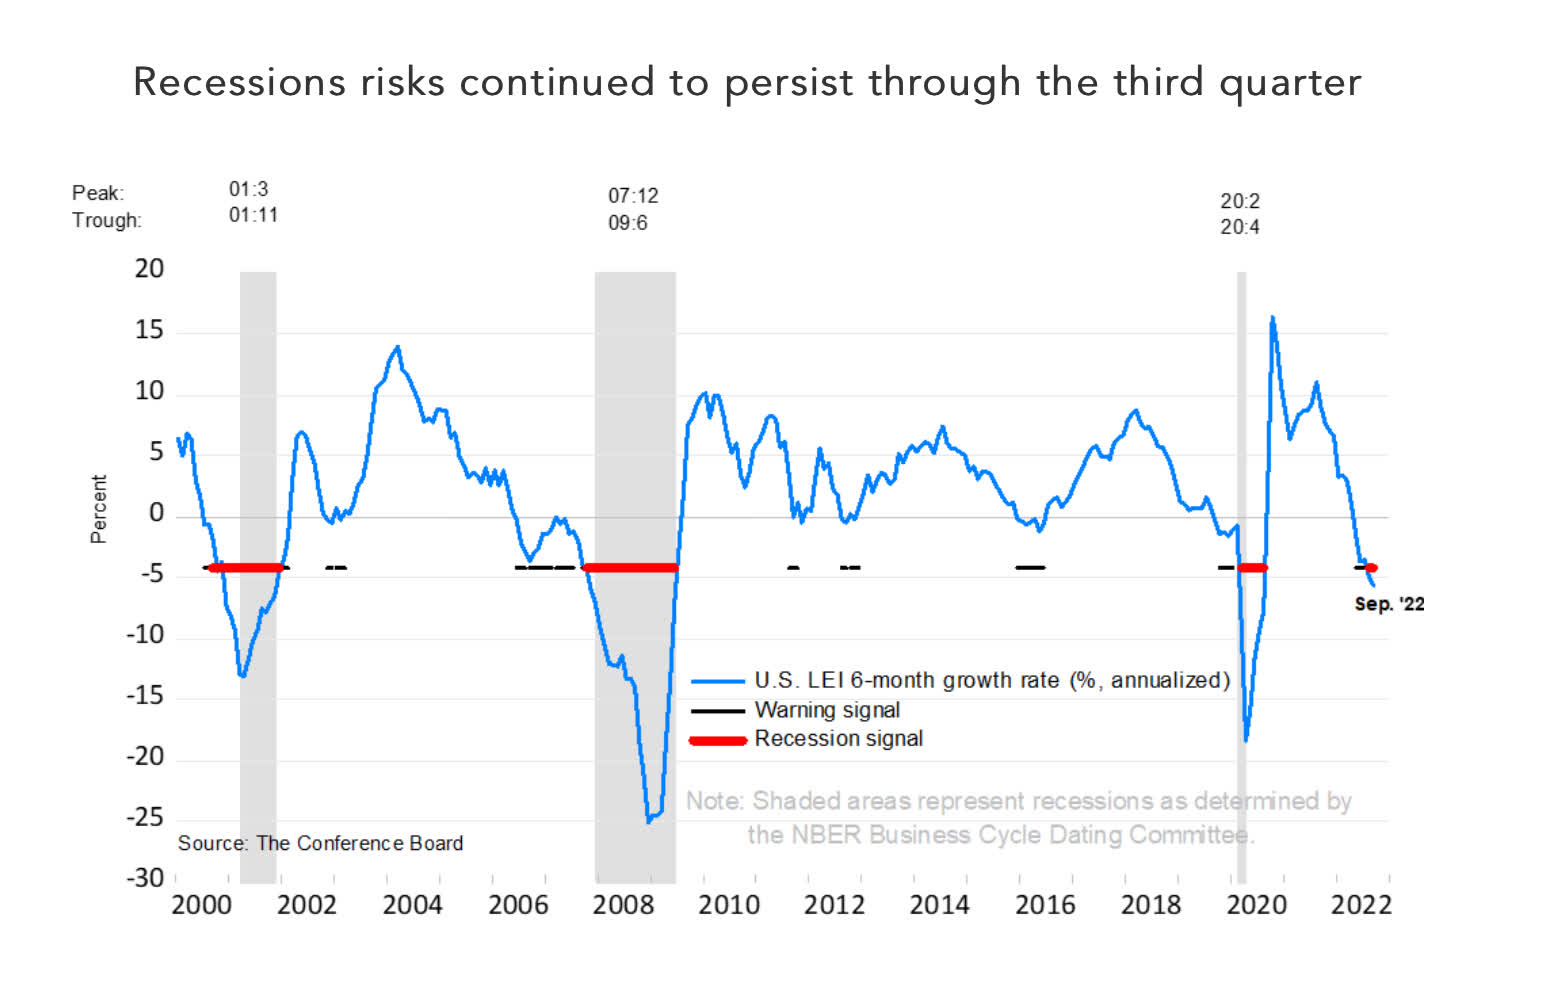
The economic data is weakening sharply, and the likelihood of a recession is increasing. The chart below by The Conference Board illustrates the growth rate of leading economic indicator ((LEI)). The growth rate has gone negative, which has signaled recession in the past.
Leading Economic Indicator (The Conference Board)
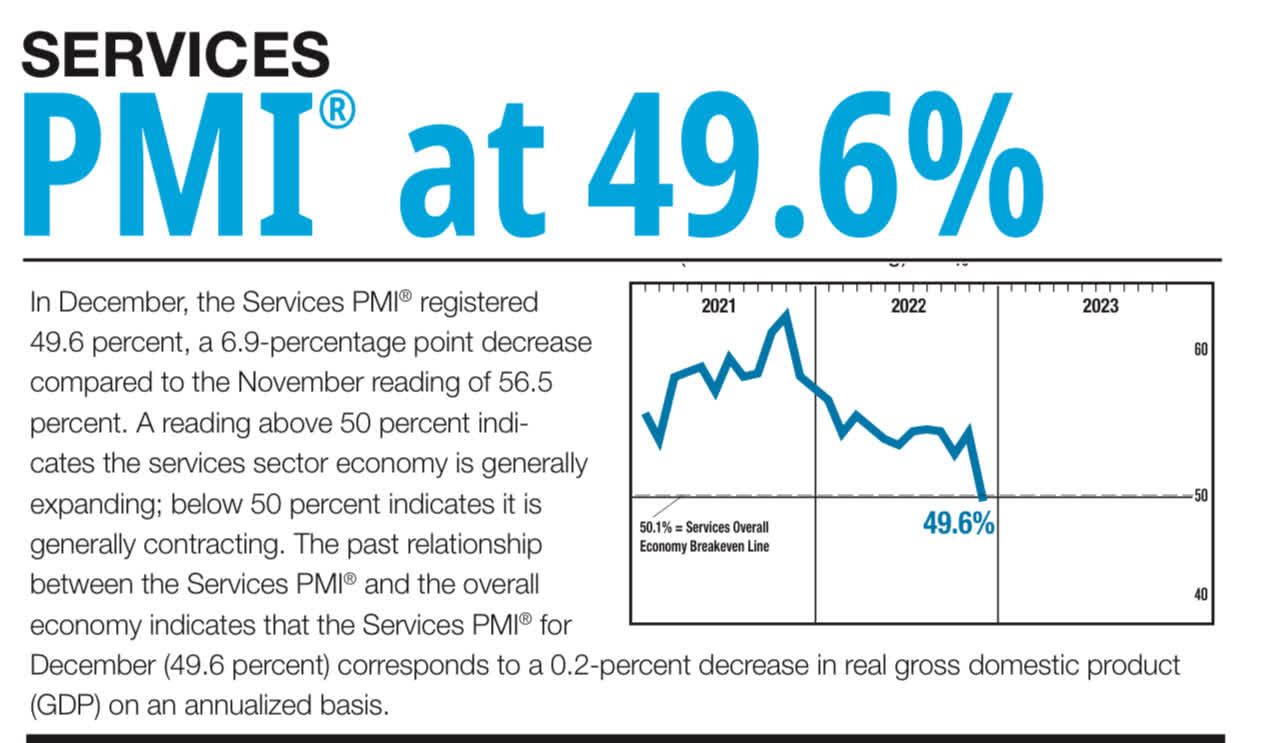
PMI for services has fallen below 50, which demarcates expansion from contraction and shows slowdown in the economy.
PMI Services Index (ISM Report)
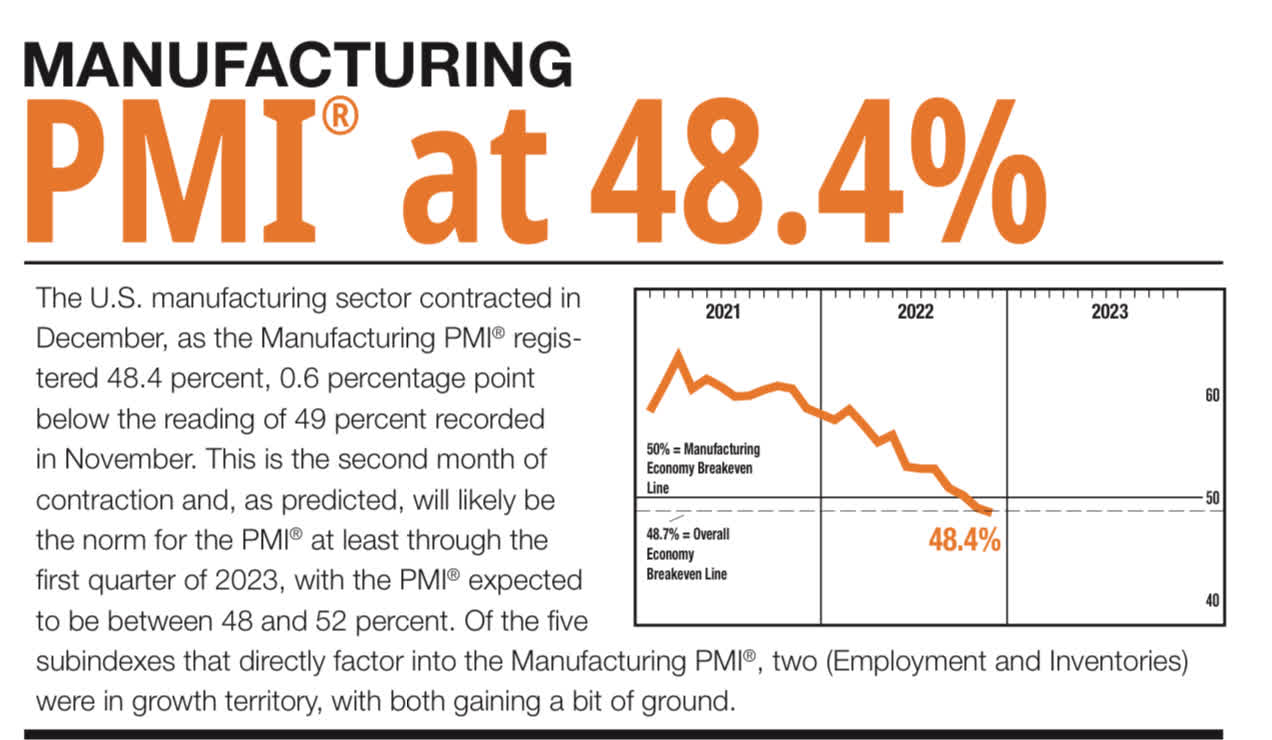
The manufacturing PMI is below 50 for two consecutive months.
PMI Manufacturing Index (ISM Report)
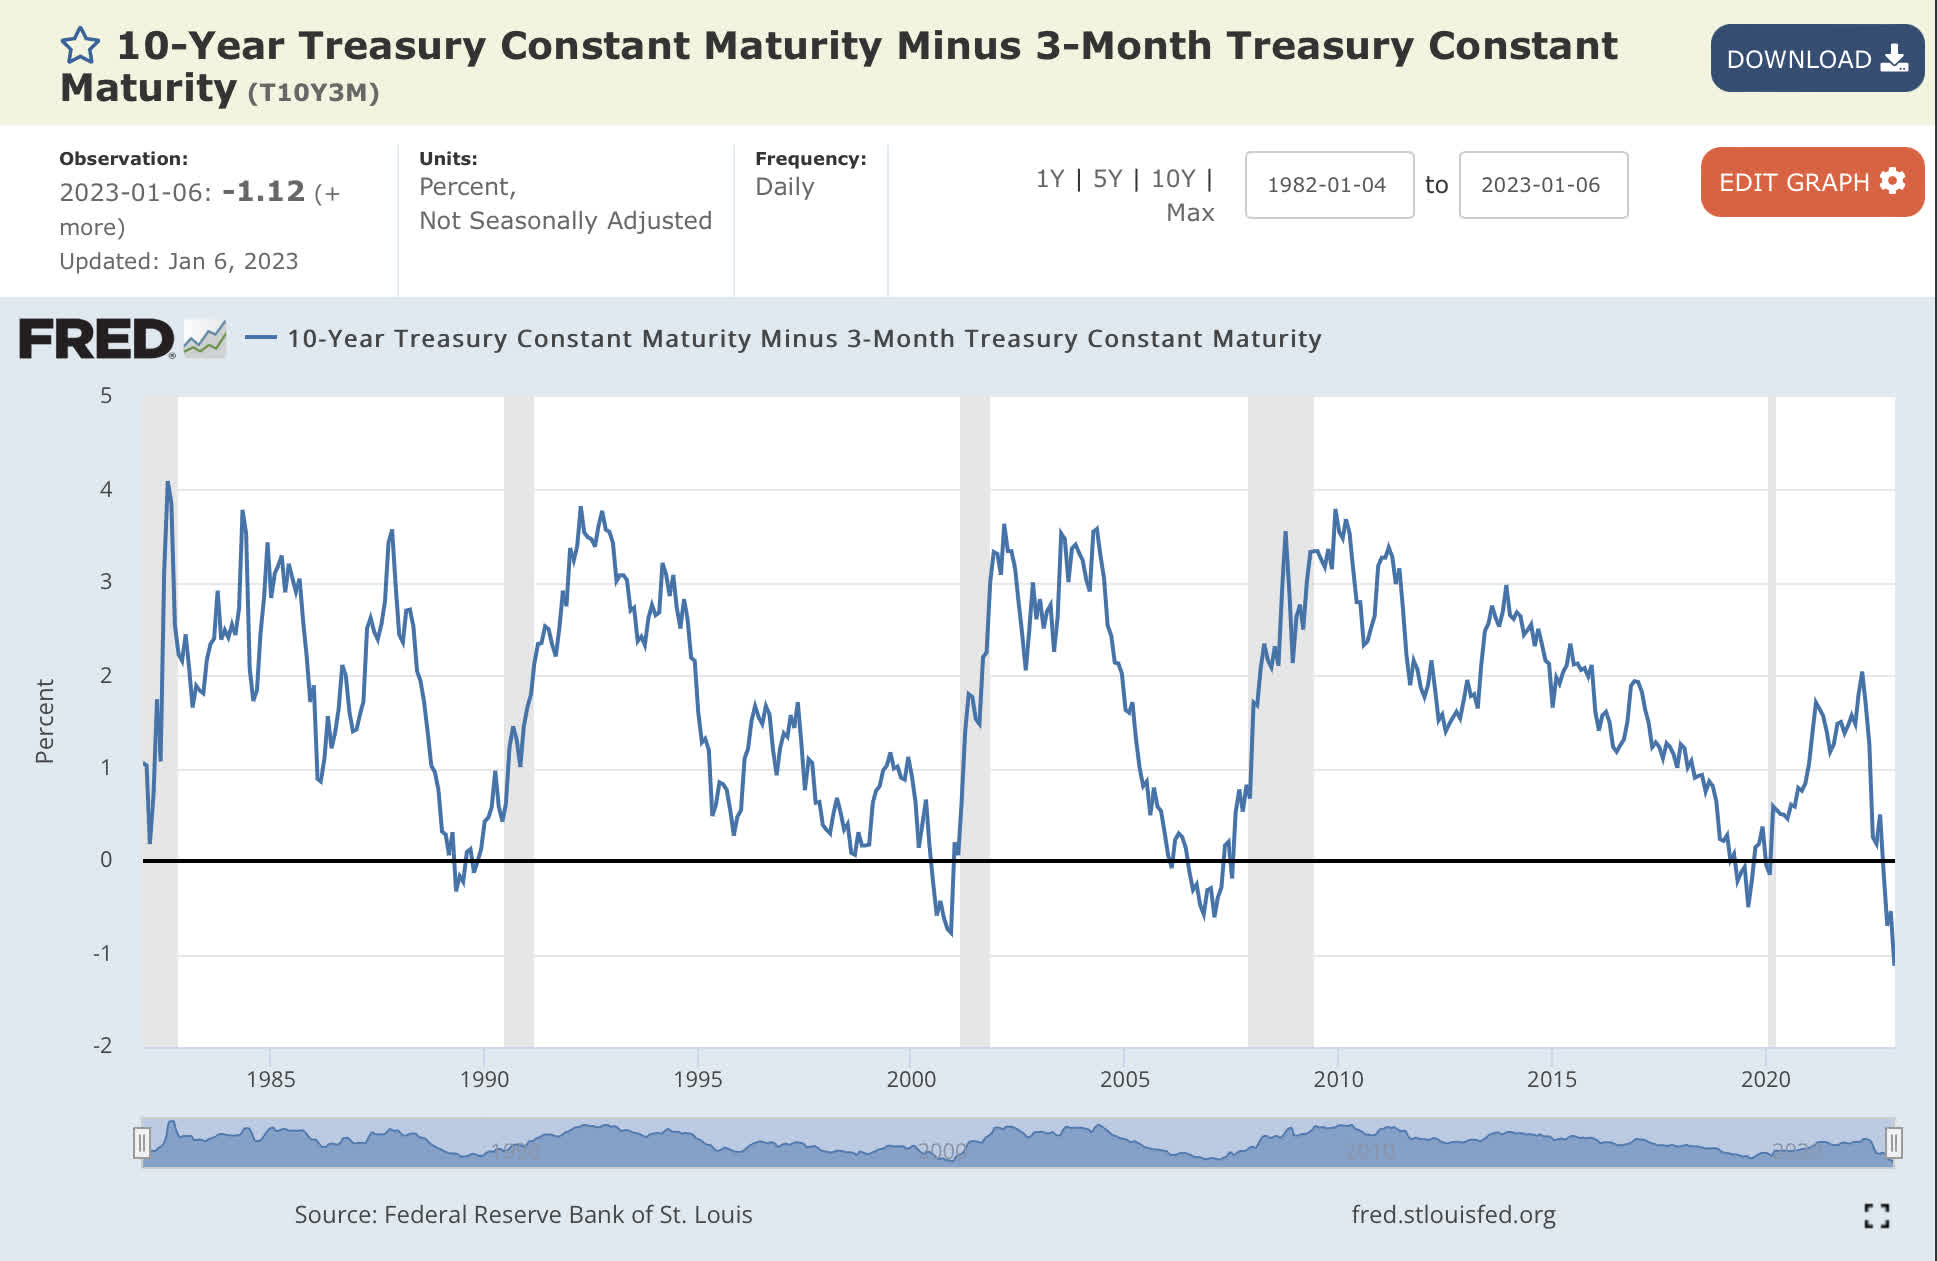
The 10 year minus 3 month is deeply negative and another reason to expect an economic slowdown if not a recession.
Inversion of 10 year minus 3 month (St Louis Federal Reserve )
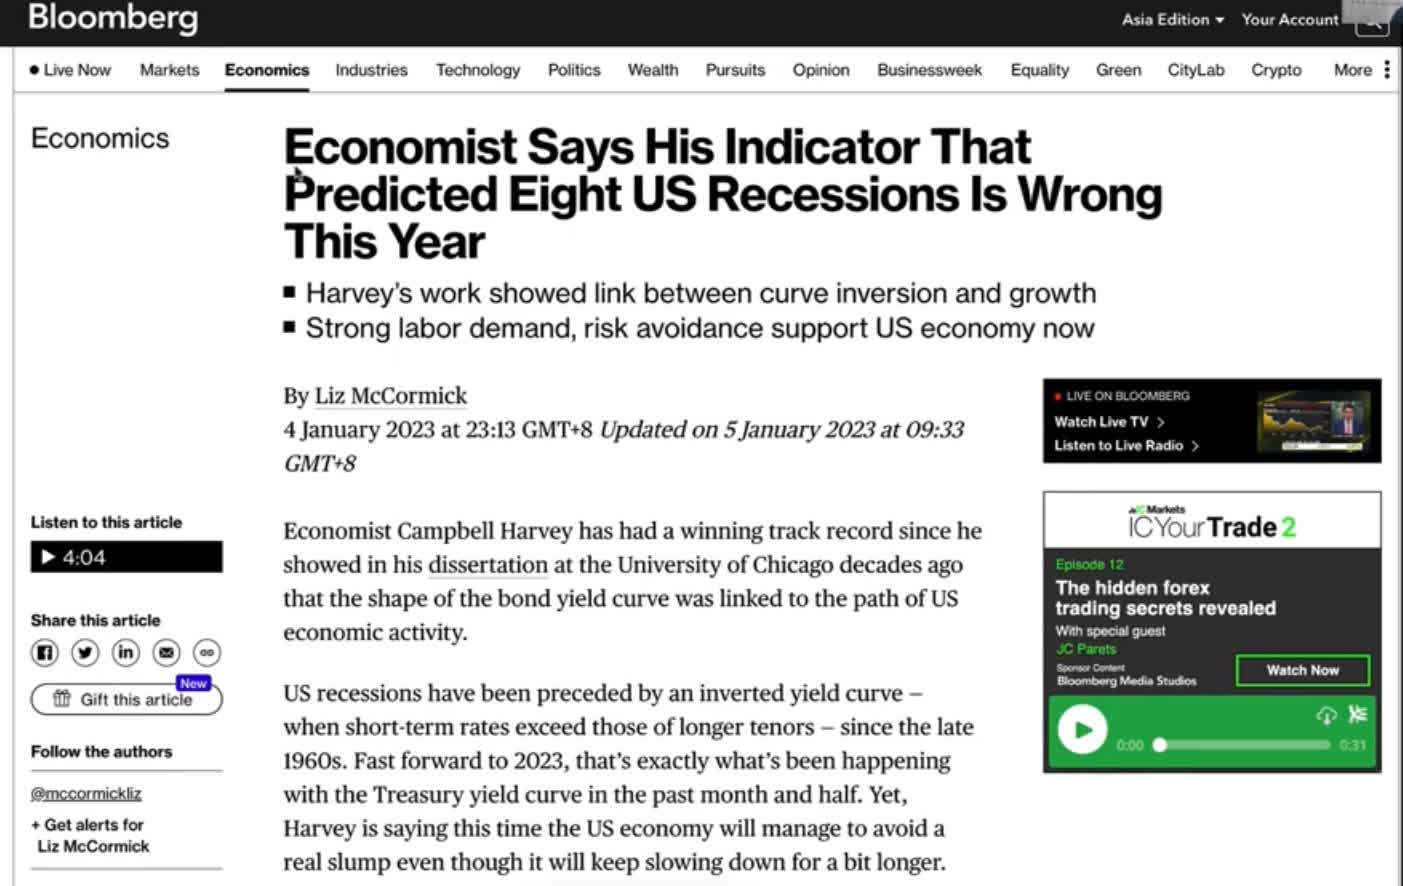
However, economist Campbell Harvey who wrote the thesis on using 10 year minus 3 month as a leading indicator for recession says that this indicator is not predicting a recession. In the following charts, we will look at reasons for his argument that the inversion is not indicating a recession.
Economist Harvey on inversion (Bloomberg )
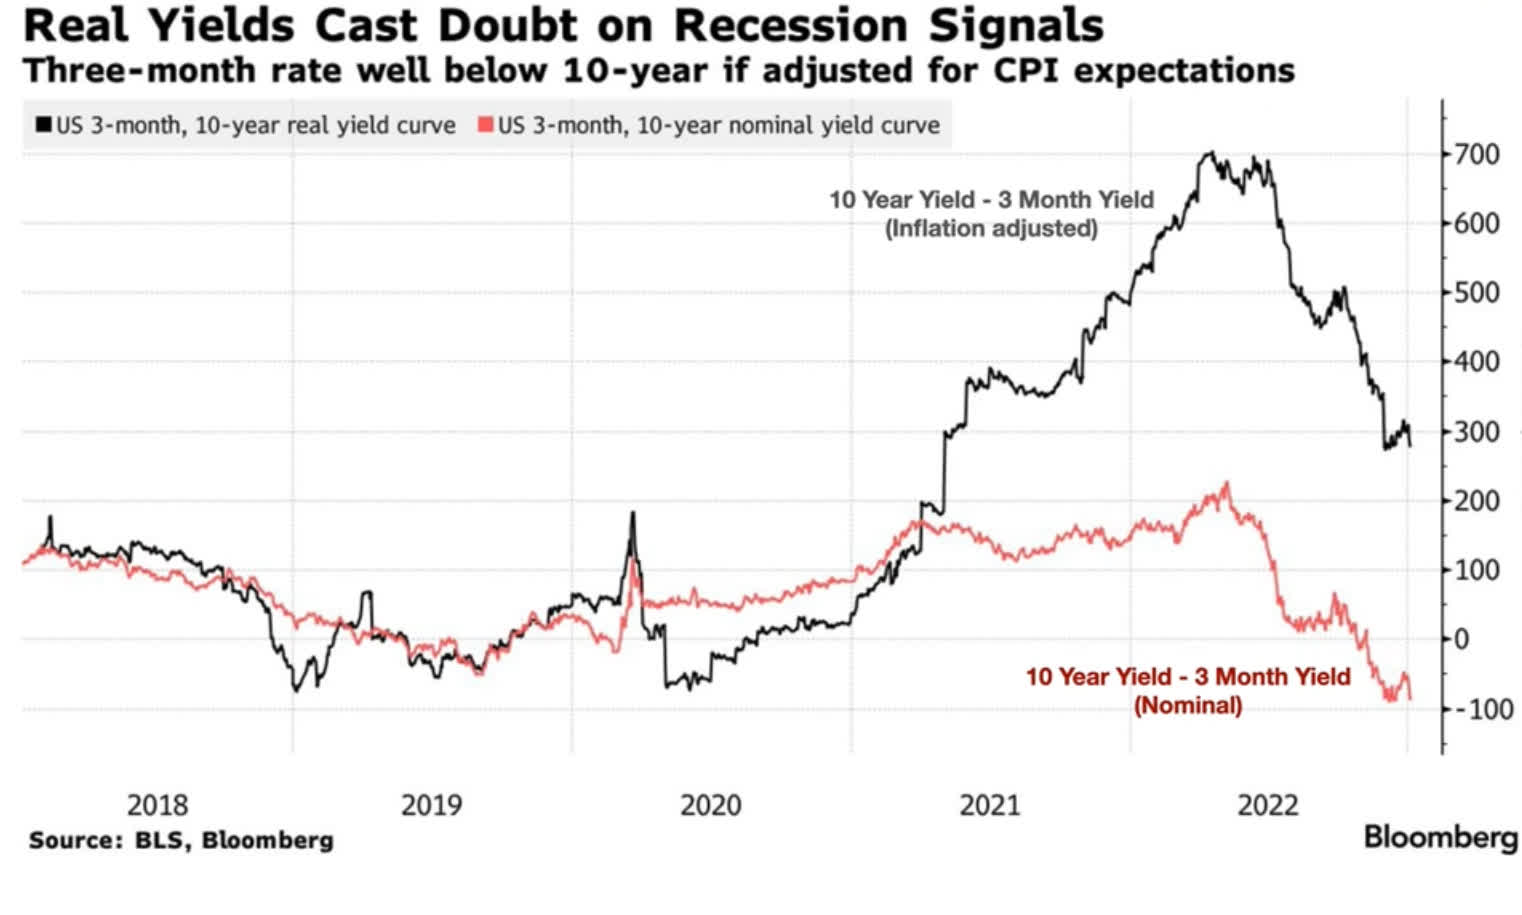
The first reason is the nominal 10 year minus 3 month is negative but real yields (adjusted for CPI) are not negative.
Real Yield 10 year and 3 month (Bloomberg )
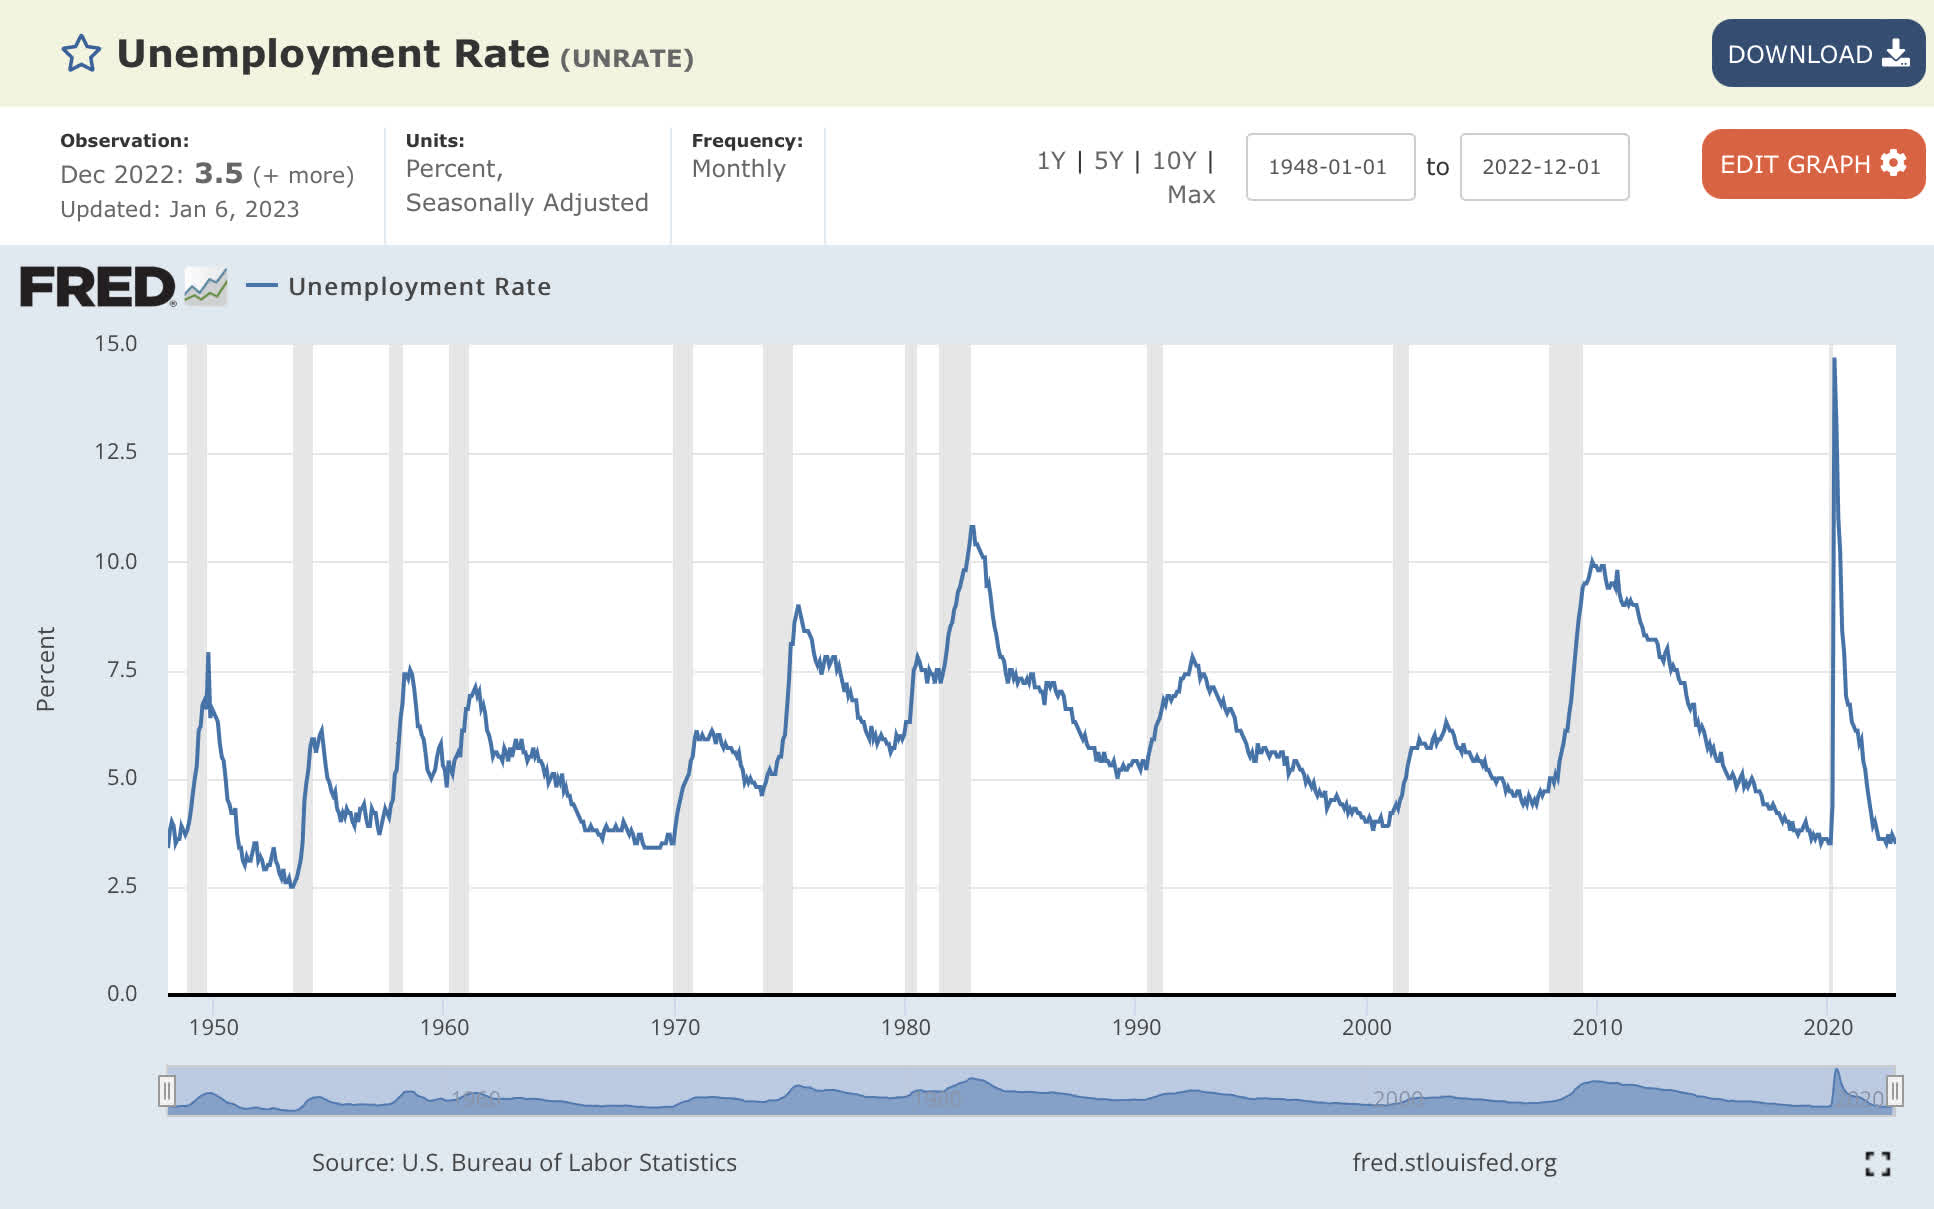
The other reason that the U.S. economy is not going to go into a recession is the unemployment rate, which is around 3.5%.
Unemployment Rate (St Louis Federal Reserve )
Valuation
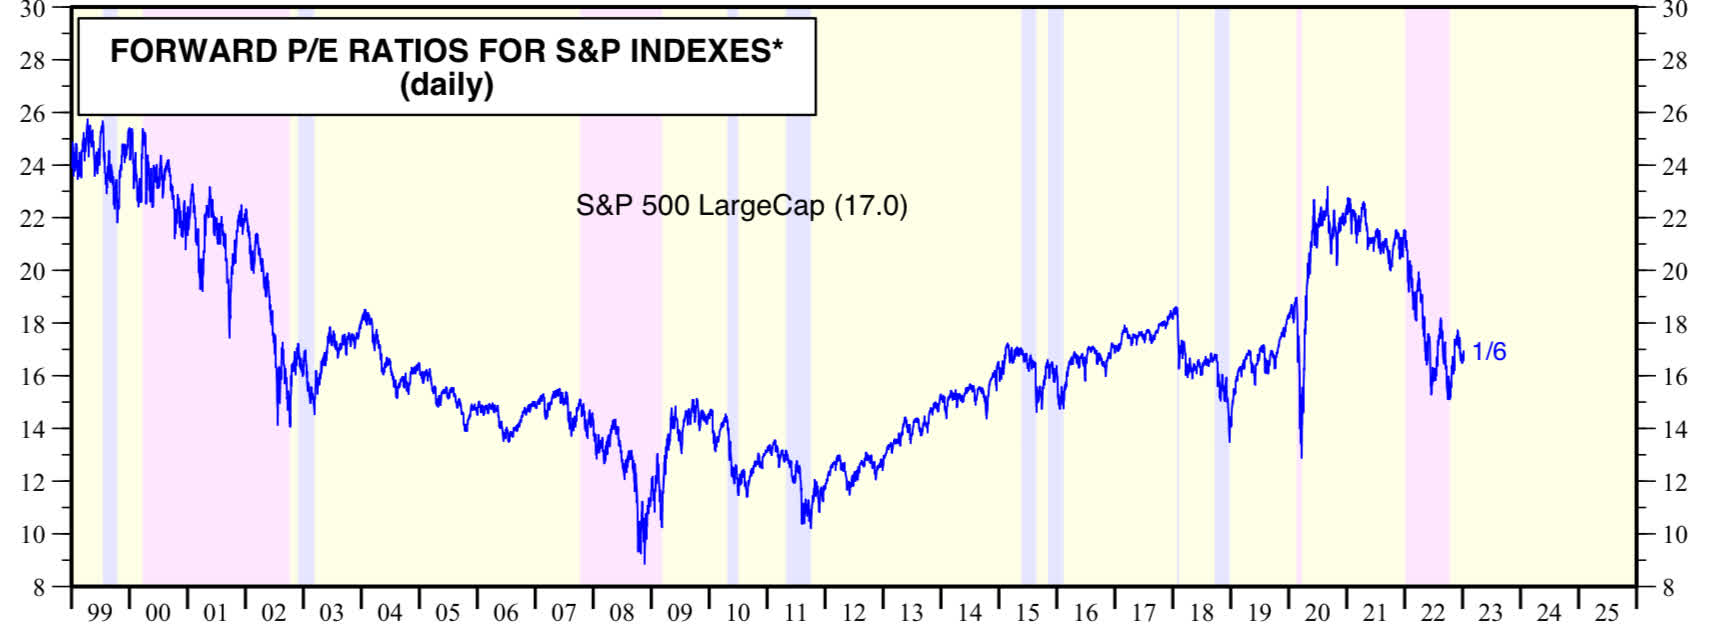
Large cap valuation as measured by price to earnings remains high, though it has come down from 23X to 17X.
S&P 500 Valuation (Yardeni Research )
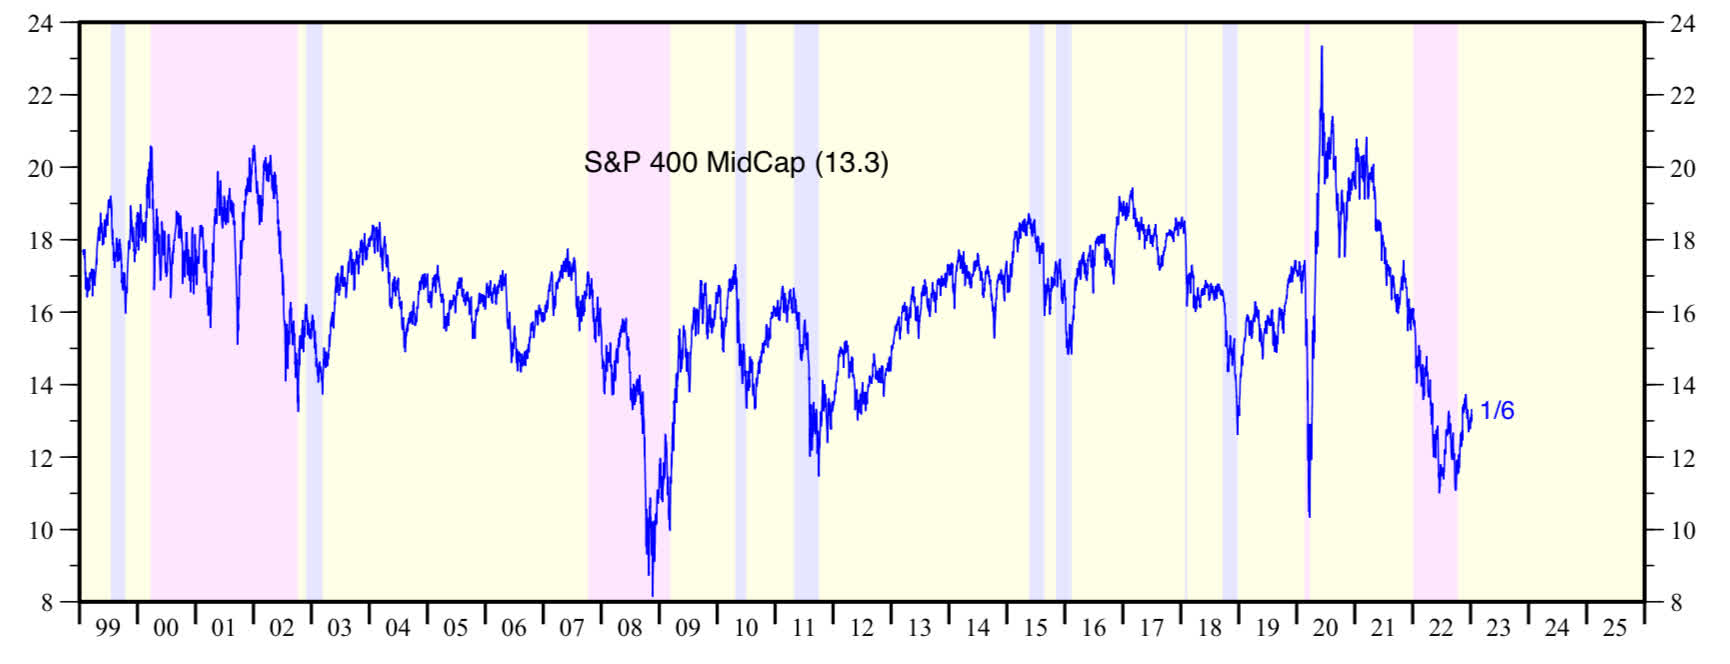
Mid cap valuation has contracted considerably, with price to earnings coming down from 22X to 13X.
Mid Cap Valuation (Yardeni Research )
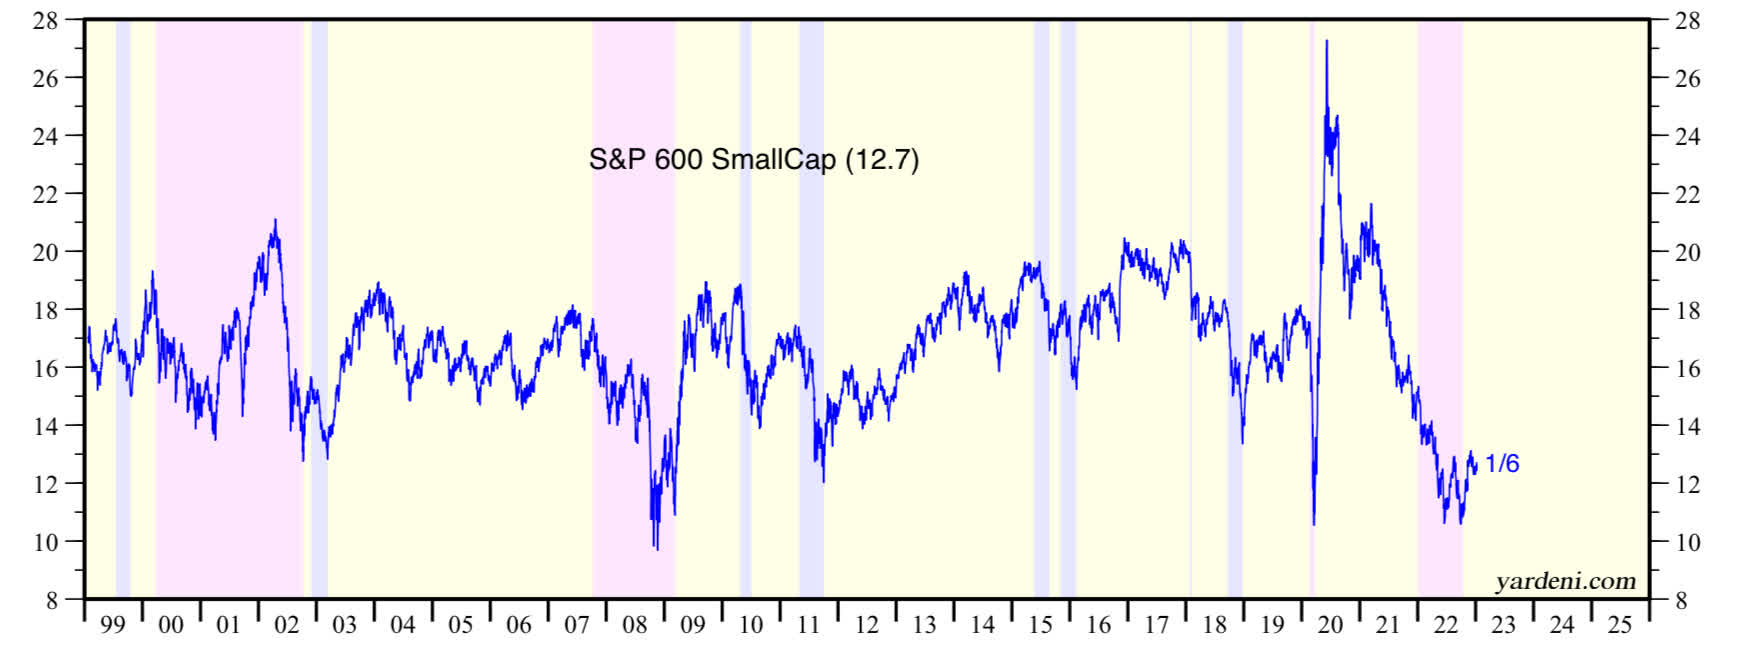
Small cap valuation has also contracted considerably, as forward price to earnings has come down from 23X to 12X.
Small cap valuation (Yardeni Research )
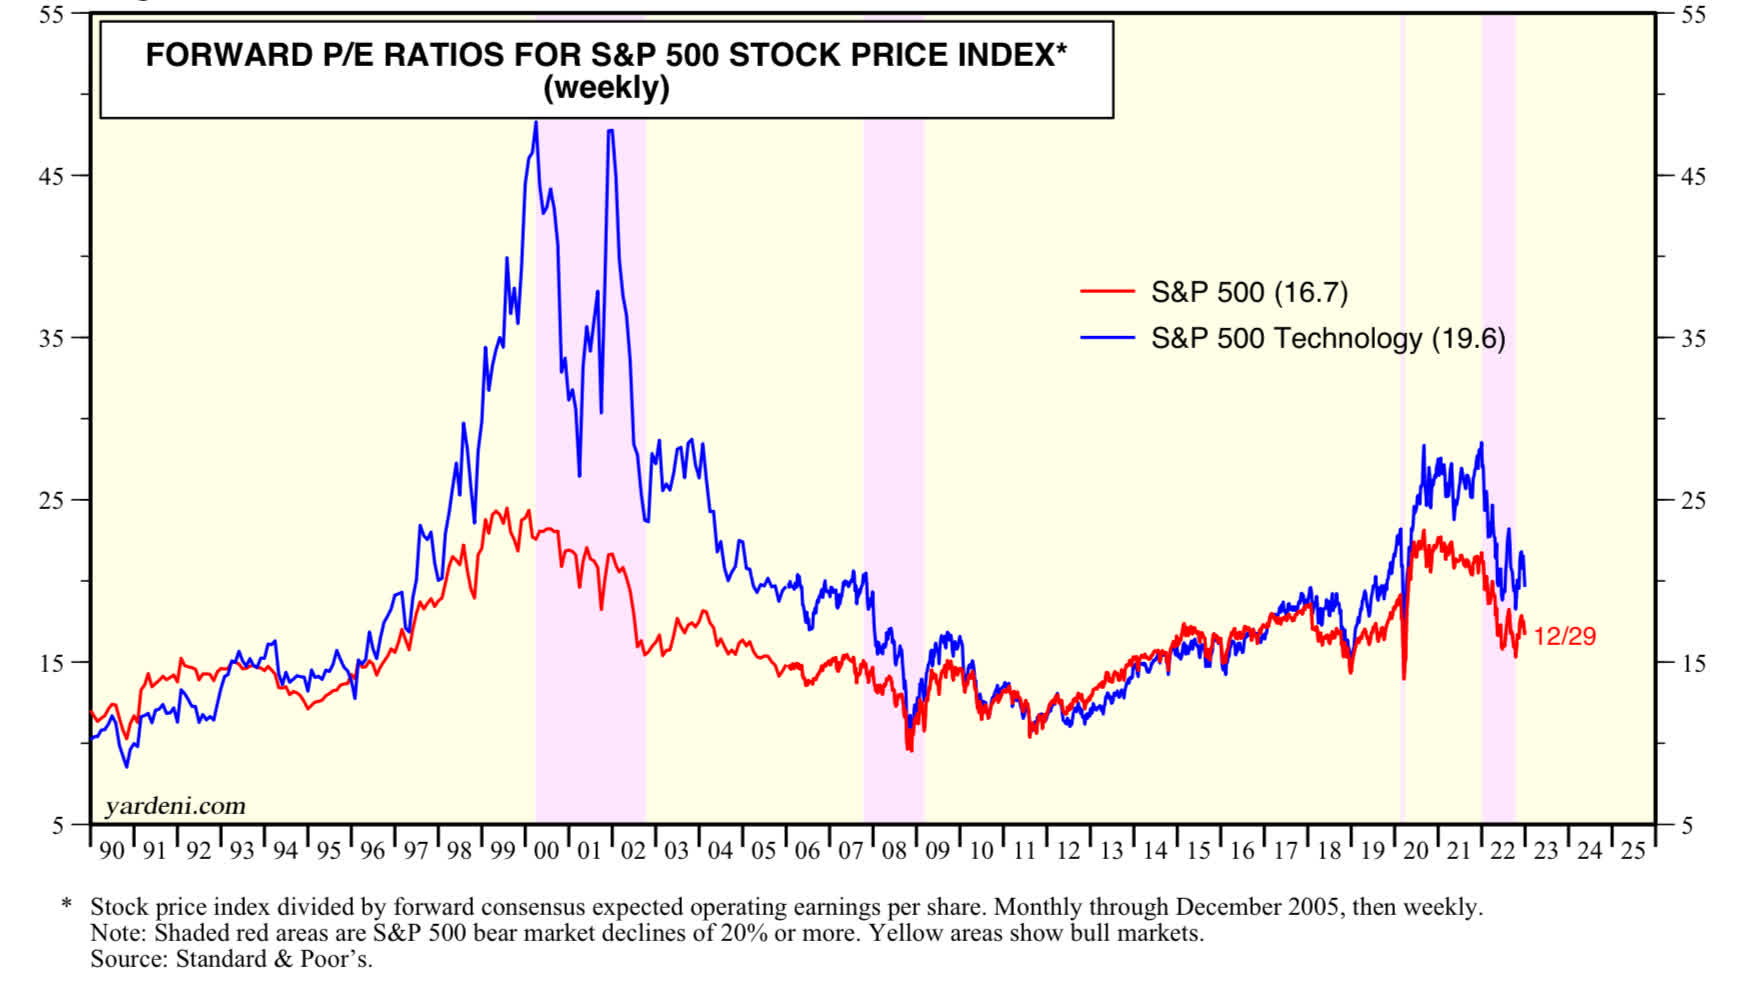
Valuation for technology stocks within the S&P 500 have a higher price to earnings of around 20X, while the rest of the S&P 500 companies are below 17X.
S&P 500 valuation for tech versus rest (Yardeni Research )
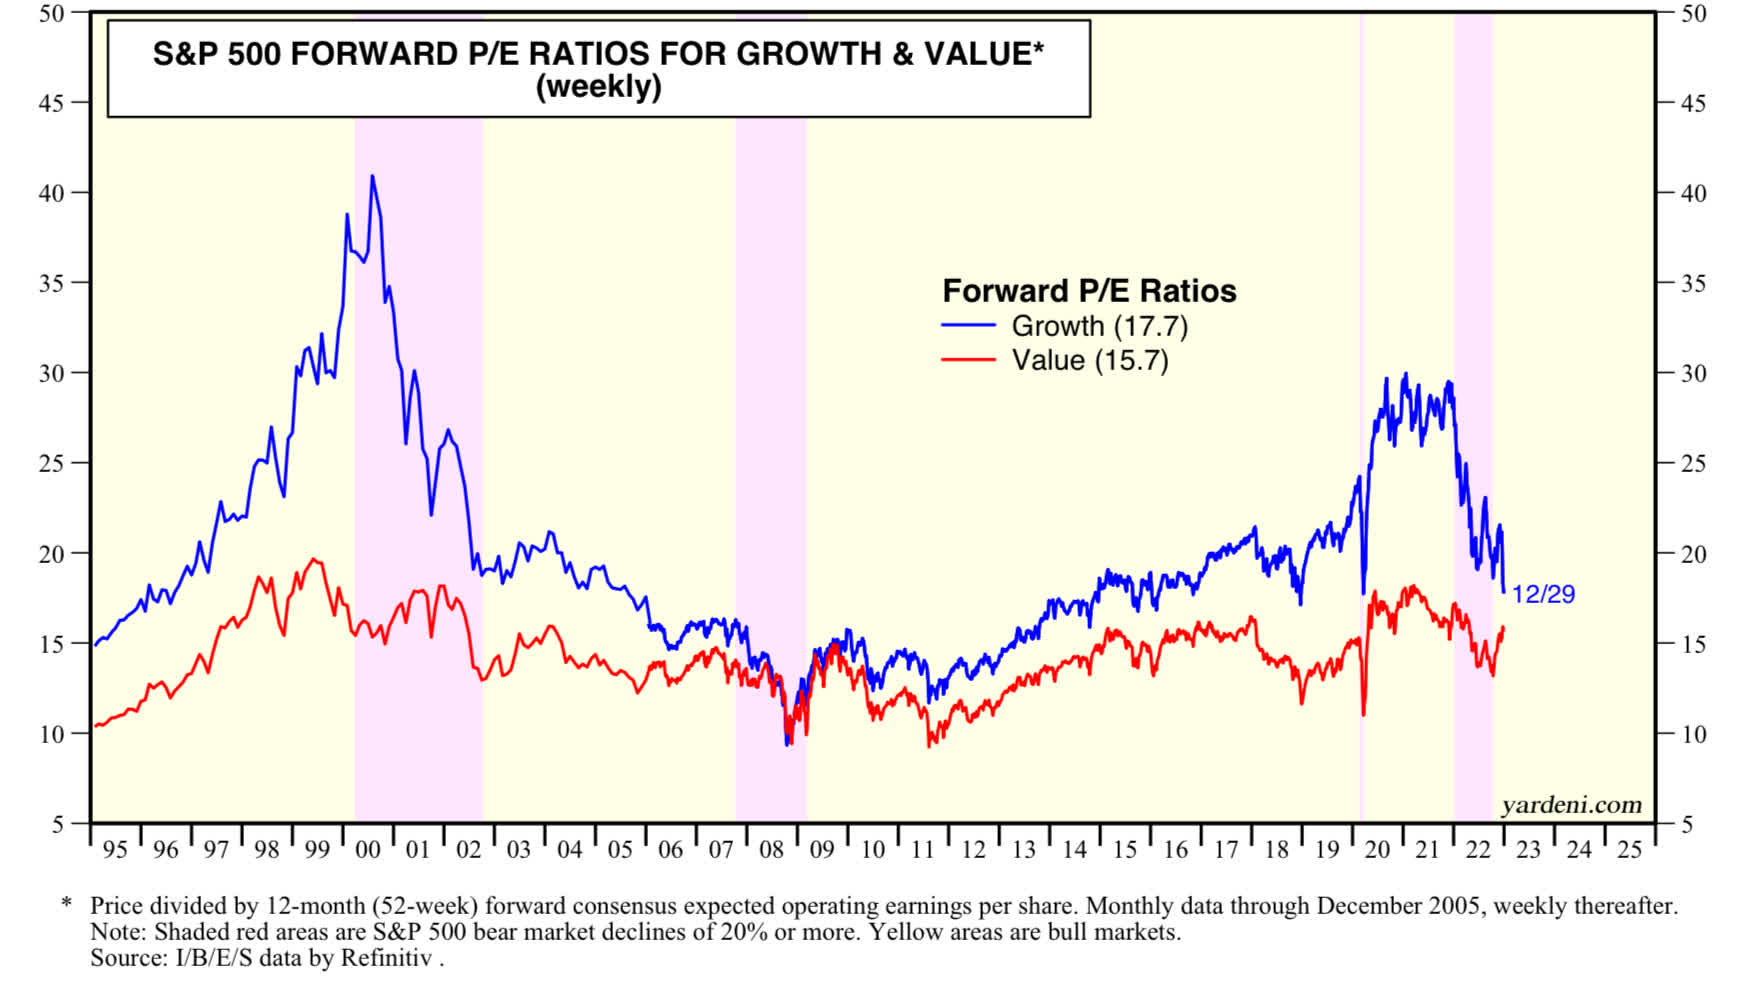
Forward price to earnings for growth stocks is about 17.7X, while that for value stocks is 15.7X.
S&P 500 Valuation Growth versus Value (Yardeni Research )
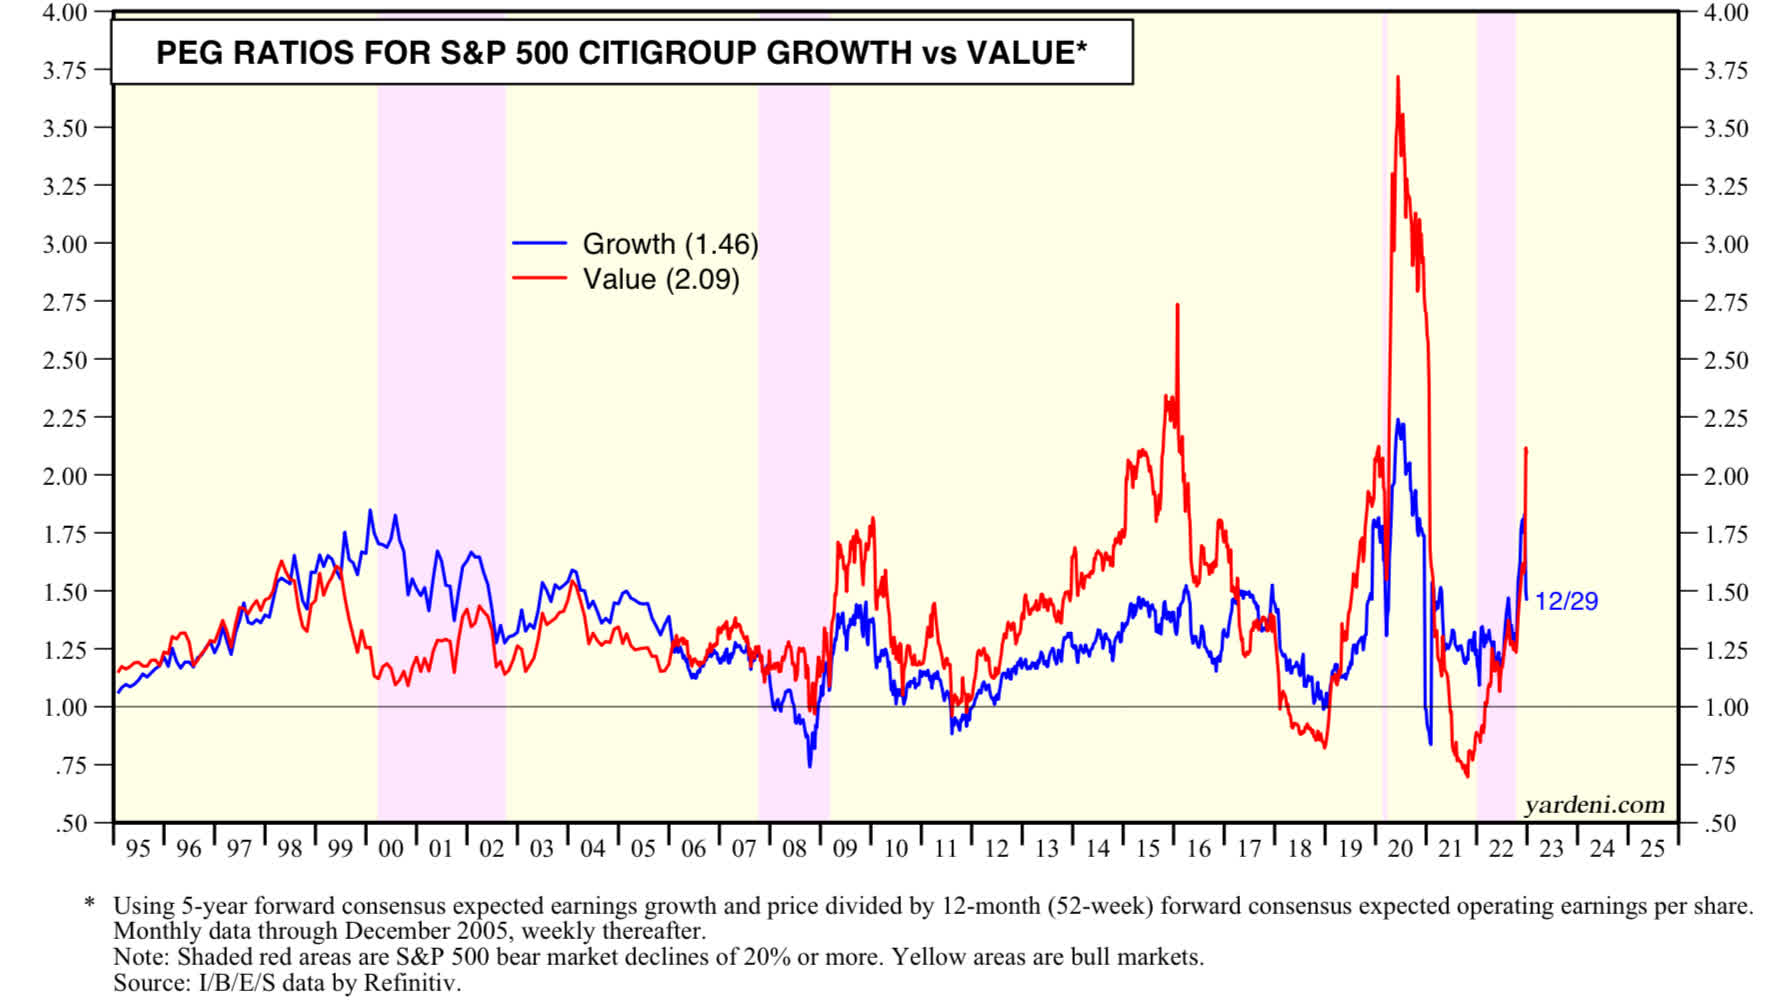
However, when one considers the growth rate into the valuation calculation, then the price to earnings to growth is at 1.46, while that for value is 2.09. Growth stocks are getting close to becoming a good buying opportunity while the value stocks have gotten expensive.
S&P 500 Valuation PEG Growth versus Value (Yardeni Research )
Summary
While large market cap weighted stocks remain under pressure, the average stock has bottomed and is getting closer to breaking out into the next uptrend. Economic data is slowing sharply, and if the U.S. economy were to go into a recession, then the stock market is likely to drop further as earnings will be under pressure. Growth stock valuation relative to their growth rate is getting close to an opportunity, and value stocks have become rich for their growth rate. We have to wait to buy into the stock market, though there might be opportunities in mid- and small-cap stocks. One important reason above all is to not fight the Federal Reserve.
For further details see:
Chart Storm For Early January 2023 (Technical Analysis)