CHE - Chemed: Continues To Compound Shareholder Value At Double-Digit Returns
2023-11-30 10:53:54 ET
Summary
- Chemed Corporation has historically matched long-term returns with minimal drawdown periods and durable economics.
- CHE has shown significant market growth over the years, compounding returns on shareholder equity.
- Business returns regularly level >20% in the TTM and CHE is allocating capital in ways to compound earnings on shareholder equity.
Investment update
Chemed Corporation ( CHE ) commons remain attractive as a long-term compounder in our opinion, offering 1) minimized drawdown periods to strengthen investor returns, and 2) durable long-term economics.
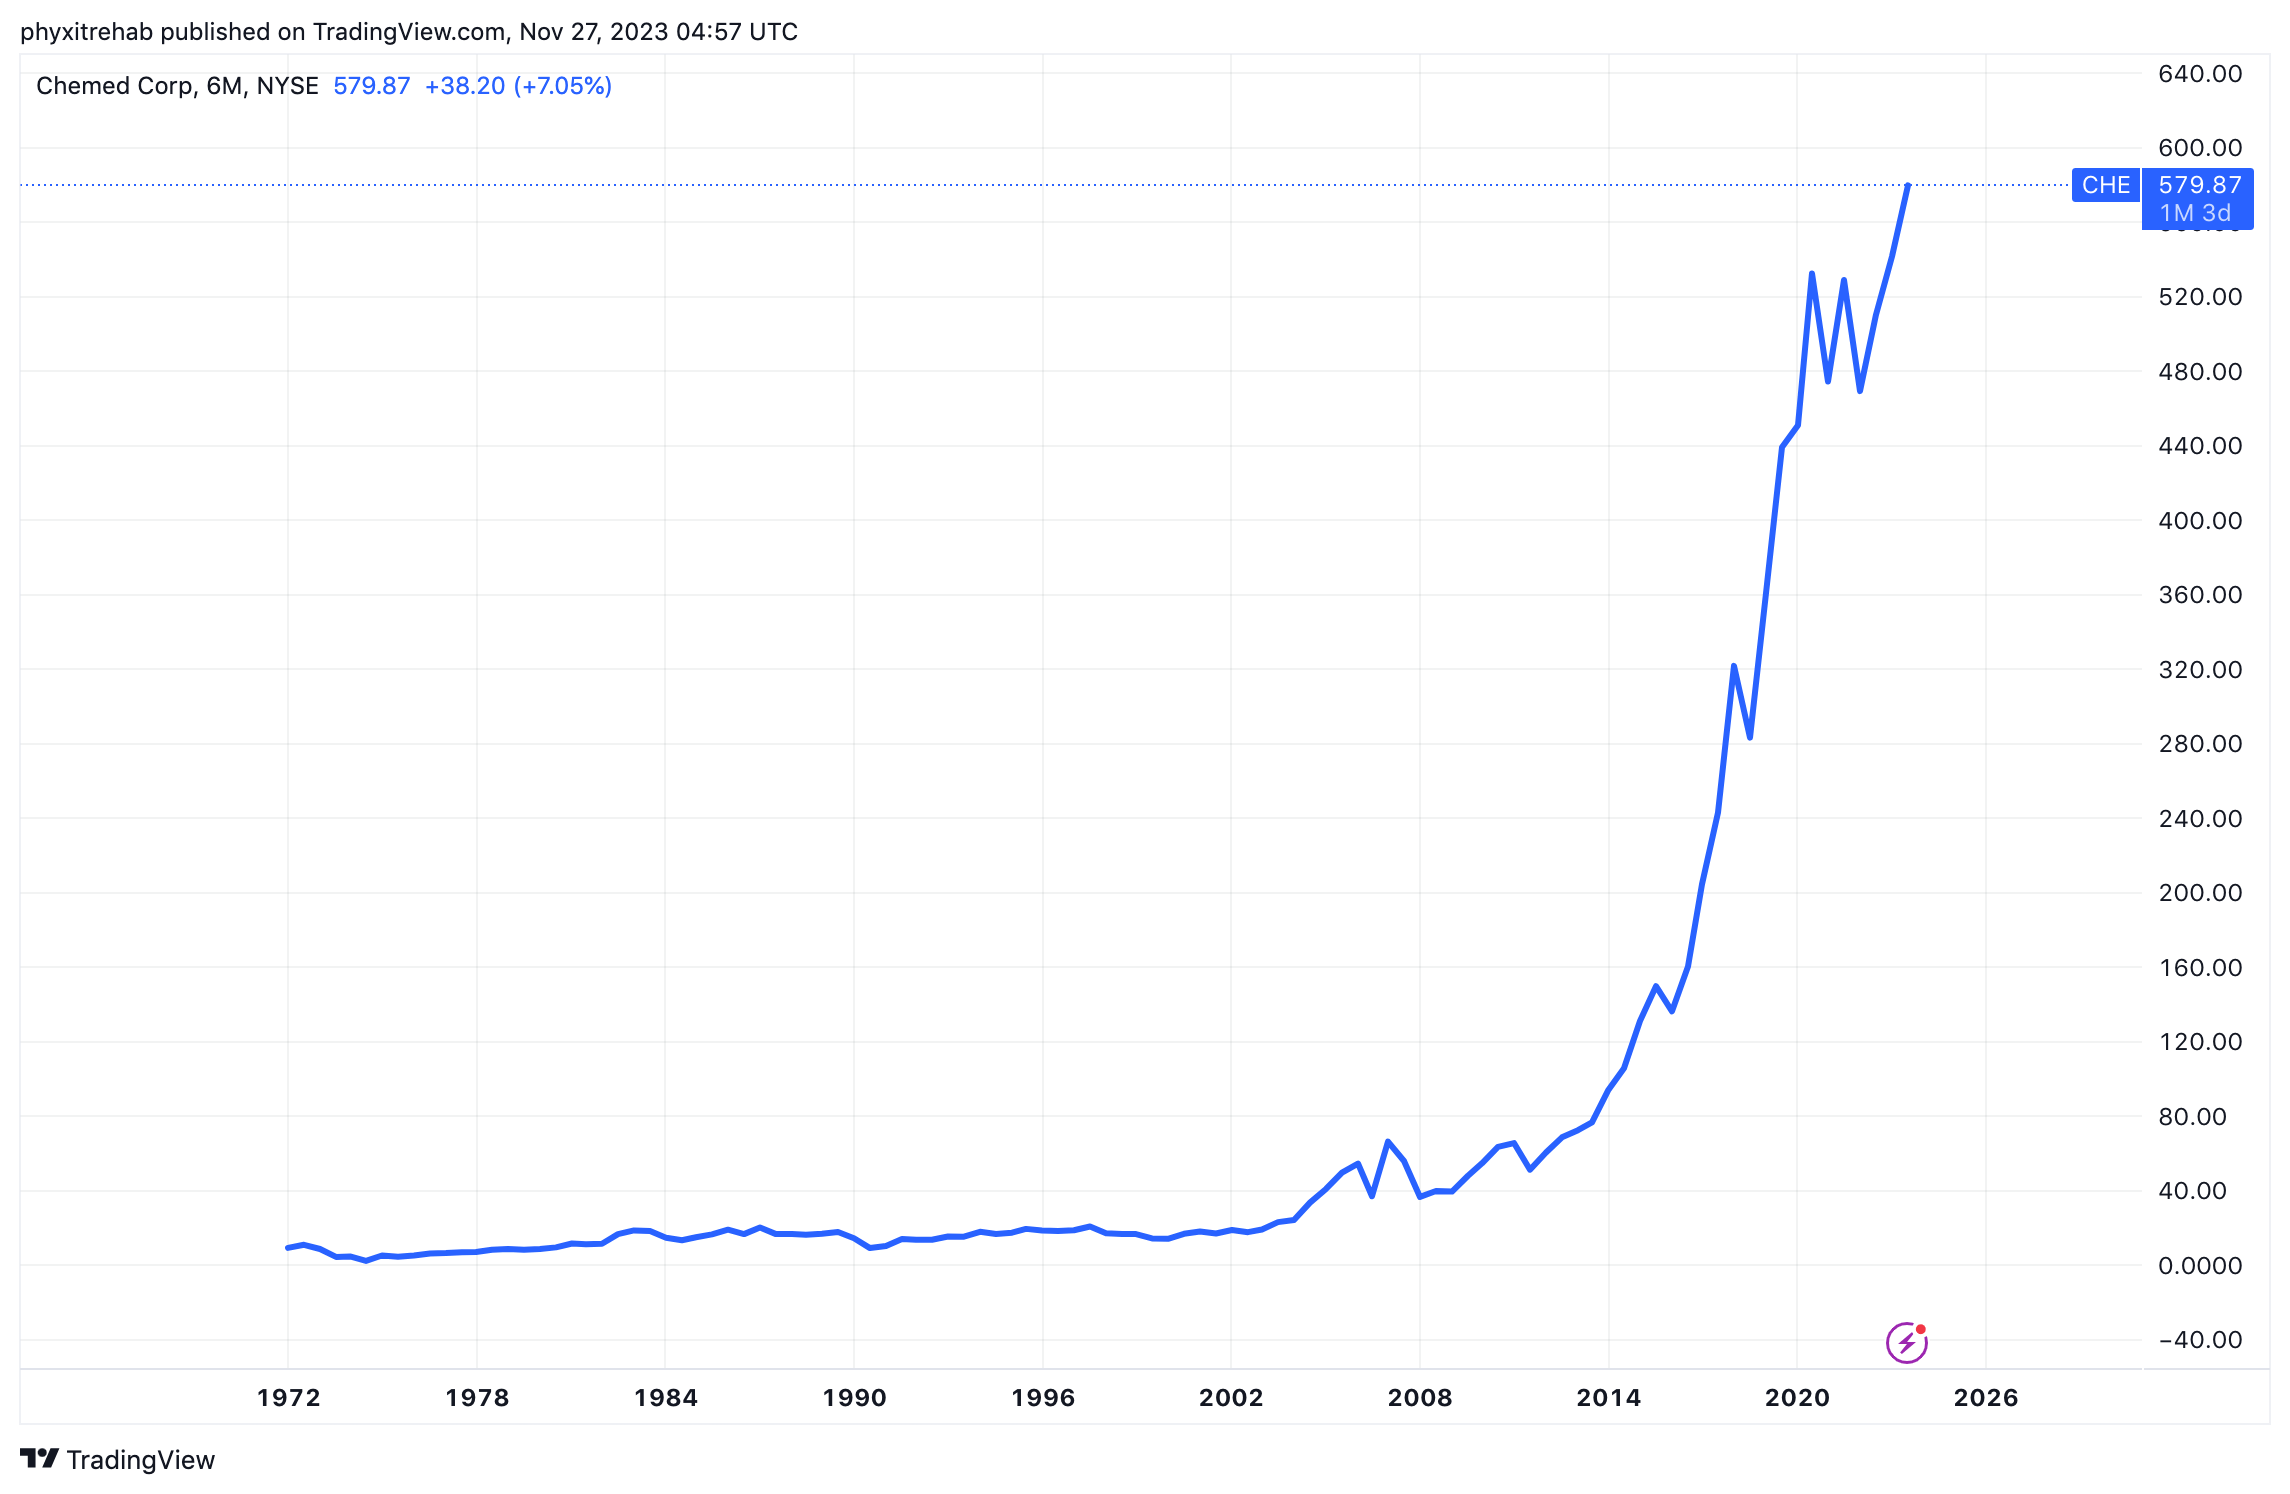
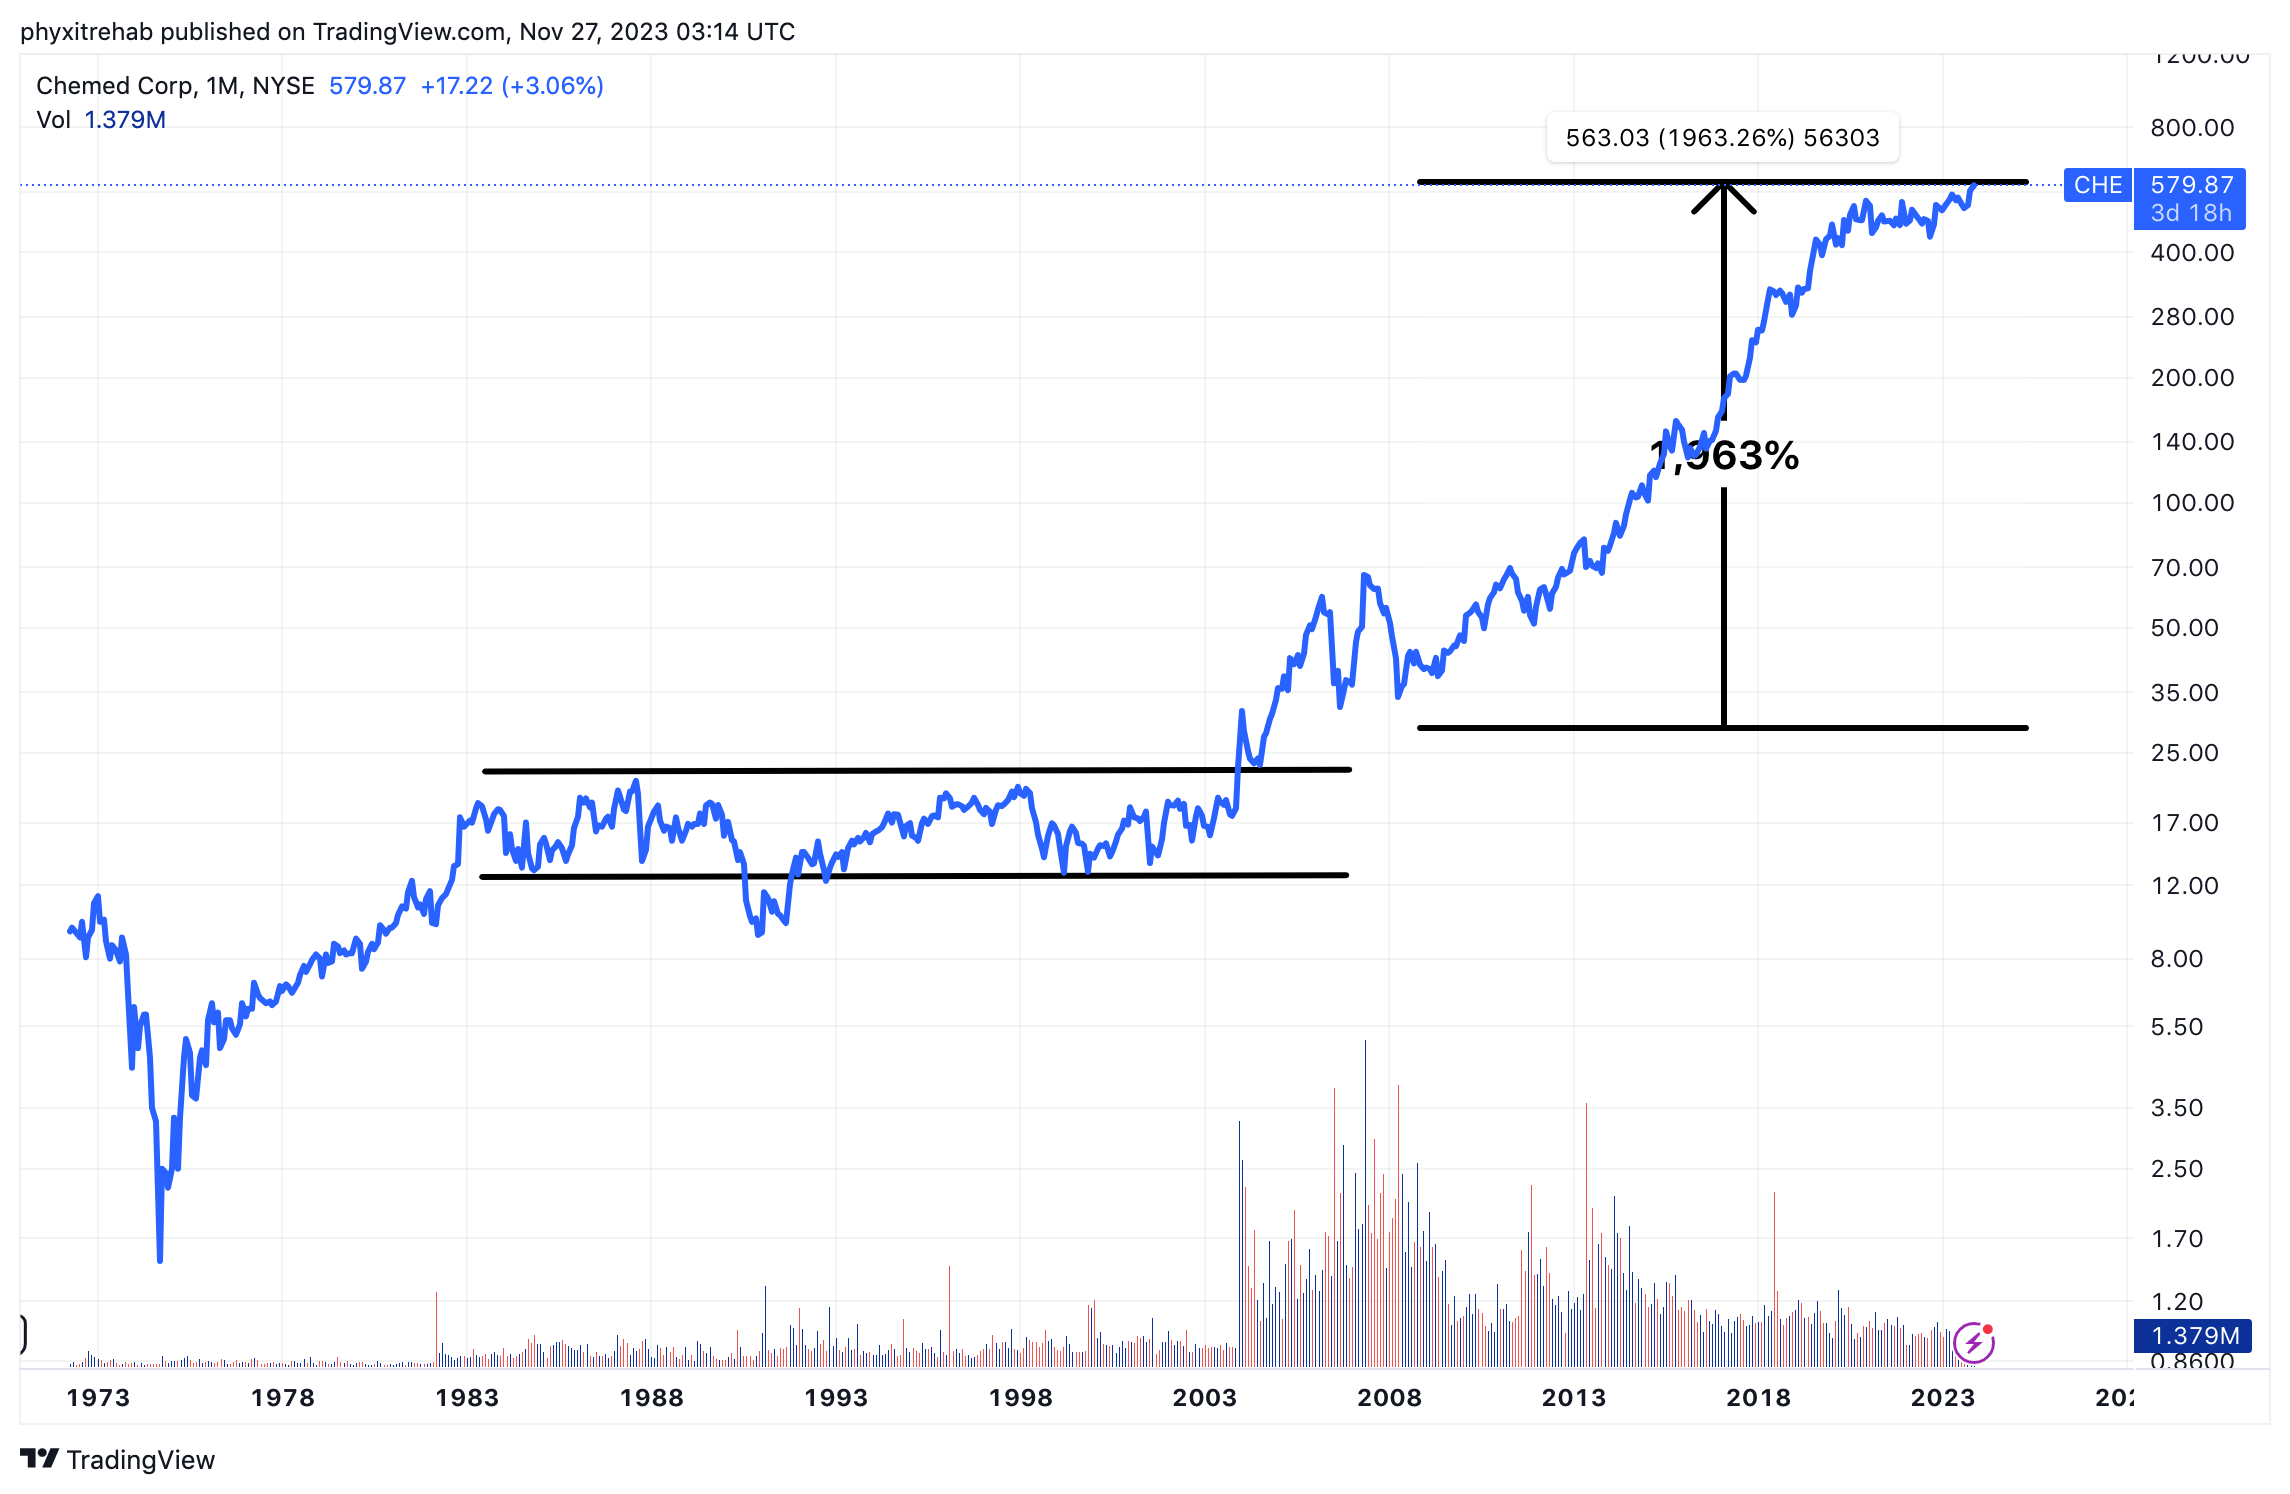
CHE is prime example of the stock market's wonders. Old blood can come alive again. As observed in Figure 1, the company, which listed in the early 70's in the $8s, fell as low as $1.70/share '74, before rallying $9-$10 with the market and settling range in the early 80s. People hadn't thought much of it from there.
There it traded within a $5 per share range, in the $12-$17s until 2003. That is a 20-year hiatus of price action. Now, following the dot-com burst, and through the GFC, CHE has compounded its market value by 1,963%, from ~$20/share to $579/share at the time of writing, from 2003 to 2023-another 20 years.
Twenty years sideways, then 20-years in upwards in vertical fashion. As mentioned, this is the marvel of the stock market. The returns depicted in Figure 1 are log-returns by the way, the arithmetic gains in Figure 1a show it all, with yearly returns shown since 1972. ( Figure 1a.)
These are tremendous achievements, but already reflected in time-based market values. " We don't get paid for what's happened", as they say. However, based on key findings presented here, my judgement is these trends will continue moving forward.
Figure 1.
Since my last CHE publication, there have been notable changes in the investment debate. The company reported Q3 numbers , a $300mm buyback announced, that sort of thing.
In the last analysis, I said "CHE still offers tremendous value to unlock risk capital provided it can demonstrate 1) avenues to deploy surplus capital and/or 2) evidenced top-line growth above the market's estimates."
Mauboussin & Rappaport in Expectations Investing argue that investors capture returns when they anticipate changes to expectations currently embedded into a company's stock price. In my opinion, the text overlooks the fact the continuation of expectations is a potential tailwind for corporate securities as well. Such is the case for CHE.
The key investment facts are as follows:
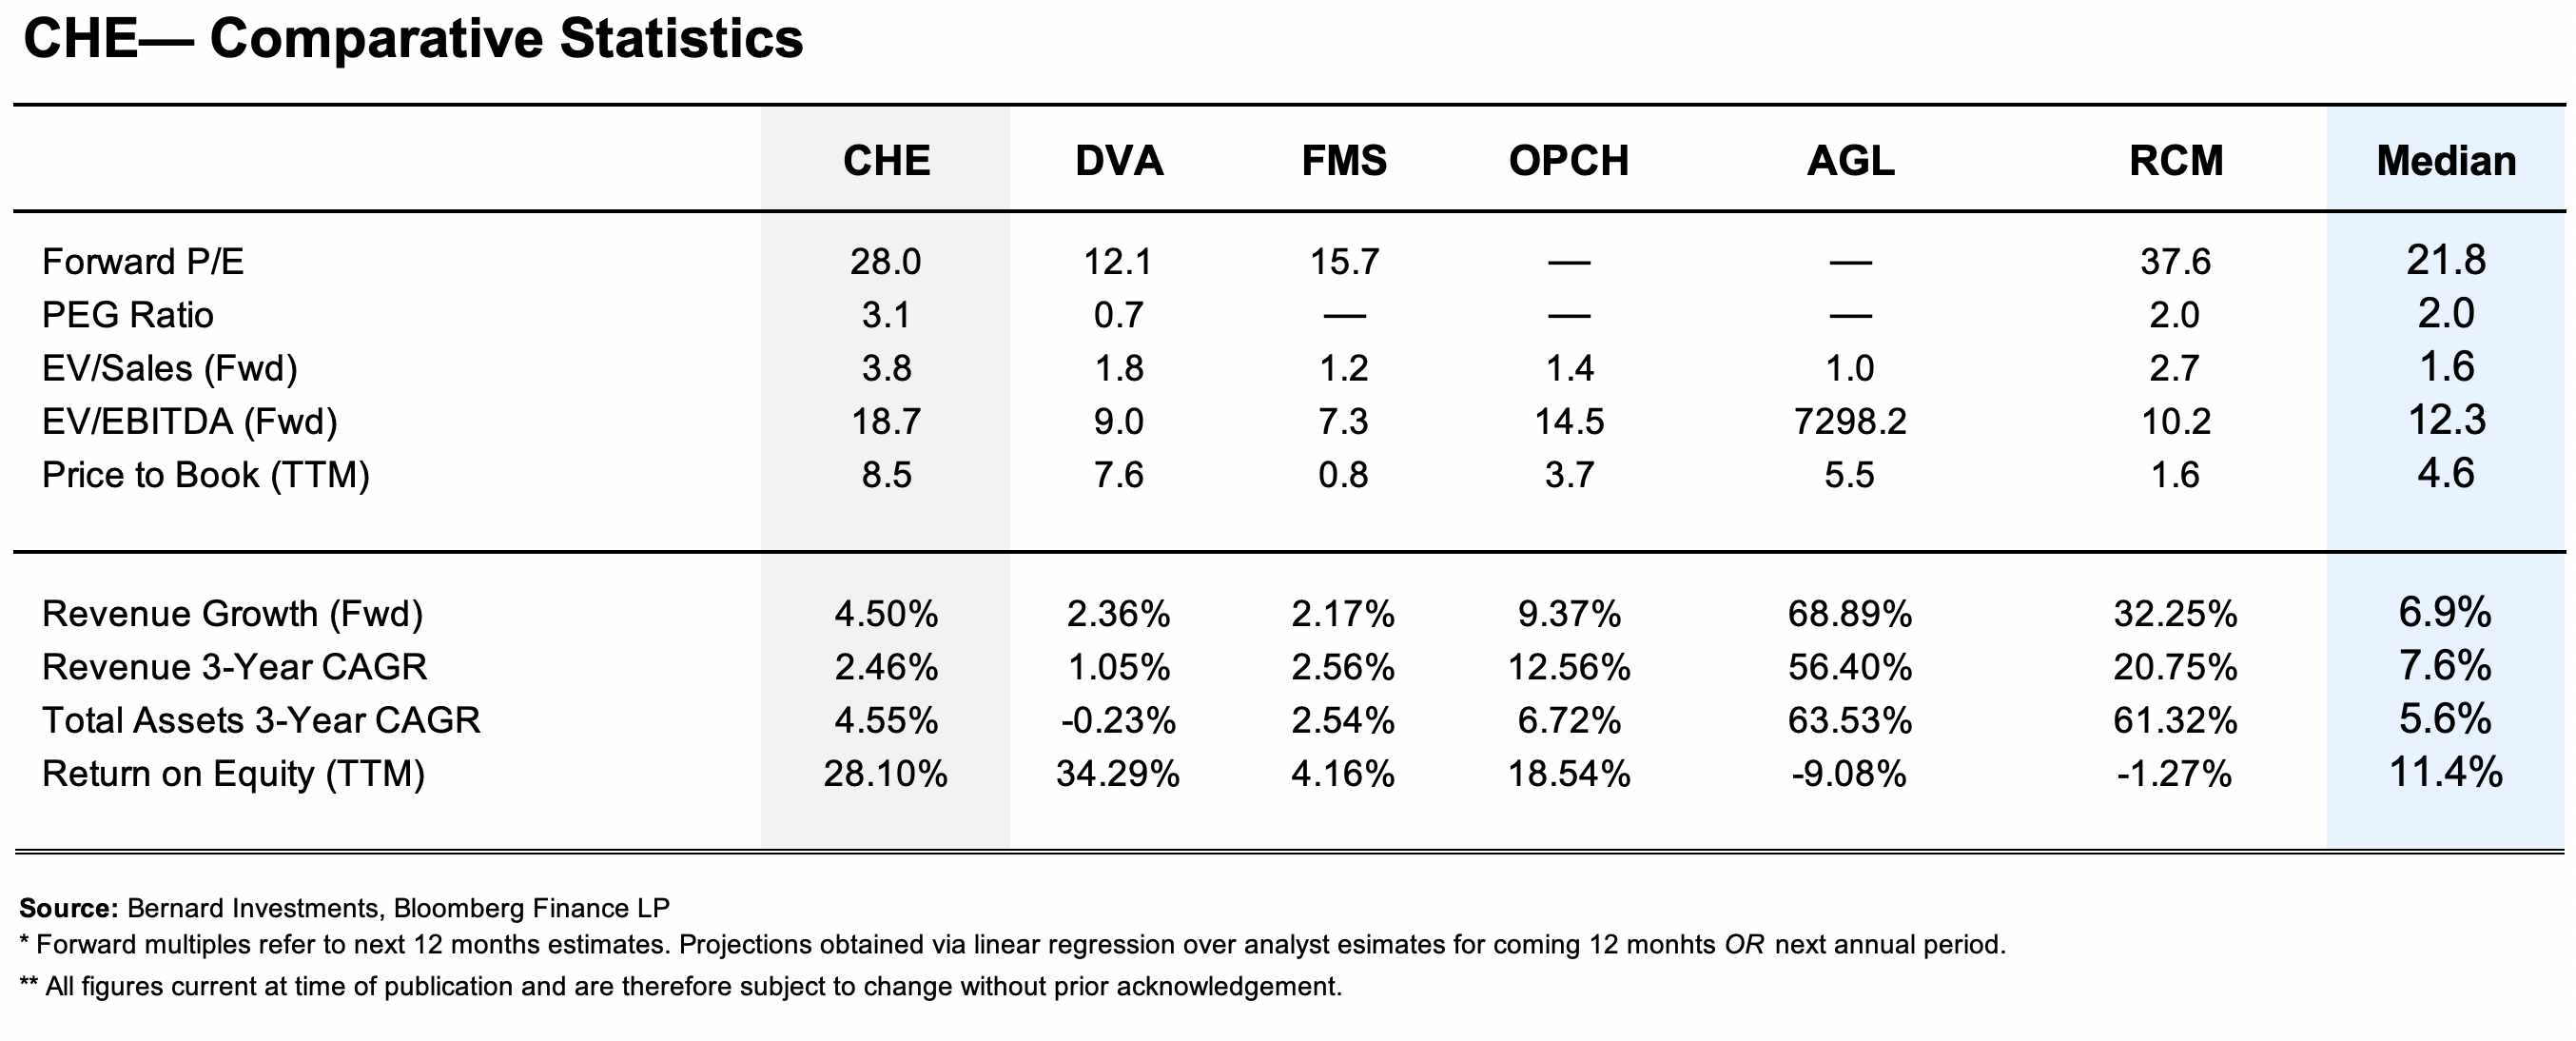
- The company sells at a combo of 28x forward earnings and 22.5x forward EBIT, 8.5x book value. These are quite the premium, and no reflection of growth or period of faster business for CHE. Key comparative statistics to comparable peers are observed in Figure 2. To me these sports the notion that you need to be looking very long-term for CHE. Growing into these multiples in the short-term (next 12 months) might be a stretch.
- Investors receive tremendous value for buying CHE, even at these multiples (22x P/E, 8.5x book value), as a potential justification:
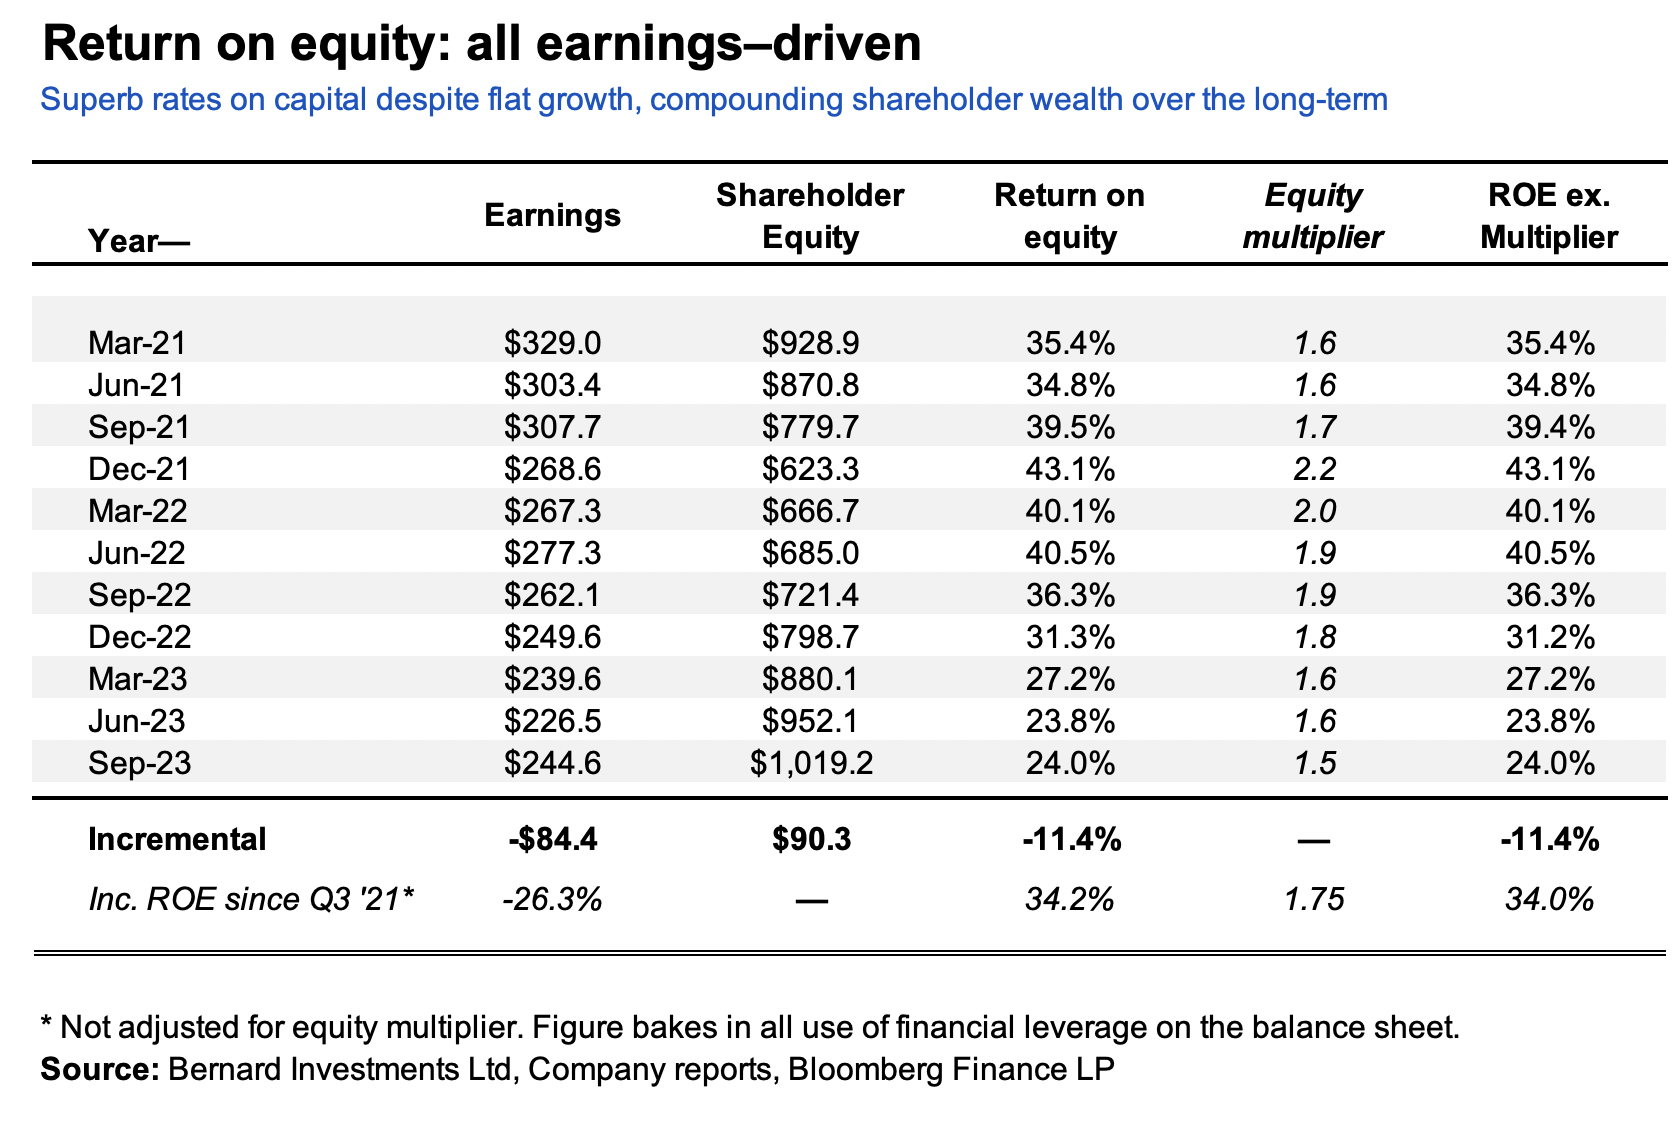
- Average TTM return on equity of 27% since 2021,
- ROE all earnings-driven-no leverage to amplify asset returns,
- Business returns regularly >20% in routine fashion, recycling capital into new growth ventures, buybacks, and dividends.
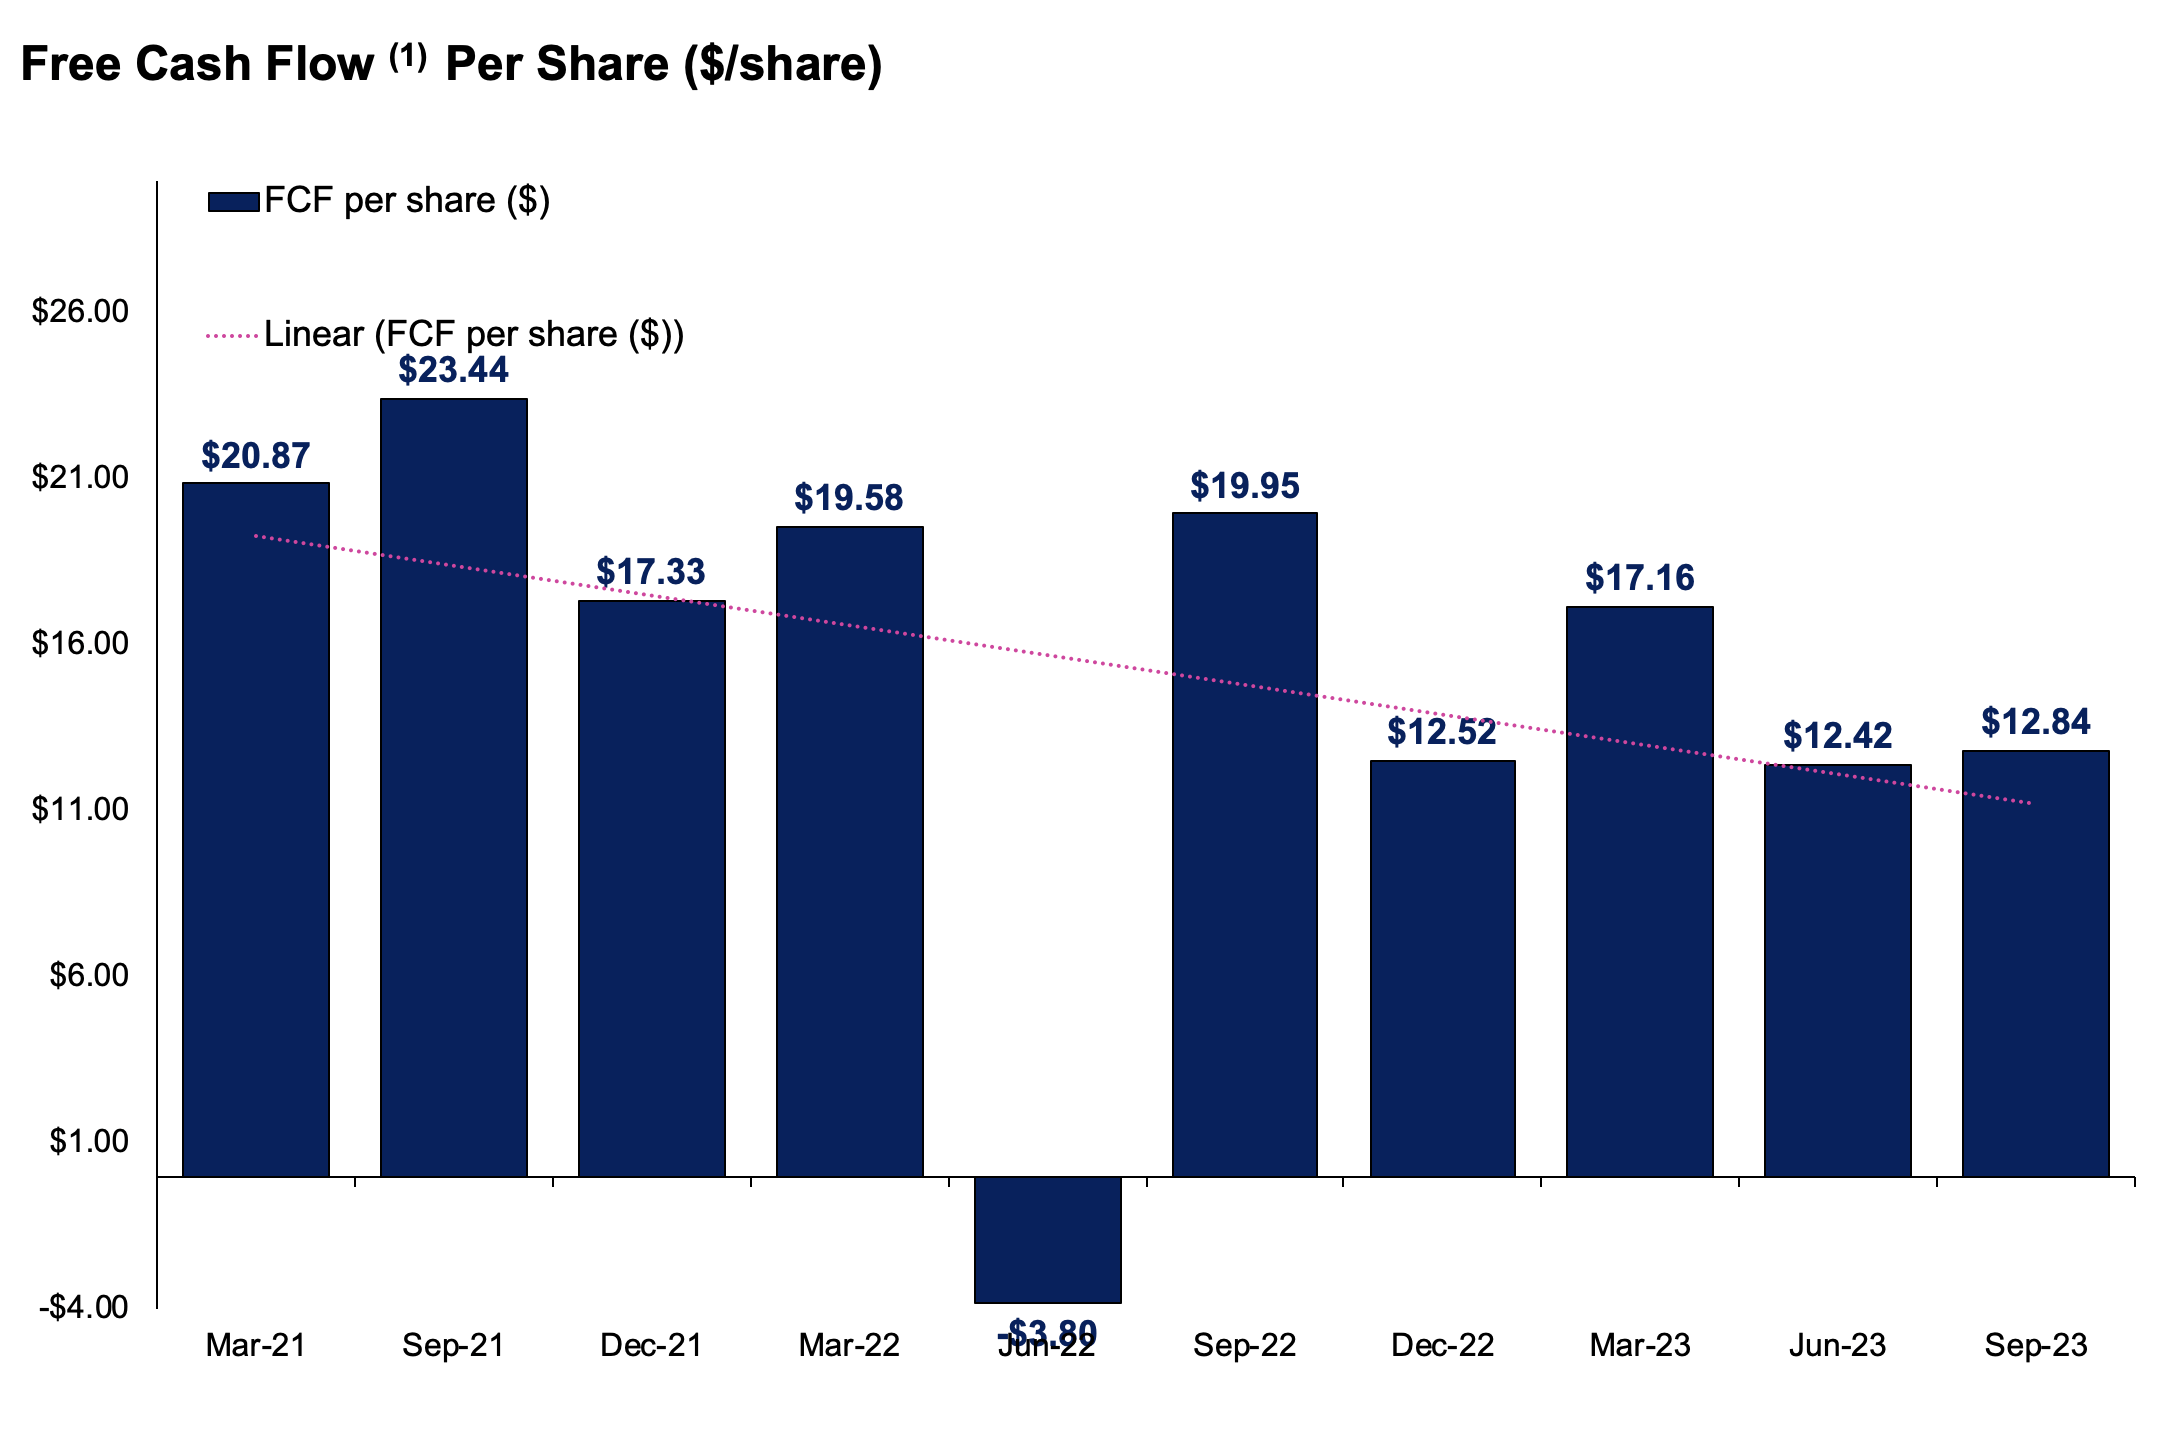
- These critical facts explain how CHE is routinely able to spin off $12-$17 per share in FCF, as high as $23 in 2021 (Figure 7).
In reality, the choice of owning CHE boils down to individual investor preferences, as it always does. But, I would tier my recommendations on CHE in the following way:
- Short-term : neutral, multiples leave no headroom in the next 12mo.
- Mid-term: bullish, continued sales + earnings growth with consistent clip,
- Long-term : bullish, compounding shareholder equity at superb rates of return. The impact of valuations/multiples far less noticed over this time frame too (5+ years).
Net-net, I continue to rate CHE a buy on long-term (5 years+) value.
Figure 2.
Talking points
Return on equity compounding shareholder value
Both the market and Wall Street are projecting a period of decent business for the company into 2025. Earnings are forecast to compound at an avg. 8%, sales at avg. ~5%-typical mature phased company trends.
What the growth percentages don't provide is context, like the earnings compared to assets and capital employed-critical values for investors. CHE has a demonstrated history of compounding earnings produced on shareholder equity at double-digit rates, with no use of leverage. In saying so:
- On the company's current net asset value per share of c.$68.00, 4.8% earnings growth in 2023 would yield a 30% ROE,
- Similarly, 11% earnings growth might yield 34% return on shareholder equity in 2024,
- And so on. The point is, incremental growth is well supported by the assets financed by CHE's equity. It is therefore of high value. There is no meaningful debt. Shareholders are therefore well compensated, and the company enjoys a higher sustainable growth rate due to the elevated ROE.
- Most critically, future earnings growth is bolstered by the reinvestment of the >20-30% ROE into additional business capital for growth + value.
These characteristics are excellent for current investors/shareholders owning CHE. The picture is slightly different for the buyer of CHE today, one looking out the next 12 months to 3 years in particular.
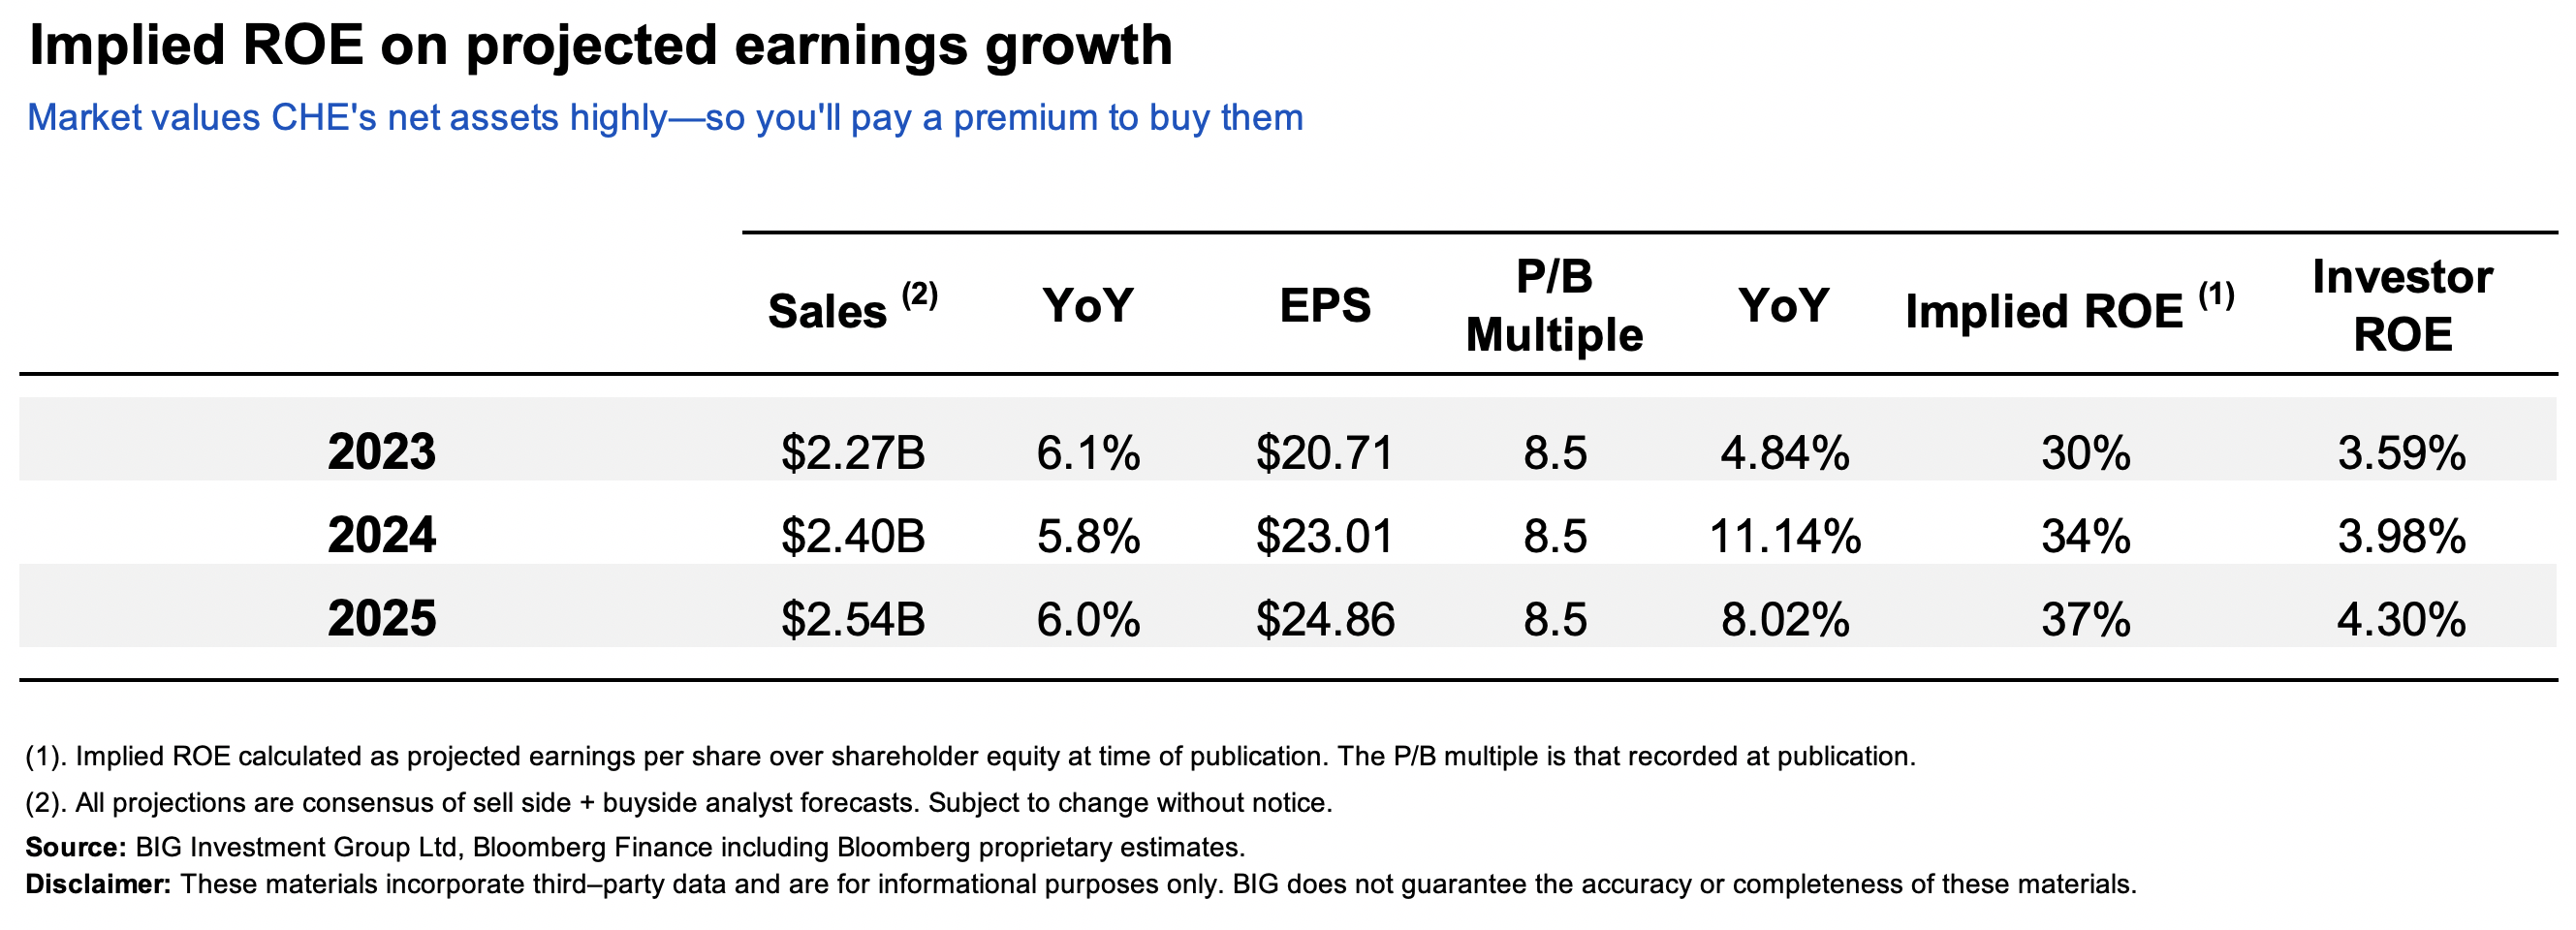
Paying 8.5x book value today drastically reduces the shareholder value created on the investment by CHE's exceptional economics for a 1 year investment horizon. A 34% ROE becomes 3.98% for the investor in paying that multiple, until the next 12 months of return flow in. This changes the investment outlook by quite a magnitude. For example (see Figure 3):
- Forward ROE = 34% (23.01 EPS/1,019 = 34%),
- Investor pays 8.5x equity value (1,019 x 8.5 = 8,661),
- Investor ROE is ~4% (23.01 EPS / 8,661 = 3.98%).
Note this example assumes the current book value on publication of $68.00 per share and carries this through until '24.
Again, there is plenty on offer in buying the company today, but an extended horizon is needed to realize it.
Figure 3.
The economic value created by this mechanism of CHE's is one of high value in my estimation. You have a company that is:
- routinely producing returns of 20-30% on its net asset value, commanding a market premium,
- reinvesting the surplus capital/cash flow into business operations, dividends, and buybacks. Critically, this is not a growth operation. This is one that spins off high rates of return on equity capital, building shareholder value,
- therefore compounding its intrinsic value and market value in doing so.
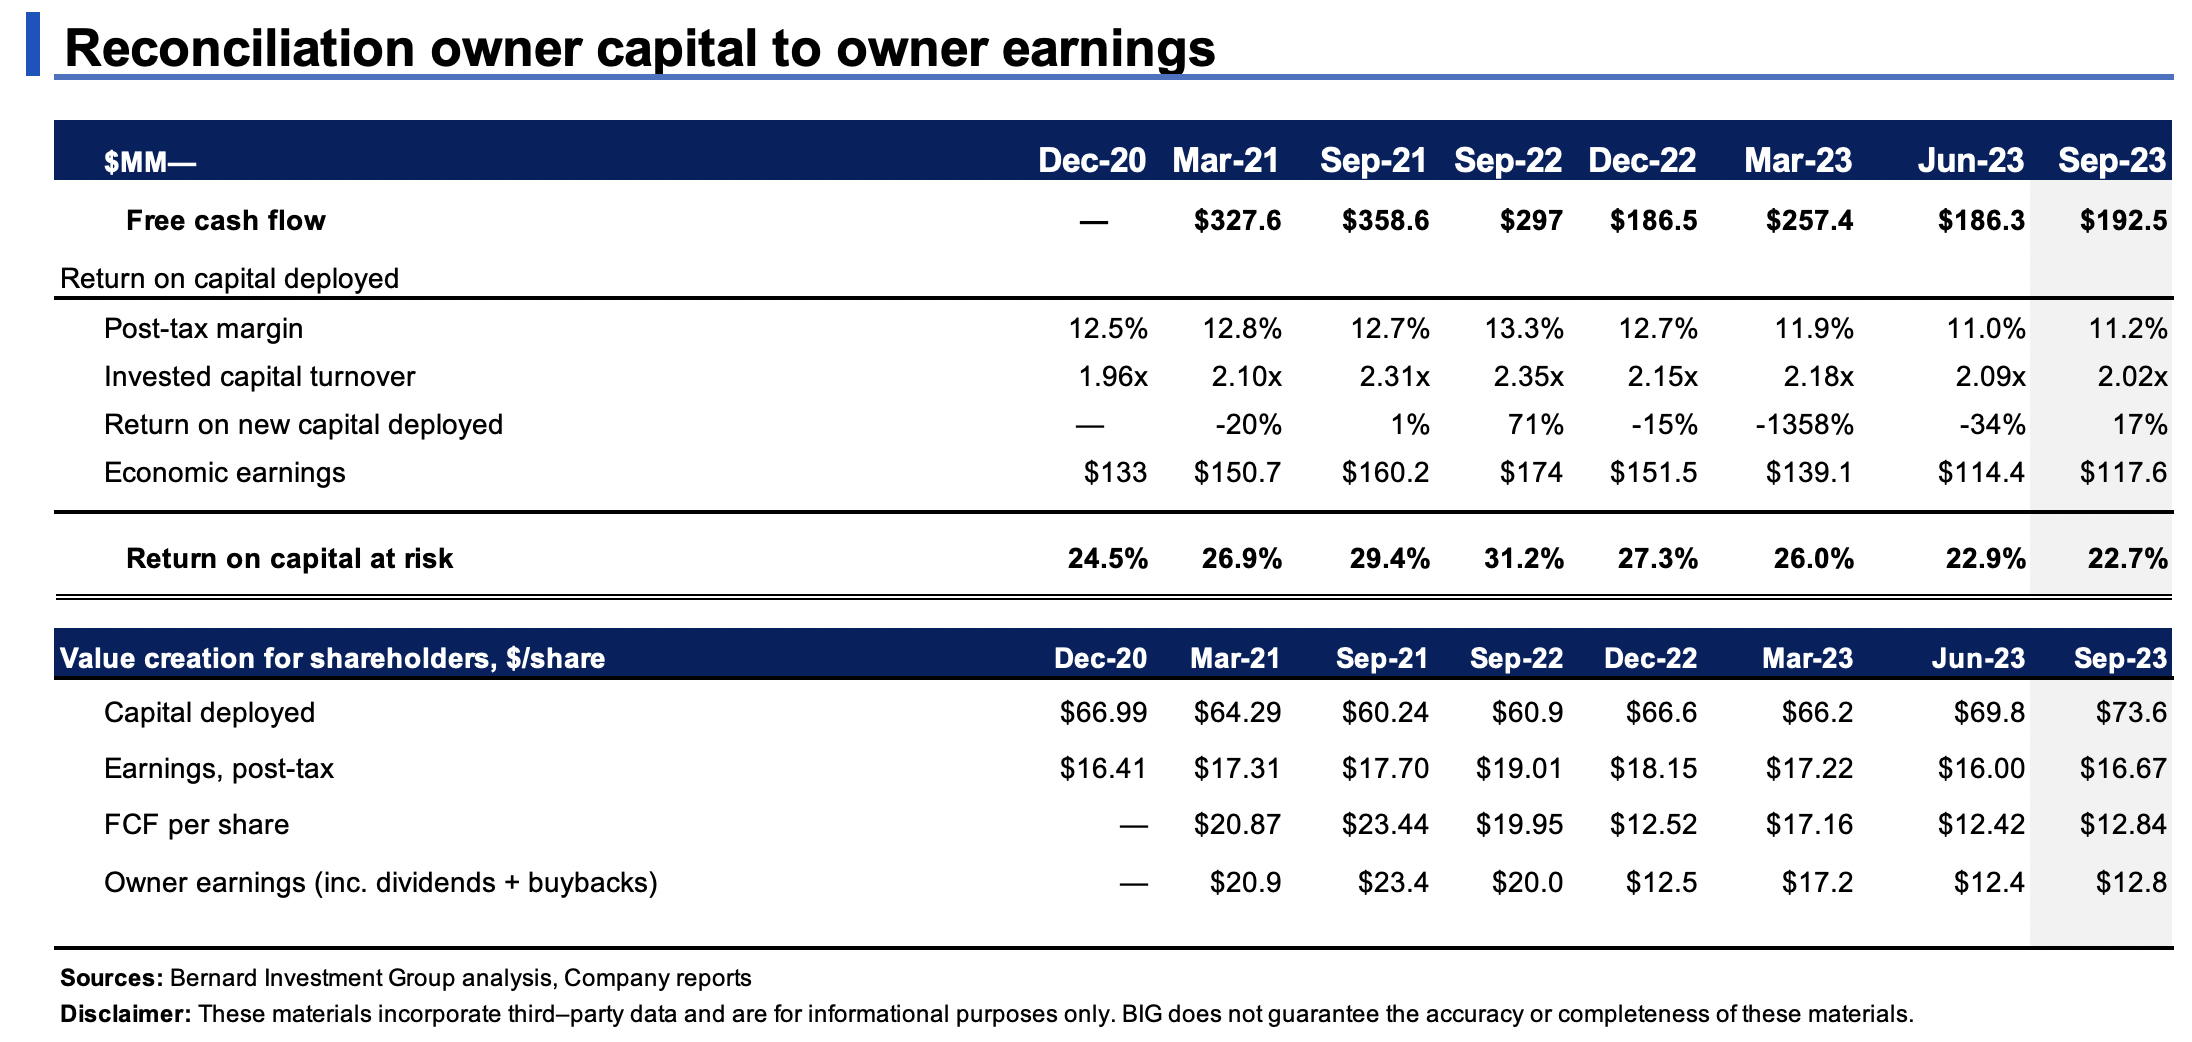
How it gets there is nothing spectacular either, but that's the beauty of it all in my opinion. Post-tax margins of 11% whilst the ratio of sales to capital is ~2x, meaning each $1 invested into the business produces $2 in revenues (Figure 5). Tremendously productive capital that, over time, results in expansive turnover.
Figure 4.
Figure 5.
Further economics of shareholder value
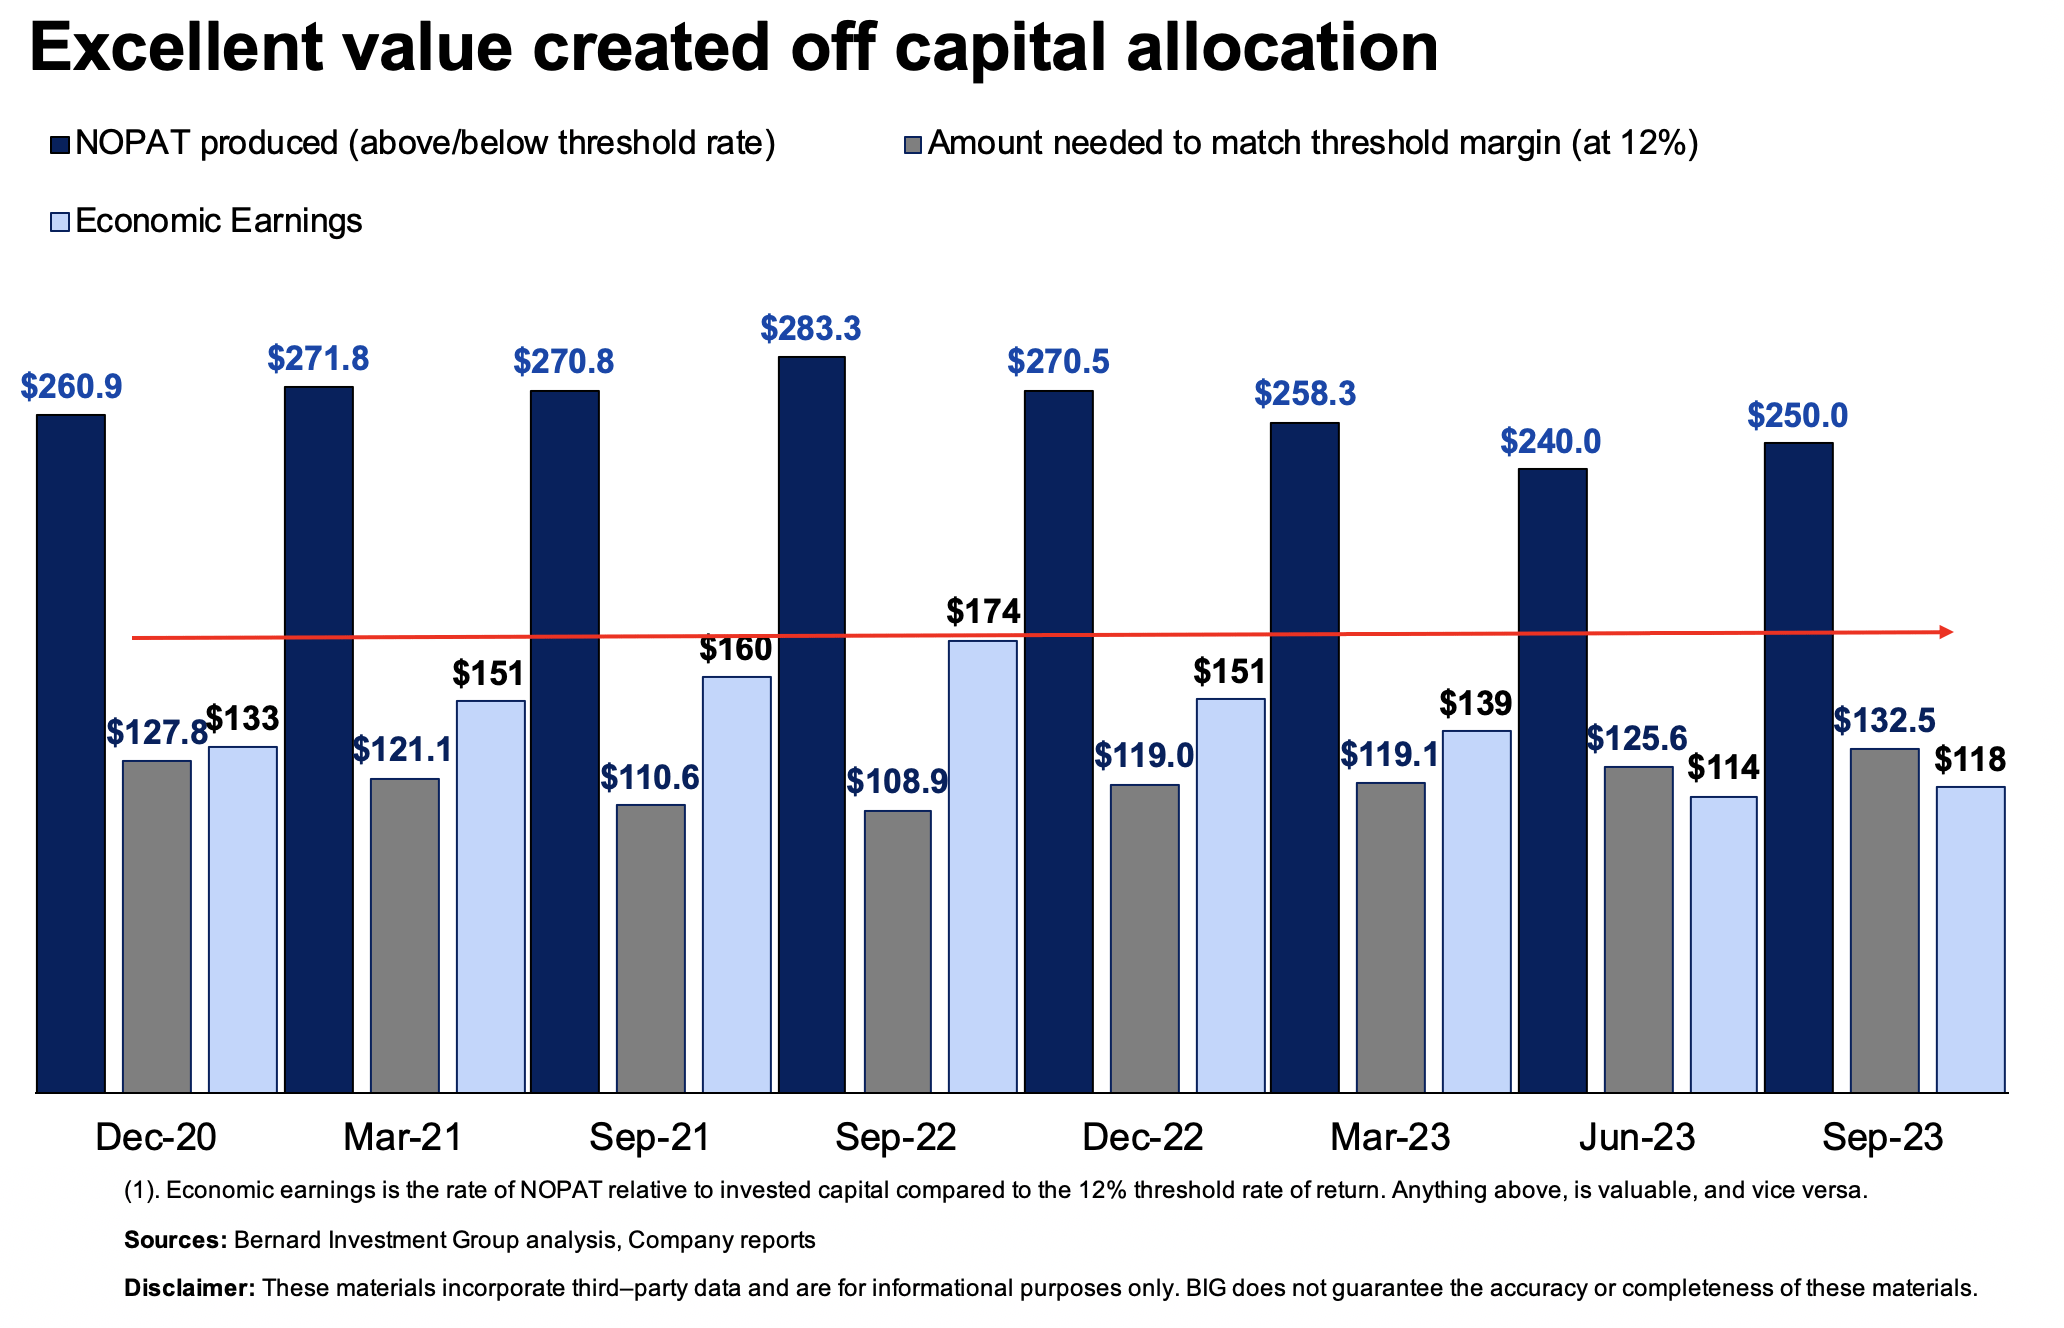
Because the earnings surpass such a high watermark they are economically valuable to investors. All those profits above what could have been earned at the opportunity cost increase economic value. A threshold of 12% is usually sufficient as it reflects long-term market averages.
CHE routinely prints through returns on its equity capital of >20-30% and has trended around this zone for years (8%-18% spread). My judgement this will continue within a range moving forward. A significant portion of its earnings are therefore considered directly accretive to shareholder value, $7.84 per share last period.
Figure 6.
The final point ties all of these economic assumptions together. As a reminder so far:
- We have a company routinely passing through 20-30% return on shareholder equity each rolling TTM period. It does not require intensive equity or debt capital to maintain its competitive position.
- This produces a high percentage of economic earnings and profits that are reinvested into operations or returned to shareholders. All because the company's invested capital and business economics (high capital turnover) produce business returns of 20-30% as well.
- The benefit = CHE throws off piles of cash to its shareholders. A cumulative $152.30 per share since 2021, averaging TTM $17.20 per quarter.
The company's stock price has advanced by $148.20 since March 2021 as well, unsurprisingly. My judgement is these trends can continue. FCF/share is trending lower but coming off a high base across 2021-'22. The company will buy back $300mm of stock as well reducing the float and increasing FCF/share.
Figure 7.
Insights from Q3 earnings
The company reported Q3 numbers on October 26th. Q3 revenues were up 7.2% YoY to tally $565mm. Earnings were up 30.4% YoY on this, illustrating the value factor on offer. Looking to the divisional takeouts:
- VITAS segment: net patient revenue rose by 12.5% to $334mm, with average daily census ("ADC") and admissions growing by 9.4% and 7.5% YoY respectively. Earnings were up by 63.1% to $42.6mm, on adj. EBITDA margin of 16.5%.
- Roto-Rooter: Revenues flat to $231mm on flat earnings of $49.0mm. It clipped an adj. EBITDA margin of this of 29%.
Management are calling for 9-9.5% YoY sales growth in FY'23 and is eyeing 19-$20/share in earnings on this. As mentioned, consensus has 6% sales growth on 4-5% earnings upside, so management's estimates are more constructive than The Street's.
This is something to take note of. The question is one of three outcomes; who will revise higher, who will revise lower, or nothing will change (company vs. Street). Management's especially bullish outlook is another factor reiterating my buy thesis on the company.
Valuation and conclusion
CHE is priced at a premium for the short to mid-term investor, where change in multiples is less probable in such a short duration. This is a long-term compounder with quality economics in the mix.
As a reminder, the value proposition is:
- Pay 22x earnings / 8.5x book value, receive 20-30% return on equity on a consistent basis in my judgement (no debt)
- Buying cash producing assets with high turnover ratios that compound capital at 20-30% as well, whilst throwing off $12-$17 in FCF per share (based on recent history, which I feel can continue)
- Continue to potentially receive earnings above the long-term market averages to compound intrinsic value/wealth.
CHE's stable FCFs and extensive operating history add a level of predictability to the company's growth/cash flow outlook. You are paying a premium to participate in a long-term growth story that is compounding value + shareholder wealth incrementally over the long-term. For large accounts, this is one to consider as a liquid diversifier to reduce drawdown and obtain value. Net-net, I rate CHE a buy, retaining my previous $700/share target in doing so. Any pullbacks within trend are buying opportunities on weakness in my view.
For further details see:
Chemed: Continues To Compound Shareholder Value At Double-Digit Returns