CQP - Cheniere Energy Partners: A Balanced Opportunity With Long-Term Potential
2023-10-23 04:02:56 ET
Summary
- Cheniere Energy Partners has secured a long-term contract with BASF to supply LNG, ensuring a stable revenue stream for the next two decades.
- The company reported strong financials with over $1.933 billion in revenue and a consolidated adjusted EBITDA of $757 million for the most recent quarter.
- The stock is currently fairly valued, with both upside and downside potentials, making a 'Hold' decision recommended.
- The company has raised its dividend for 6 consecutive years.
Investment Thesis
Cheniere Energy Partners (CQP) presents an investment case marked by both growth prospects and challenges. The company has secured a long-term contract with BASF to supply 800,000 metric tons of LNG per year until 2043. This contract essentially locks in a stable revenue stream for the next two decades. The company reported a consolidated adjusted EBITDA of $757 million for the most recent quarter and offers a forward dividend yield of 7.93%.
In valuation, the Last Twelve Months ((LTM)) EBITDA multiple for CQP stands at 6.8x, which is relatively modest when considering the range of multiples in the sector, which goes from a low of 4.6x to an extraordinarily high of 578.8x. A selected LTM EBITDA multiple range of 6.7x to 7.4x suggests a slight upside in valuation, but not by much.
Taking all these factors into account, the stock currently seems to be fairly valued, with both upside and downside potentials. The existing long-term contracts and high dividend yield make it a stable but not spectacular investment. Therefore, based on the current evidence and numerical data, a 'Hold' decision is recommended.
Overview
Cheniere Energy, a U.S.-based liquefied natural gas company, is making significant strides in the energy sector. Their growth is fueled by a variety of factors, including a recent deal to supply 800,000 metric tons of LNG per year to BASF, a German company, until 2043. This long-term contract essentially guarantees a stable revenue stream for Cheniere for the next two decades. Further, 85% of total product capacity is under long-term contracts.
The company reported over $1.933 billion in revenue and a consolidated adjusted EBITDA of $757 million for the most recent quarter. Further, they offer a forward dividend yield of 7.93% .
The company is aggressively expanding its production capacity, and its LNG has reached new countries like Colombia, Israel, and Panama, so they're expanding globally. For instance, the Sabine Pass liquefaction project in Louisiana is under development to handle as much as 20 million tons per year of total LNG capacity. This aligns perfectly with their business strategy of meeting the rising global demand for LNG, especially in Asia, where demand for LNG has remained strong. Compared to other companies in the LNG industry, they're keeping pace, especially in Asia, where the demand for LNG shot up by 12 million tons in the first half of 2018 alone. In fact, the market in Asia is booming, with China alone seeing a more than 50% increase in LNG demand in the first half of 2018 compared to 2017. This trend is expected to continue, thanks to environmental policies that favor cleaner energy sources like LNG over coal. Cheniere aims to capitalize on this by not only securing long-term contracts with companies like BASF but also with Equinor in Norway, Korea Southern Power, and China's ENN Natural Gas.
Cheniere is also in talks with Taiwan's state-owned oil and gas company, CPC, for another long-term, 25-year deal. Although this is a non-binding agreement at the moment, it's a forward-looking strategic move that could further diversify its customer base and reduce dependence on any single market.
However, the company does face some risks. For instance, the company faced some operational downtime at their Sabine Pass facility, specifically for a component known as "Train 3." While this could impact short-term revenue, there's no evidence to suggest that it's an ongoing issue. The ongoing trade tensions between the U.S. and China could impose tariffs on U.S. LNG exports, which would significantly impact Cheniere's business, given China's growing appetite for LNG. Moreover, there are contractual risks tied to the financial stability of their long-term partners, like BASF and PetroChina. Any alteration or dissolution of these contracts could adversely affect Cheniere's guaranteed revenue streams.
Regulatory approvals for expansion projects also pose a challenge, and the capital-intensive nature of these projects means that changes in interest rates could affect the company's financial stability. Operational risks like maintenance outages can lead to downtime and lost revenue. Despite these challenges, Cheniere's focus on long-term contracts and its financial strength suggest that it's well-prepared to navigate these risks. The company's diversified customer base and the upward trend in global LNG demand make it a potentially good long-term investment. The company's strong financials, strategic long-term contracts, and aggressive global expansion position them well for the future, but one must keep an eye on geopolitical and other risks that could rock the boat.
Revenue Analysis
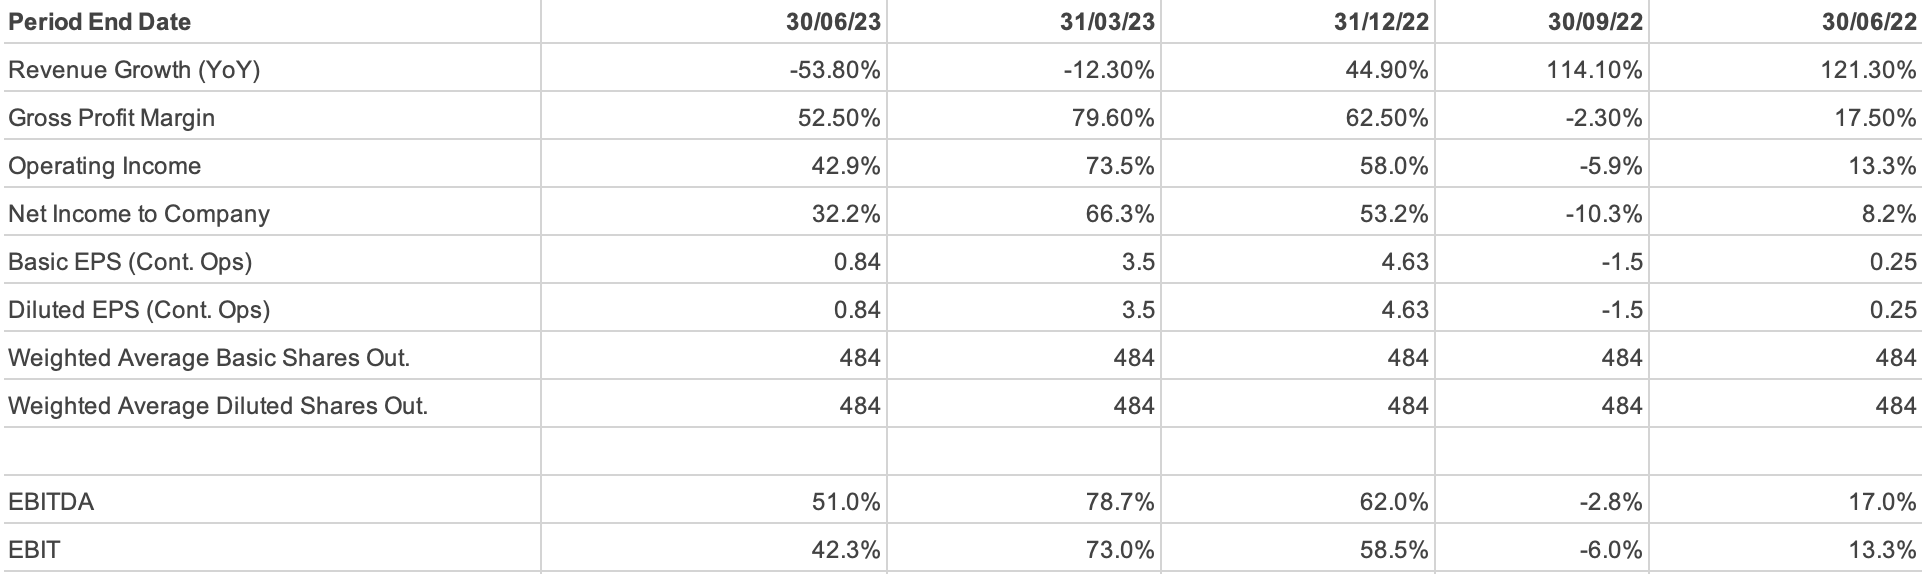
When we look at the financials for the three months ending June 2023 compared to the same period in 2022, the revenues declined from $4,181 million to $1,933 million, a contraction of about 53.8%. When we extend to six-month comparison ending June 2023 versus 2022, the revenues still fell from $7,509 million to $4,850 million, a decline of around 35.4%.
While revenues are plummeting, the net income increased. In the quarter ending June 2023, net income leapt from $342 million to $622 million, growing by about 81.9%. For the half-year, it went from $501 million to $2,557 million, an increase of around 410.2%.
The Net Profit Margin grew from 8.2% in Q2 2022 to 32.2% in Q2 2023. For the half-year, it went from 6.7% in 2022 to 52.7% in 2023. This indicates better cost management. The Operating Margin grew from 13.3% in Q2 2022 to 42.3% in Q2 2023. These numbers suggest that the company is becoming efficient.
The quality of these earnings might be questionable. When revenues are falling, but profits are rising. Looking ahead, if these trends hold, the company could be zeroing in on cost-cutting and efficiency to keep those profits high, which is smart but not a long-term solution if revenues keep shrinking.
Given the high dividend yield of 7.93% and the $1.03/share quarterly dividend, it's likely that the company will continue to attract income-focused investors. Assuming no major disruptions, the dividend payouts are likely to remain stable.
Now, about risks and red flags. The company is heavily reliant on Liquified Natural Gas, which accounts for 97% of revenues. Plus, with ongoing U.S.-China trade tensions, geopolitical factors could play a role in future revenue and contracts. The LNG market's strong demand in Asia is beneficial, but any economic slowdown in key markets like China and South Korea could have a negative impact. The company also earns from regasification and other sources, but these are significantly less compared to LNG revenues. Diversification could be a key strategy for Cheniere moving forward.
In conclusion, while the company's net income is promising, the declining revenue is a red flag.
Balance Sheet Analysis
The cash and cash equivalents for Cheniere Energy increased by over 100%, going from $904 million as of December 31, 2022, to $1,834 million by June 30, 2023. This is a strong indicator that the company can meet its short-term obligations. The current assets increased from $2,620 million to $2,793 million, also showing a positive trend. During the same period, current liabilities also rose by 21%, from $2,421 million to $2,932 million. Long-term debt saw a slight decrease of around 3.7%, falling from $16,198 million to $15,595 million. The partners' deficit improved substantially, moving from -$2,131 million to -$1,046 million, marking a 50.9% reduction. However, the partner deficit still indicates a negative equity.
Looking ahead, if current trends continue, a 20-30% increase in cash and cash equivalents could be expected over the next year. Conversely, if the 21% increase in current liabilities persists, a similar rise would be expected for the next year, potentially affecting liquidity. Long-term debt, which decreased by 3.7%, could follow a similar trend, projecting a 3-5% reduction over the next year. The partners' deficit, having improved by 50.9%, could see a further 30-40% improvement in the coming year, assuming no major financial setbacks occur. Although it's still negative, the substantial improvement indicates a move towards better financial stability and possibly a recapitalization.
In terms of financial ratios, the current ratio decreased from 1.08 to 0.95 between the two periods, indicating a slight liquidity concern. The quick ratio showed a minor improvement, going from 0.63 to 0.69. However, the Debt to Equity ratio took a substantial hit, worsening from -8.7 to -17.7, indicating an increase in financial risk due to the company's negative equity, reflected in the partners' deficit.
Regarding the capital structure, the Debt-to-Total Capital Ratio went up from 0.88 to 0.94, suggesting an increasing reliance on debt. The Equity-to-Total Capital Ratio also saw an improvement from -0.12 to -0.06, although it remains negative, indicating that the company's liabilities still exceed its assets.
The 21.1% increase in current liabilities compared to a 6.6% increase in current assets is concerning. This growing gap can lead to liquidity issues. Assuming that the six-month trends continue, we could expect the current assets to increase by about 13% and current liabilities by about 42% over the next year. This would exacerbate liquidity issues if not managed.
Overall, the financial situation presents a mixed bag: while there's an increase in current assets and a decrease in long-term debt, the increase in current liabilities and a still-negative partners' deficit pose questions about the company's financial health.
Free Cash Flow Analysis
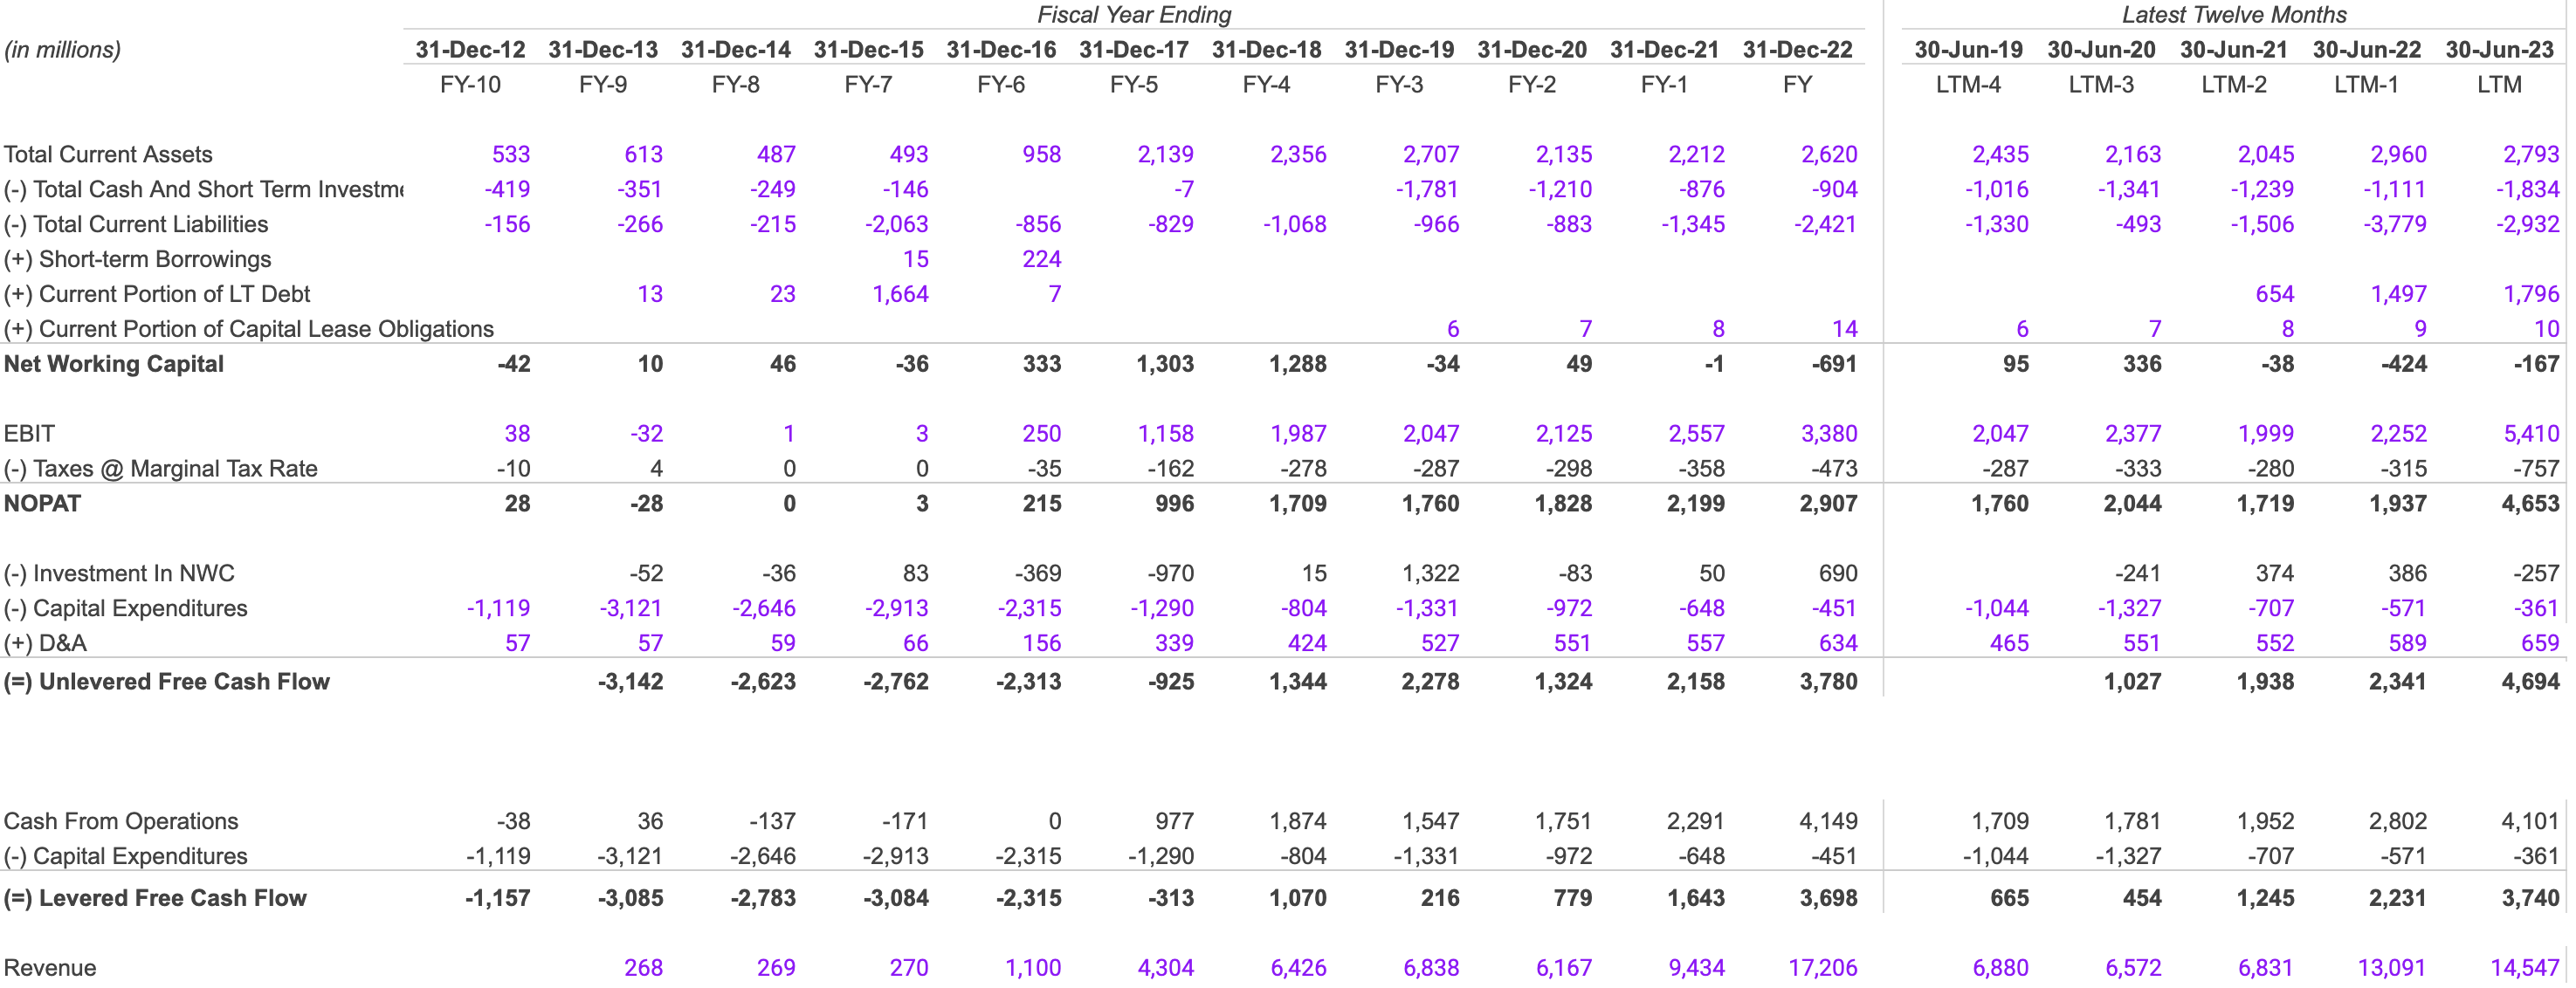
Starting with the balance sheet, the Total Current Assets fell by 5.6% from $2,960M in 2022 to $2,793M in 2023. However, this decrease is offset by a more significant drop in Total Current Liabilities by 22.4%, from $3,779M in 2022 to $2,932M in 2023. As a result, Net Working Capital improved from -$424M in 2022 to -$167M in 2023. The sharp reduction in liabilities coupled with the improvement in Net Working Capital suggests that the company is in better short-term financial health.
The Earnings Before Interest and Taxes (EBIT) increased by 140.2% from $2,252M in 2022 to $5,410M in 2023. Similarly, Net Operating Profit After Tax (NOPAT) surged by 140.1% from $1,937M in 2022 to $4,653M in 2023. This indicates that the company is becoming far more profitable at the operational level.
In the cash flow section, Unlevered Free Cash Flow (UFCF) increased by 100.5% from $2,341M in 2022 to $4,694M in 2023. Levered Free Cash Flow (LFCF) followed suit but at a slightly lesser growth rate of 67.6%, moving from $2,231M in 2022 to $3,740M in 2023. These highlight the company's increasing cash generation capacity, providing more financial flexibility.
For a one-year forward-looking forecast, considering the 140% YoY growth in EBIT and NOPAT, a conservative 100% growth estimate for 2024 would place EBIT at around $10,820M and NOPAT at roughly $9,306M. Revenue, with a more modest 11.1% growth from $13,091M in 2022 to $14,547M in 2023, may also see a similar rise, landing it at an estimated $16,143M in 2024.
Shareholder Yield
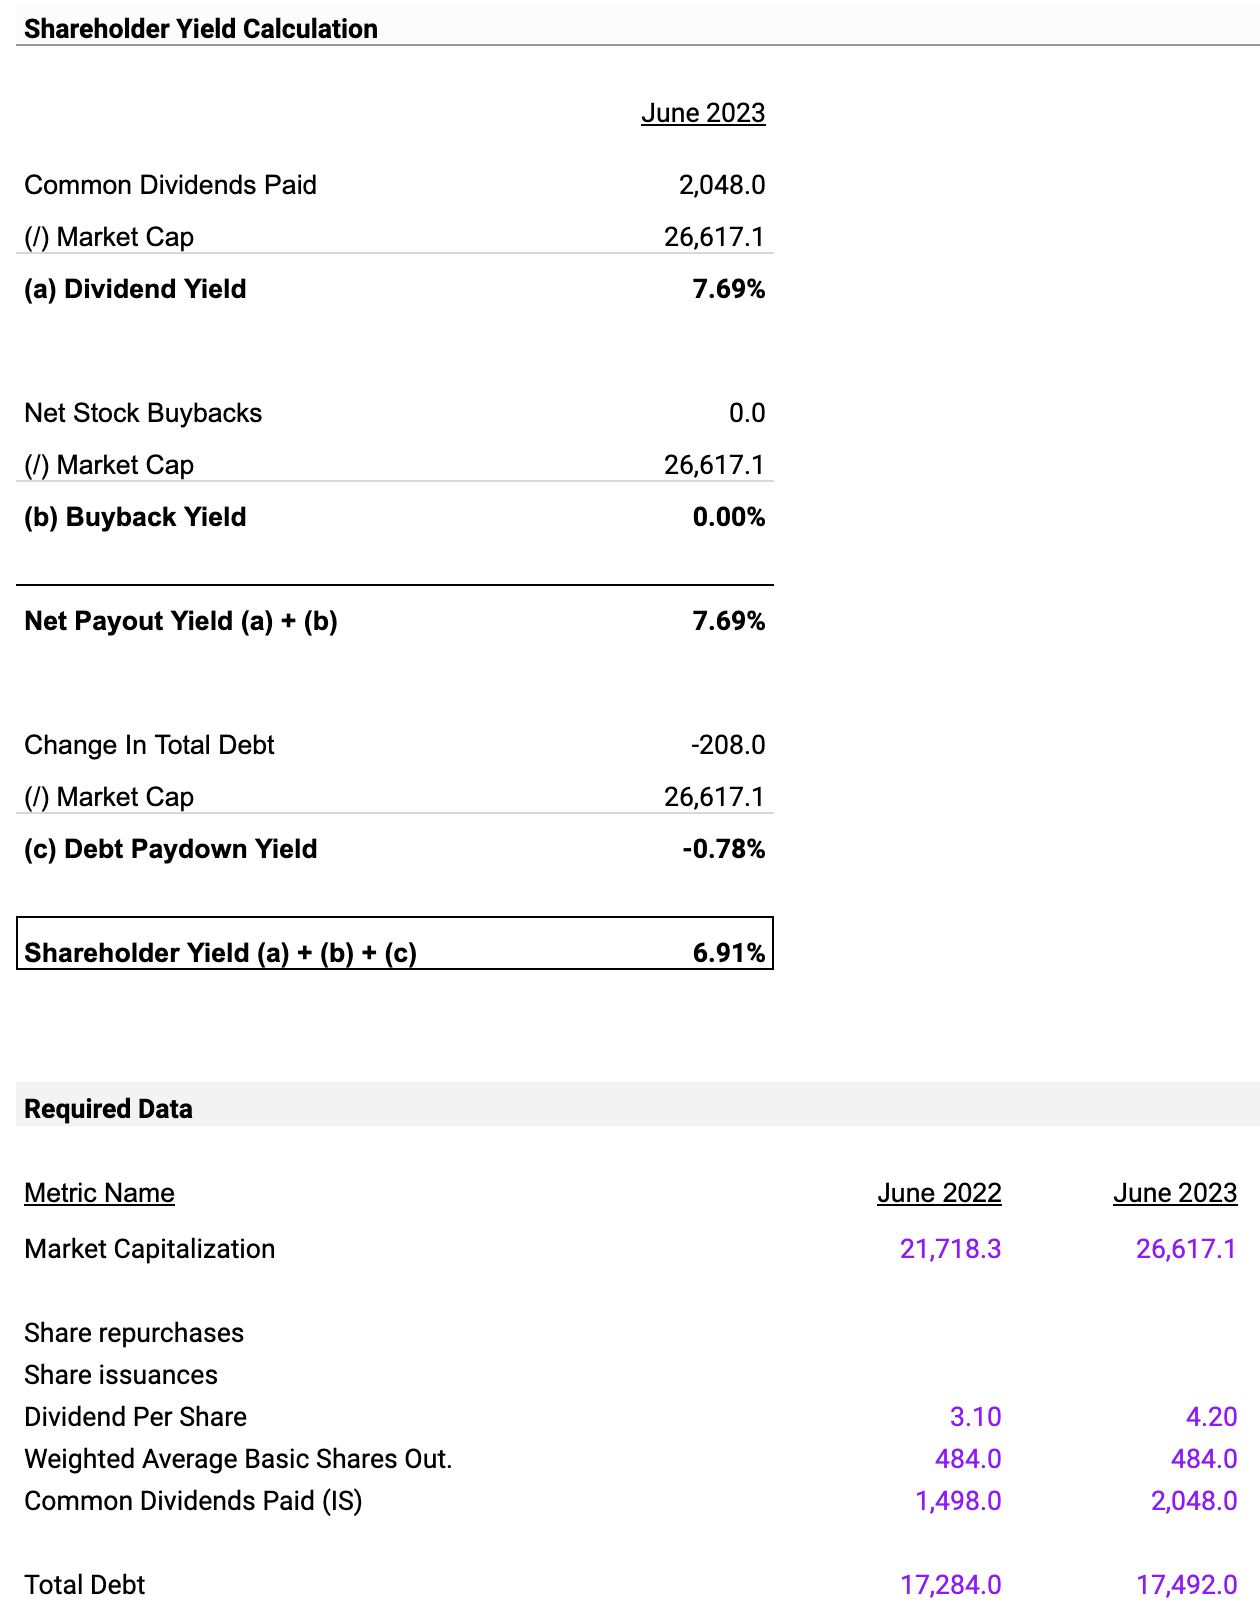
The company has a high dividend yield of 7.69%, calculated by dividing the common dividends paid ($2,048 million) by the market capitalization ($26,617.1 million). This is significantly above the market average, which typically hovers around 2-4%. This high yield signals that the company is actively returning its profits to shareholders, which indicates cash reserves. However, it also raises a red flag because it might suggest limited growth opportunities for reinvestment.
Moving on to the buyback yield, it stands at 0.00%. This is calculated by dividing net stock buybacks ($0) by the market cap ($26,617.1 million). As for the net payout yield, it is 7.69%, derived from adding the dividend yield and buyback yield. This is solely due to the dividend yield since there are no share buybacks.
The debt paydown yield is at -0.78%, determined by dividing the change in total debt (-$208 million) by the market cap. This increase in debt means that the company is financing growth initiatives, which could be positive if those initiatives deliver a higher return on investment than the cost of the debt. When we combine all these metrics—dividend yield, buyback yield, and debt paydown yield—we get a total shareholder yield of 6.91%.
In summary, the company's high dividend yield makes it an attractive short-term buy for those looking for income.
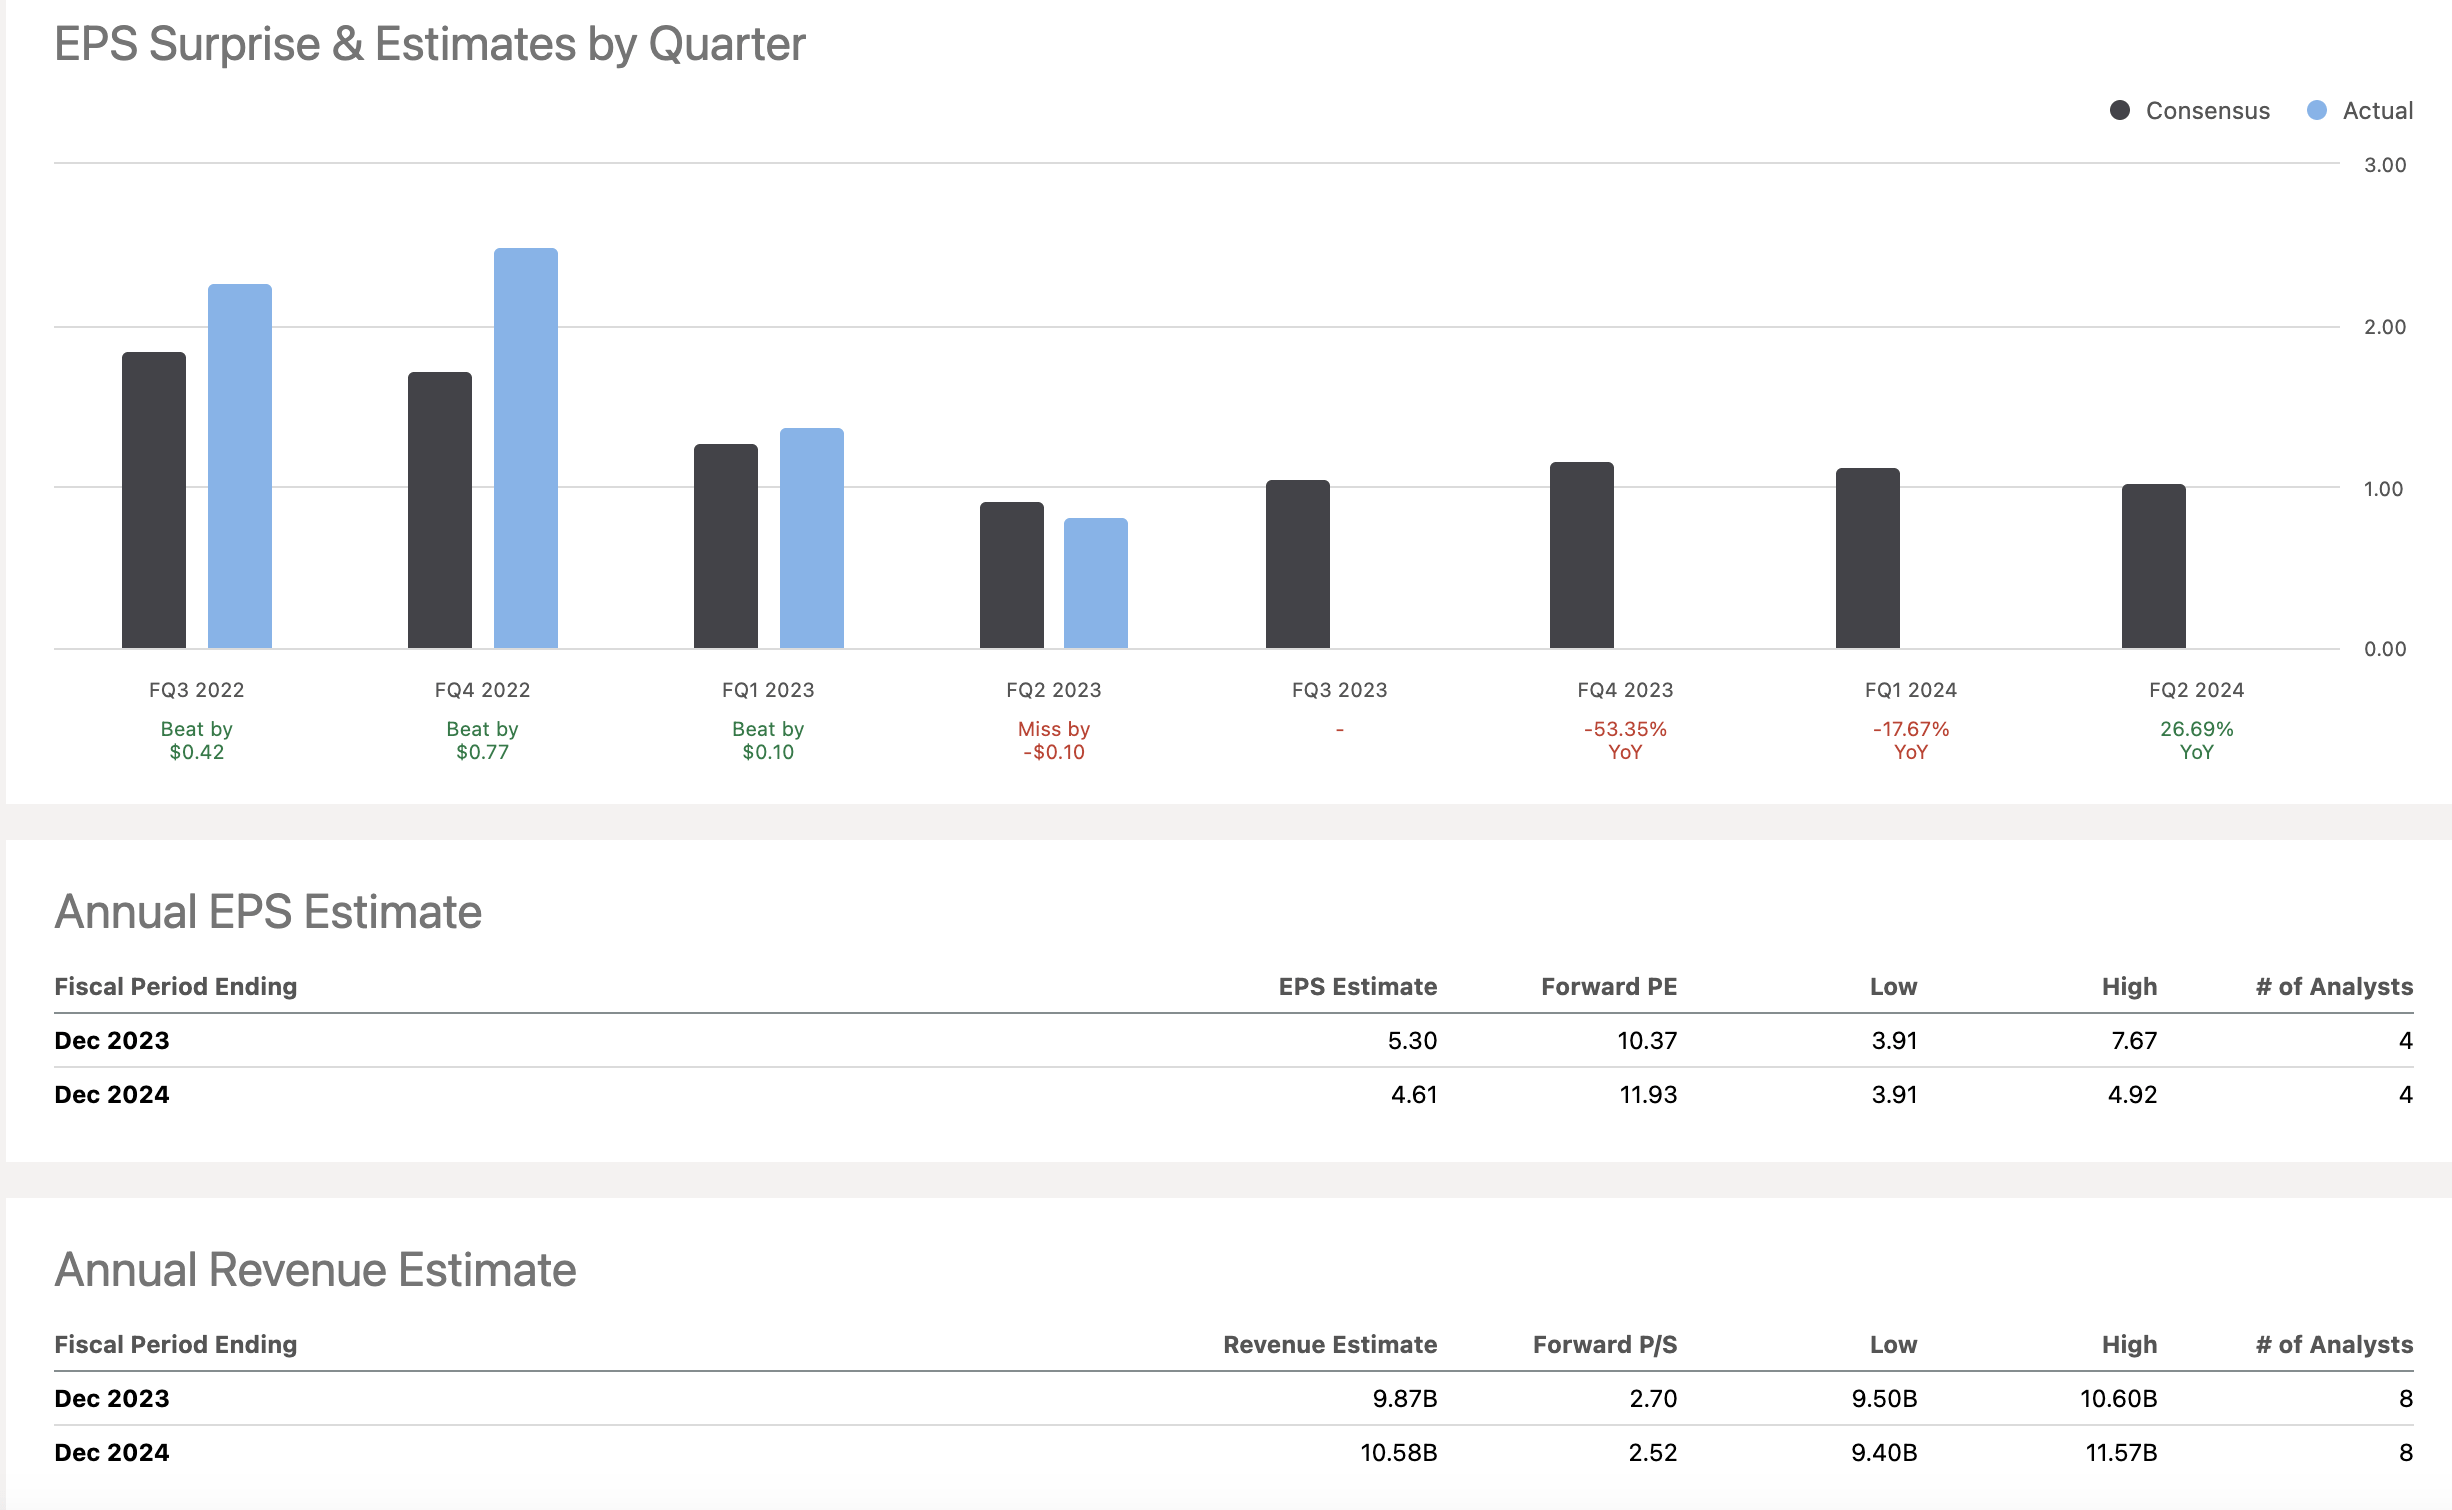
Earnings Preview For September Quarter
In September 2023, based on financial forecasts, both revenue and Earnings Per Share are slated to go up, although with different degrees of consensus among analysts. The median revenue forecast for September stands at $2,234.802 million, slightly above the June figure, with the average forecast also seeing a minor uptick to $2,333.375 million.
Now, focusing on EPS, the number of contributing analysts has reduced from five in June to three in September. This could imply a less unified view, but those who are making projections are distinctly optimistic. The low EPS forecast takes a significant leap from $0.56 in June to $0.93 in September, while the high forecast inches up from $1.1 in June to $1.14 in September. Such shifts in the low and high forecasts demonstrate a growing confidence in the company’s earning potential. Both median and average EPS projections for September are higher than June, $1.1 versus $0.93 and $1.06 versus $0.91, respectively.
In summary, the overall business outlook for September 2023 is positive. Both revenue and EPS are anticipated to climb, albeit with varying levels of analyst consensus.
Valuation
The objective of this valuation is to assess the fair market value of Cheniere Energy Partners, L.P. ( CQP ) stock to determine whether it is undervalued, overvalued, or fairly valued. This assessment will guide investment decisions such as buying, selling, or holding the stock. The valuation methods employed include the Last Twelve Months (LTM) EBITDA multiple and the Projected EBITDA multiple. The focus is on deriving a substantiated and numerical-backed fair value range for the stock.
Benchmark Companies Selection:
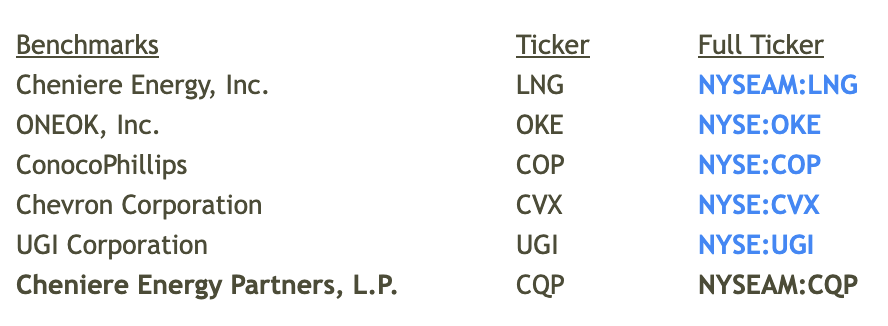
The benchmark companies selected for this analysis include Cheniere Energy, Inc. (LNG), ONEOK, Inc. (OKE), ConocoPhillips (COP), Chevron Corporation (CVX), and UGI Corporation (UGI). These companies operate in the same or similar sectors as Cheniere Energy Partners and have similar business models. This makes them suitable for comparison.
Last Twelve Months ((LTM)) EBITDA Multiple Analysis:
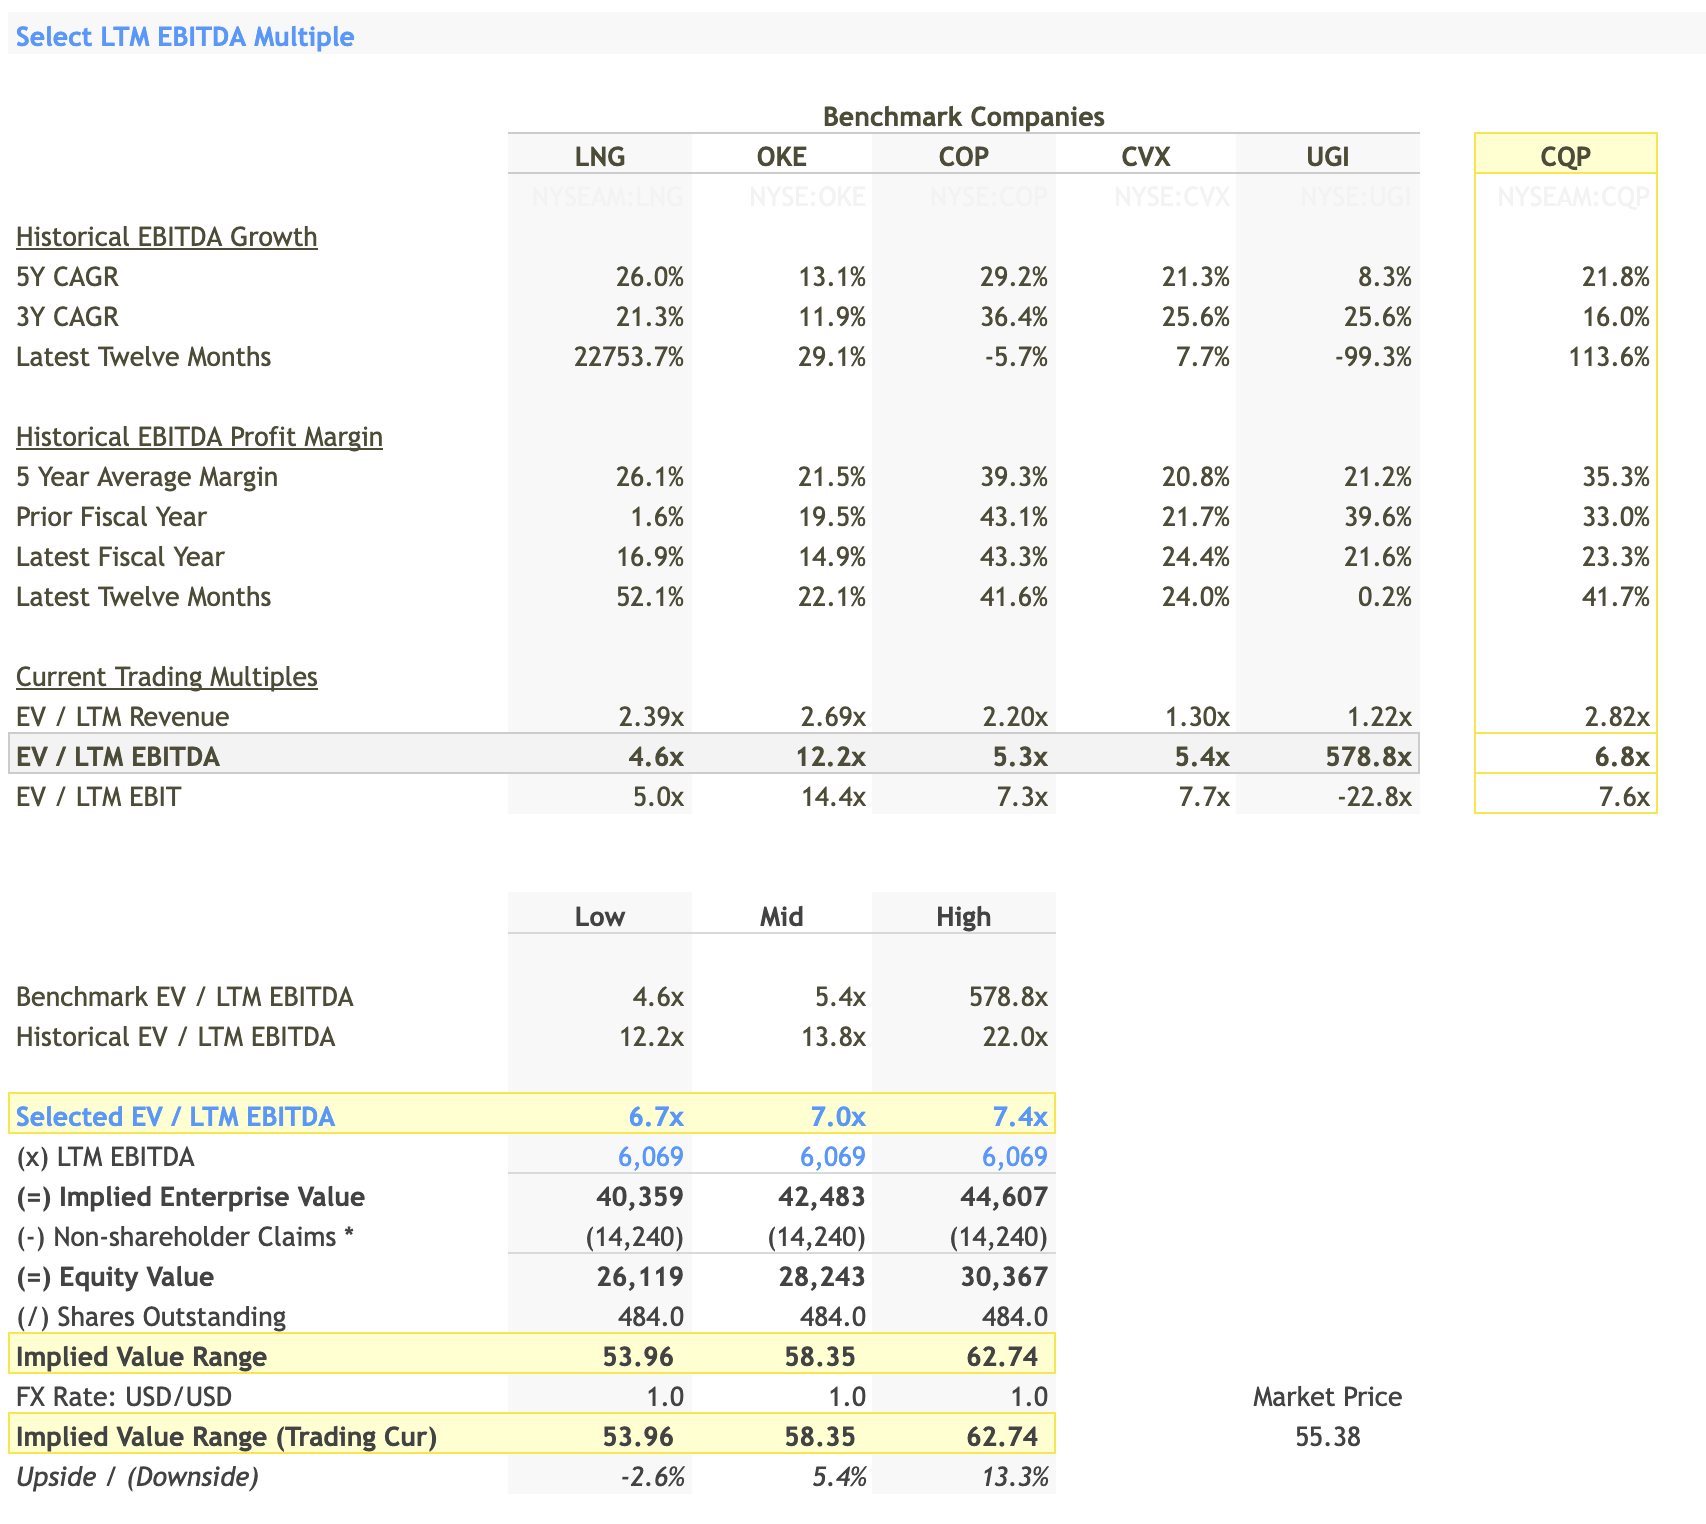
The LTM EBITDA multiples for these benchmark companies range from a low of 4.6x ((LNG)) to an extraordinarily high of 578.8x ((UGI)). This wide range is indicative of various business models and risk profiles in the sector. For Cheniere Energy Partners, the LTM EBITDA multiple stands at 6.8x, which suggests it's relatively modestly valued when you consider the range of multiples in the sector.
Selected Multiple Range:
Based on the industry range, historical performance, and other financial metrics such as EBITDA growth and profit margins, a selected LTM EBITDA multiple range of 6.7x to 7.4x was chosen for CQP. This selected range is a bit above the company's current 6.8x, suggesting that there might be a slight upside in valuation but not by much.
Implied Enterprise Value:
Applying this selected range of multiples to CQP's LTM EBITDA of $6,069 million gives us an implied enterprise value range of $40,359 to $44,607 million.
Equity Value and Implied Stock Price:
To arrive at the equity value, non-shareholder claims (such as debt and preferred shares) amounting to $14,240 million were subtracted from the enterprise value. This resulted in an equity value range of $26,119 to $30,367 million. Dividing this by the number of outstanding shares (484.0 million), the implied stock price ranges from $53.96 to $62.74 per share.
Projected EBITDA Multiple Analysis:
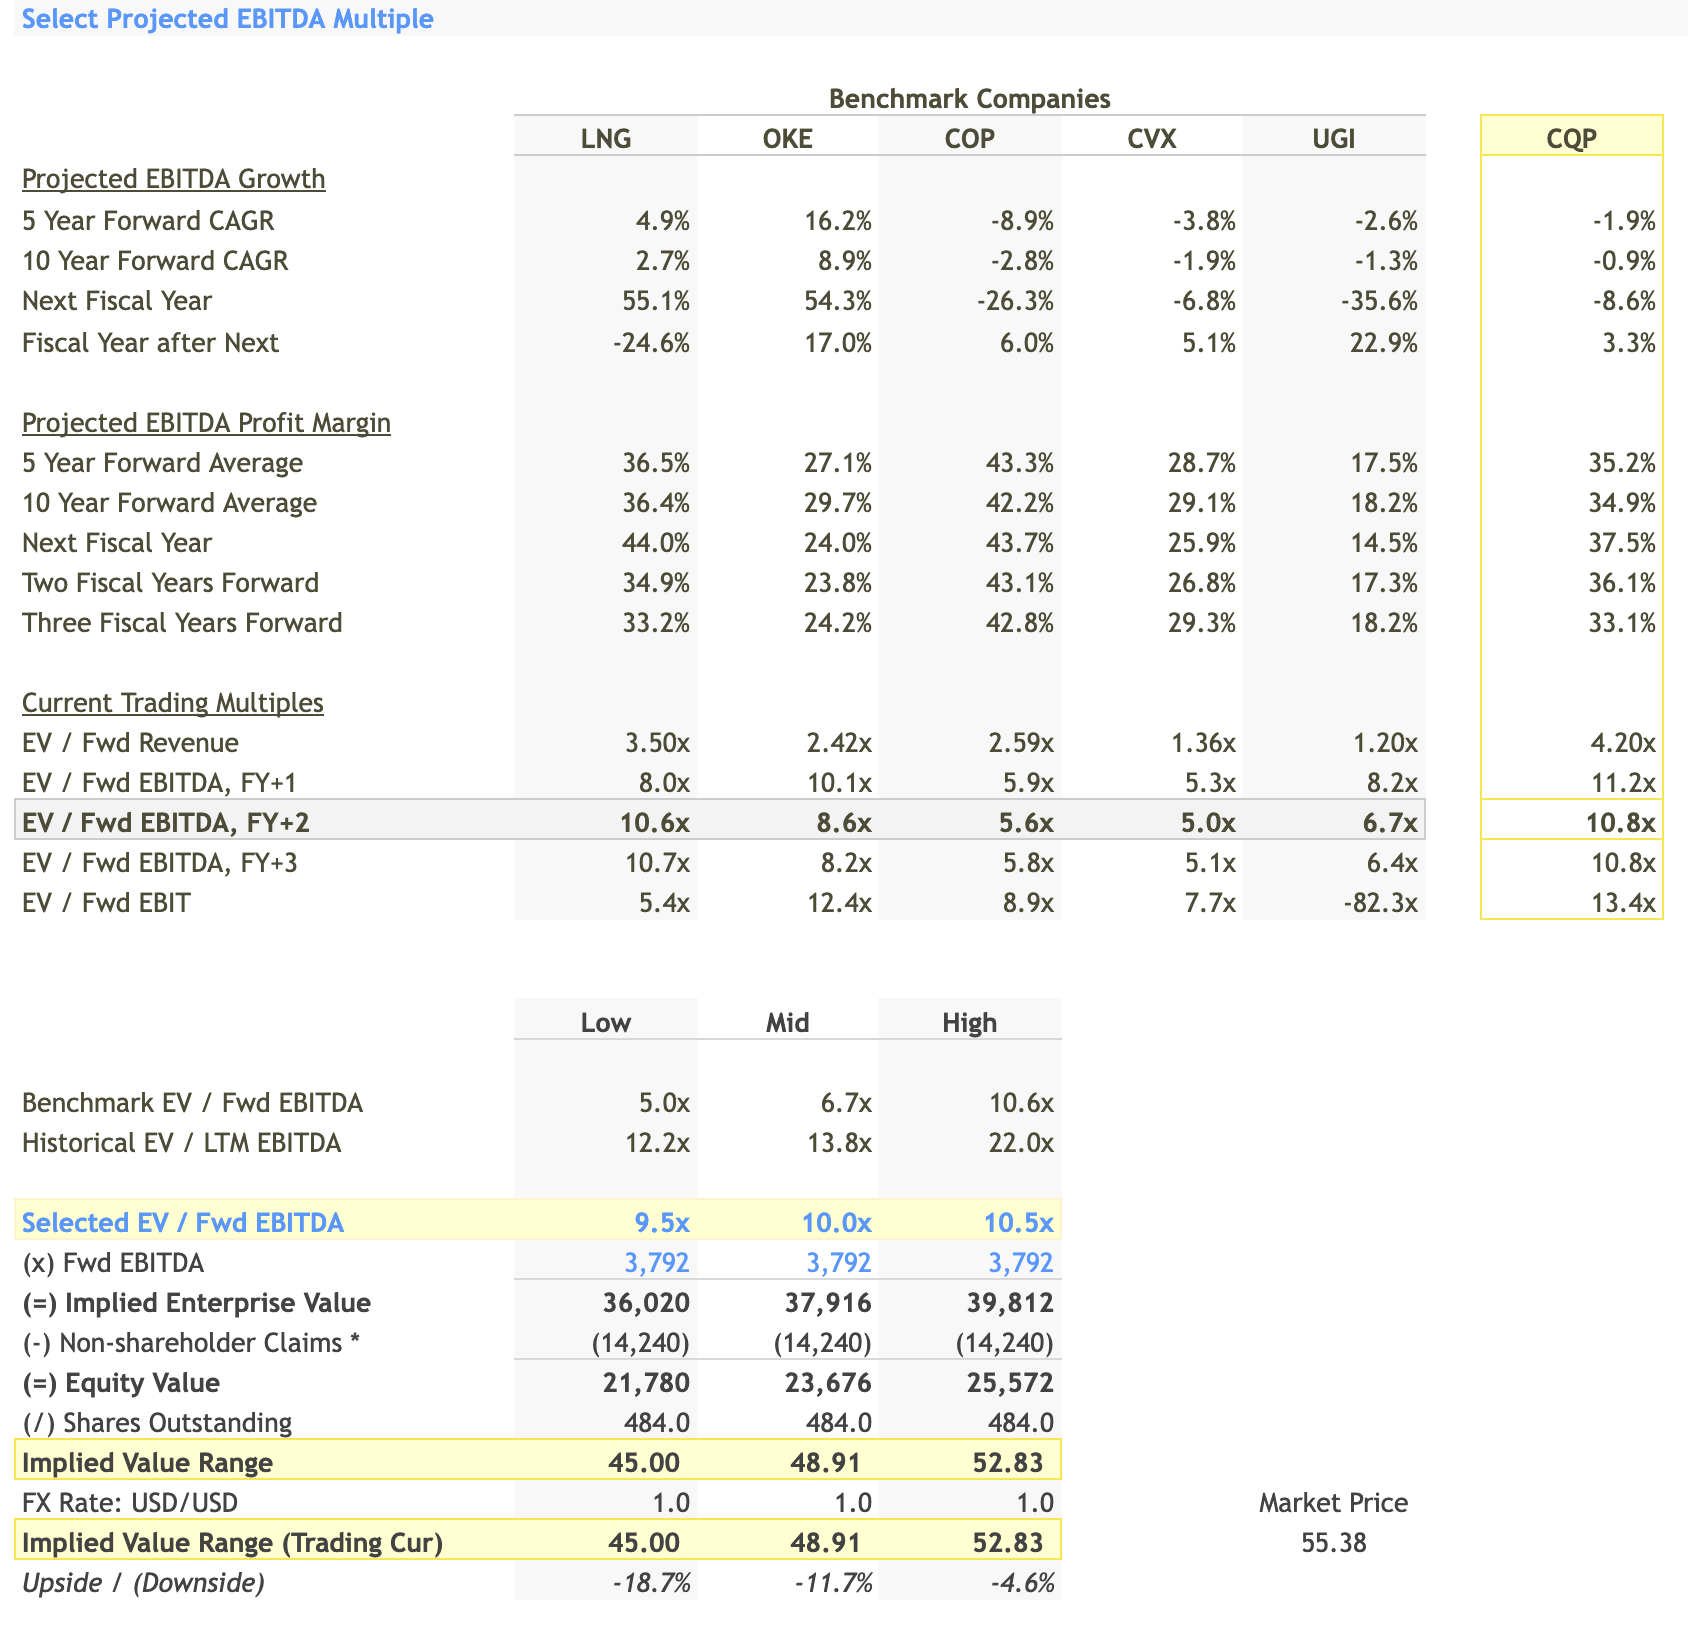
Cheniere Energy Partners is projected to have a 5-Year Forward CAGR (Compound Annual Growth Rate) of -1.9%, and a 10-Year Forward CAGR of -0.9%. These negative rates suggest that the company's operational earnings are expected to decline slightly over the next 5 and 10 years, which needs to be factored into the valuation.
Considering the projected EBITDA growth rates and the multiples at which similar companies are trading, a selected projected EBITDA multiple range of 9.5x to 10.5x was chosen for CQP. This is significantly higher than its current EV/LTM EBITDA multiple of 6.8x, reflecting the added risk of a declining EBITDA in the future.
Using the projected EBITDA for the next fiscal year ($3,792 million) and the selected multiple range, the implied Enterprise Value for CQP ranges from $36,020 to $39,812 million.
Subtracting non-shareholder claims of $14,240 million from the implied Enterprise Value gives an Equity Value range of $21,780 to $25,572 million. Dividing this by the number of shares outstanding (484.0 million), the implied stock price comes out to a range of $45.00 to $52.83.
Fair Value Range:
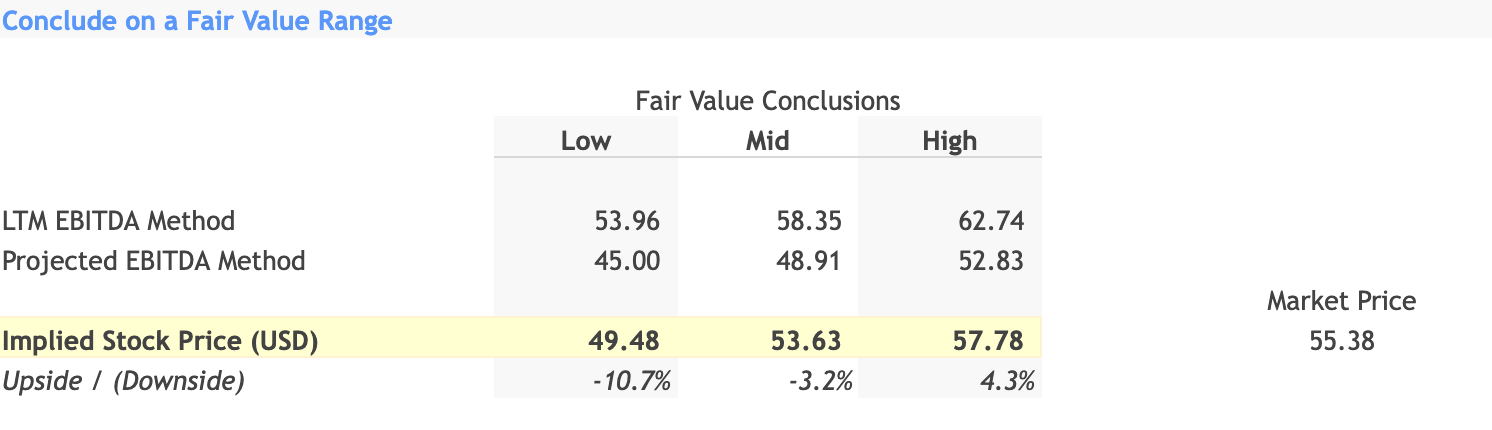
Combining both methods, the overall implied stock price range can be set between the lowest value from the LTM method ($53.96) and the highest value from the projected method ($52.83). This translates into a consolidated fair value range of $45.00 to $62.74.
Conclusion and Investment Recommendation:
Based on the consolidated fair value range, the implied stock price for CQP stands between $45.00 and $62.74. Considering the current market price of $55.38, the stock seems to be fairly valued, falling within the fair value range. However, the stock shows both upside and downside potentials of 4.3% and -10.7%, respectively.
Given this analysis, a 'Hold' decision is recommended. Investors currently holding the stock should continue to do so but should exercise caution and regularly monitor both the company's financials and broader industry trends.
For further details see:
Cheniere Energy Partners: A Balanced Opportunity With Long-Term Potential