CHI - CHI: Convertibles CEF Paying More Than It Earns
Summary
- Calamos Convertible Opportunities & Income Fund focuses on convertibles and high yield investments.
- The closed-end fund has a current yield of 9.8% on market price and 10.9% on NAV.
- However, with 5Yr average annual total returns of only 7.0%, it appears the CHI fund is paying more than it earns. This leads to long-term shrinking NAV and declining distributions.
The Calamos Convertible Opportunities & Income Fund ( CHI ) is a convertibles-focused closed-end fund ("CEF") that has been around since 2002. The fund has generated modest long-term historical average annual returns. My main concern with CHI is its distribution rate at 10.9% of NAV, which appears high relative to the fund's historical 5Yr average annual returns of 7.0%. This earnings shortfall leads to long-term shrinking NAV, which makes future distributions less sustainable and can lead to distribution cuts.
Fund Overview
The Calamos Convertible Opportunities & Income Fund is a closed-end fund that seeks high current income and capital appreciation from a diversified portfolio of convertible securities and high yield bonds.
The fund aims to invest at least 80% of assets in convertible and non-convertible income producing securities. The CHI CEF may use leverage to enhance returns.
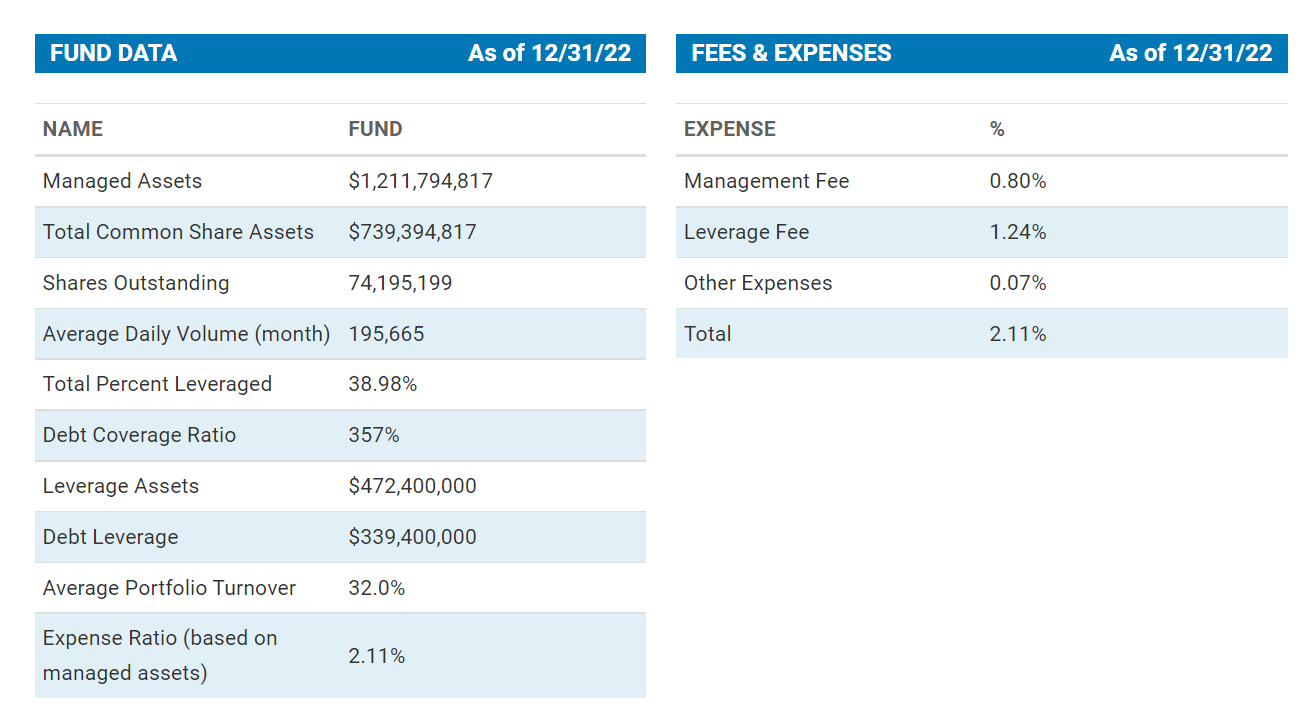
The CHI fund is one of the larger CEFs in the market, with $740 million in net assets and $1.2 billion in managed assets. The fund charges a 0.8% management fee and 2.11% total expense ratio (Figure 1).
Convertibles Can Provide Equity-Like Returns In Bull Markets And Bond-Like Protection In Bear Markets
Convertible securities combine characteristics of common stocks and traditional fixed income securities like bonds and preferred shares. Typically, a convertible security is a bond that can be converted into a certain number of common shares of the issuer. The "conversion ratio" is usually set at the time of issuance, and the securityholder can choose to convert at their option.
Like stocks, convertible securities offer upside appreciation in equity bull markets because, as stock prices rise above the security's conversion price, the securityholder can "convert" and obtain common shares.
Like bonds, convertible securities typically offer a stated interest yield, and may provide less downside during equity bear markets, as the security continues to pay interest and have a higher claim to the company's assets than common equity holders.
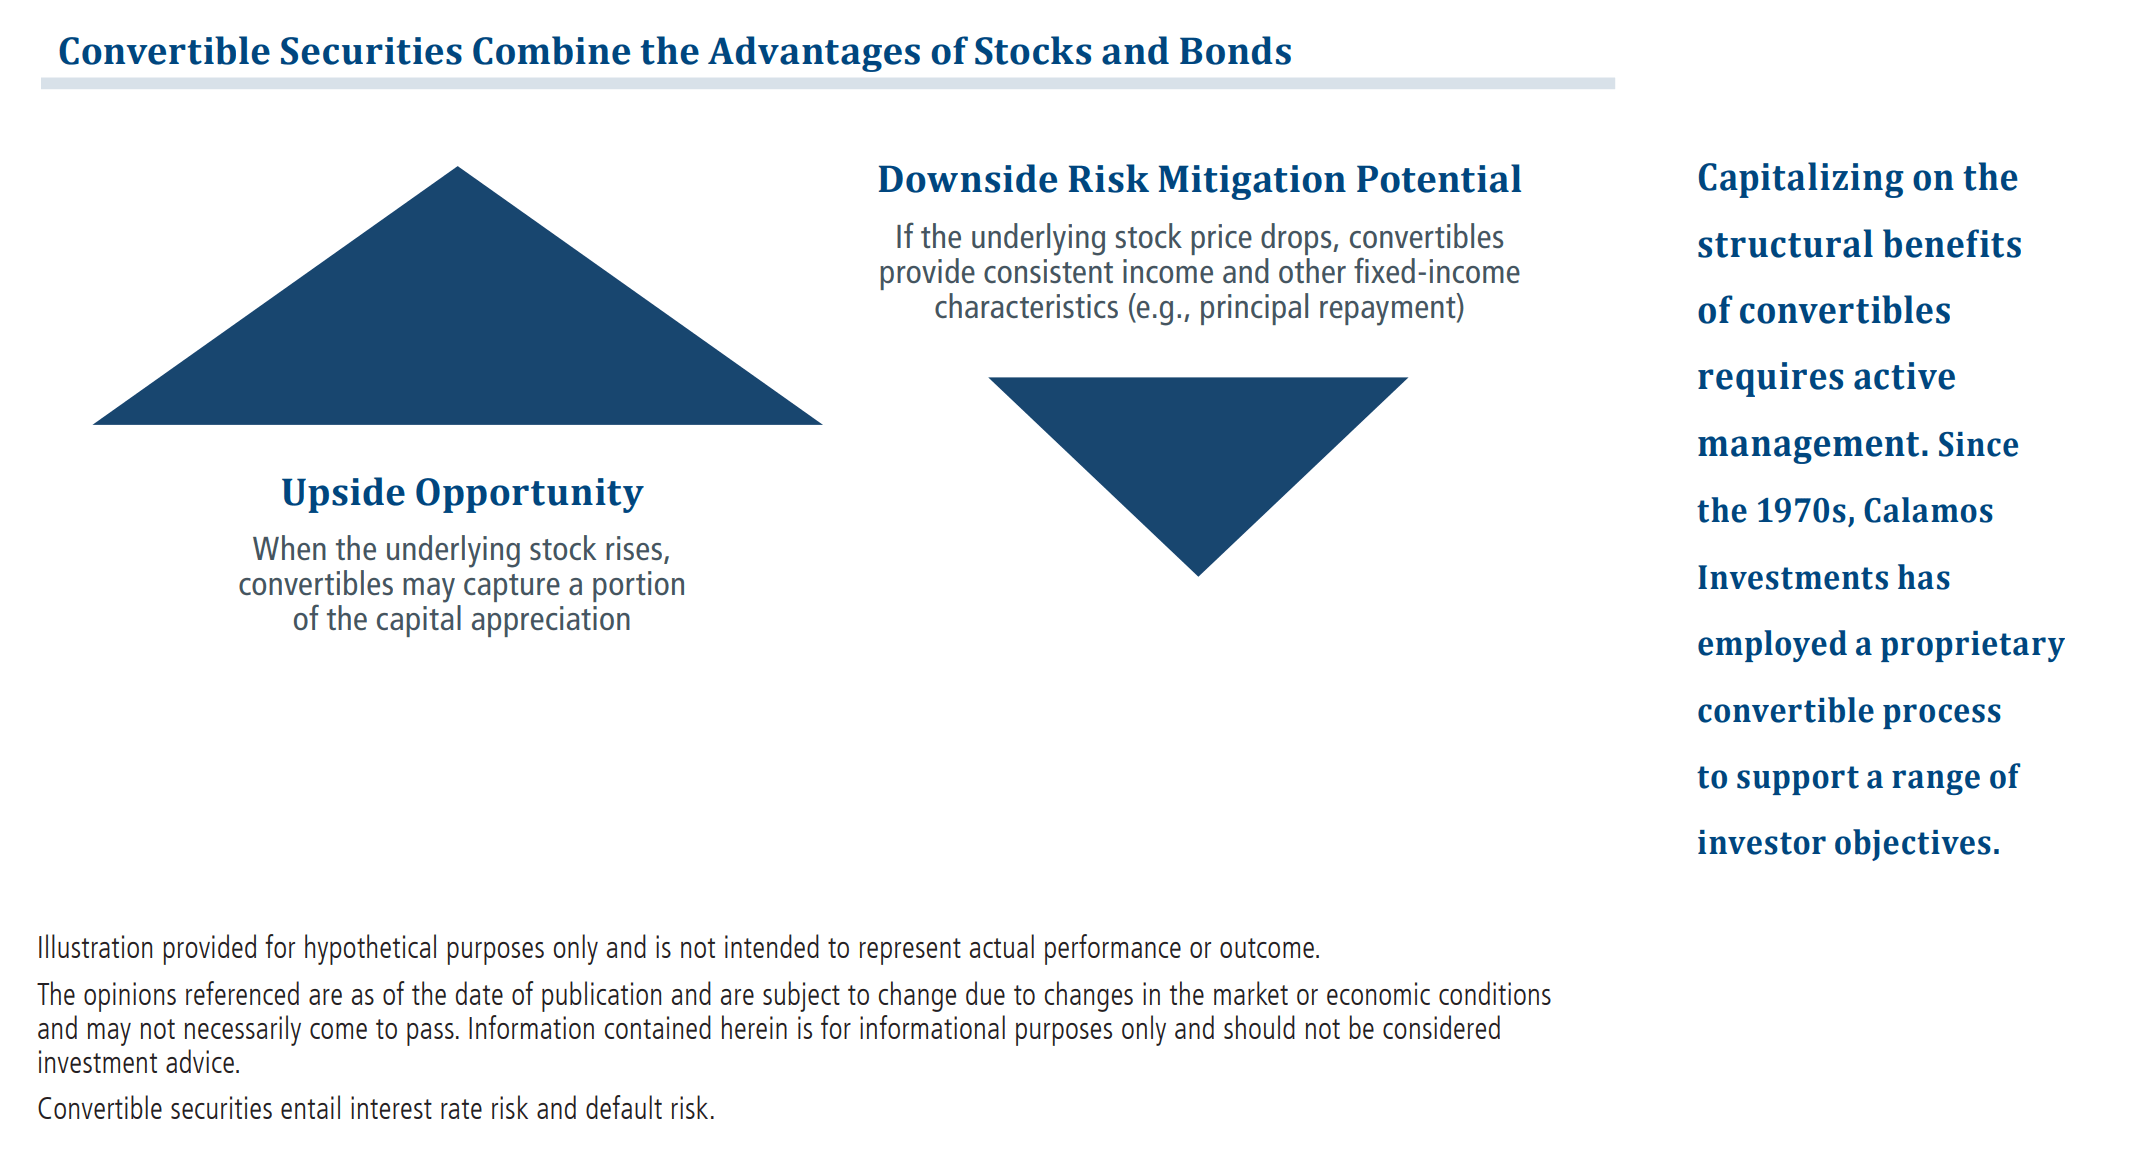
According to Calamos' marketing documents, convertibles combine the advantages of both stocks and bonds and can be a useful portfolio diversification tool (Figure 2).
Figure 2 - Convertible securities combine advantages of stocks and bonds (Calamos marketing brochure)
Compared to traditional bonds, convertible bonds typically carry lower interest rates because the "option" to convert into common stock is valuable. For the issuer, this allows them to raise capital at a lower fixed carrying cost than traditional bonds, although the tradeoff is potential share dilution. For convertible investors, they are willing to accept a lower interest coupon, because they can participate in the "equity upside" if the company does well.
One way to think about convertible bonds is to consider them as a combination of a traditional bond plus a call option on the issuer's stock. The call option provides the "equity-like" upside, while the traditional bond piece provides the "bond-like" downside protection.
Portfolio Holdings
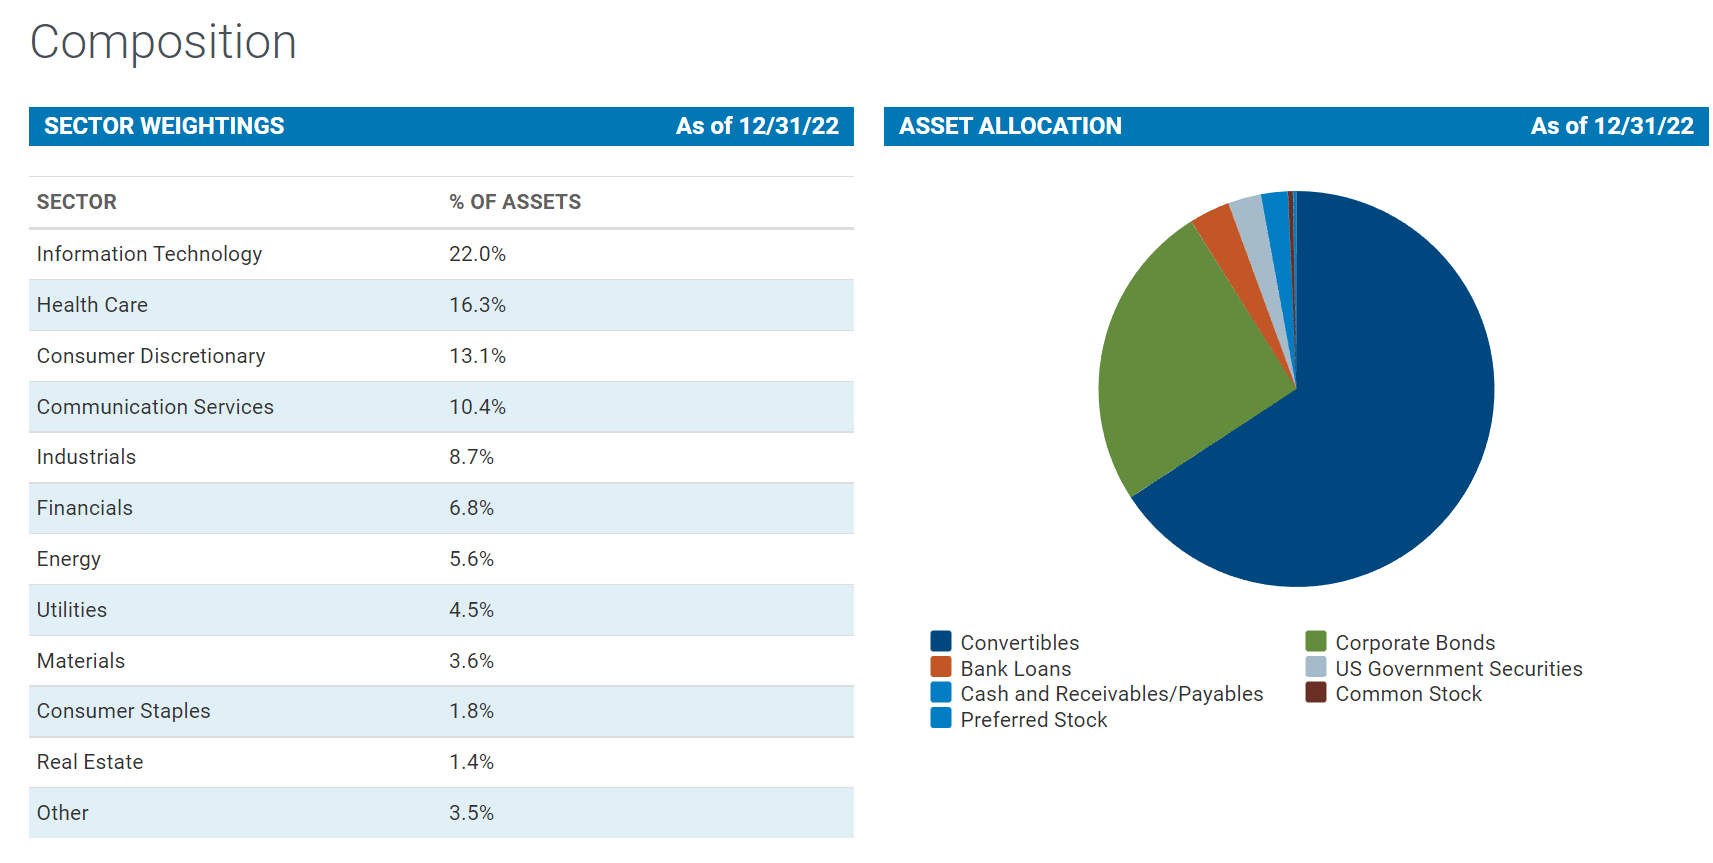
Figure 3 shows the CHI fund's sector and asset allocation. The fund is broadly diversified by sector exposure, with technology (22%), healthcare (16%), and consumer discretionary (13%) being the biggest sector weights.
Figure 3 - CHI fund sector and asset class allocations (calamos.com)
66% of the fund's assets are invested in convertibles and 25% is invested in corporate bonds. The fund also holds small weights in senior loans and treasuries.
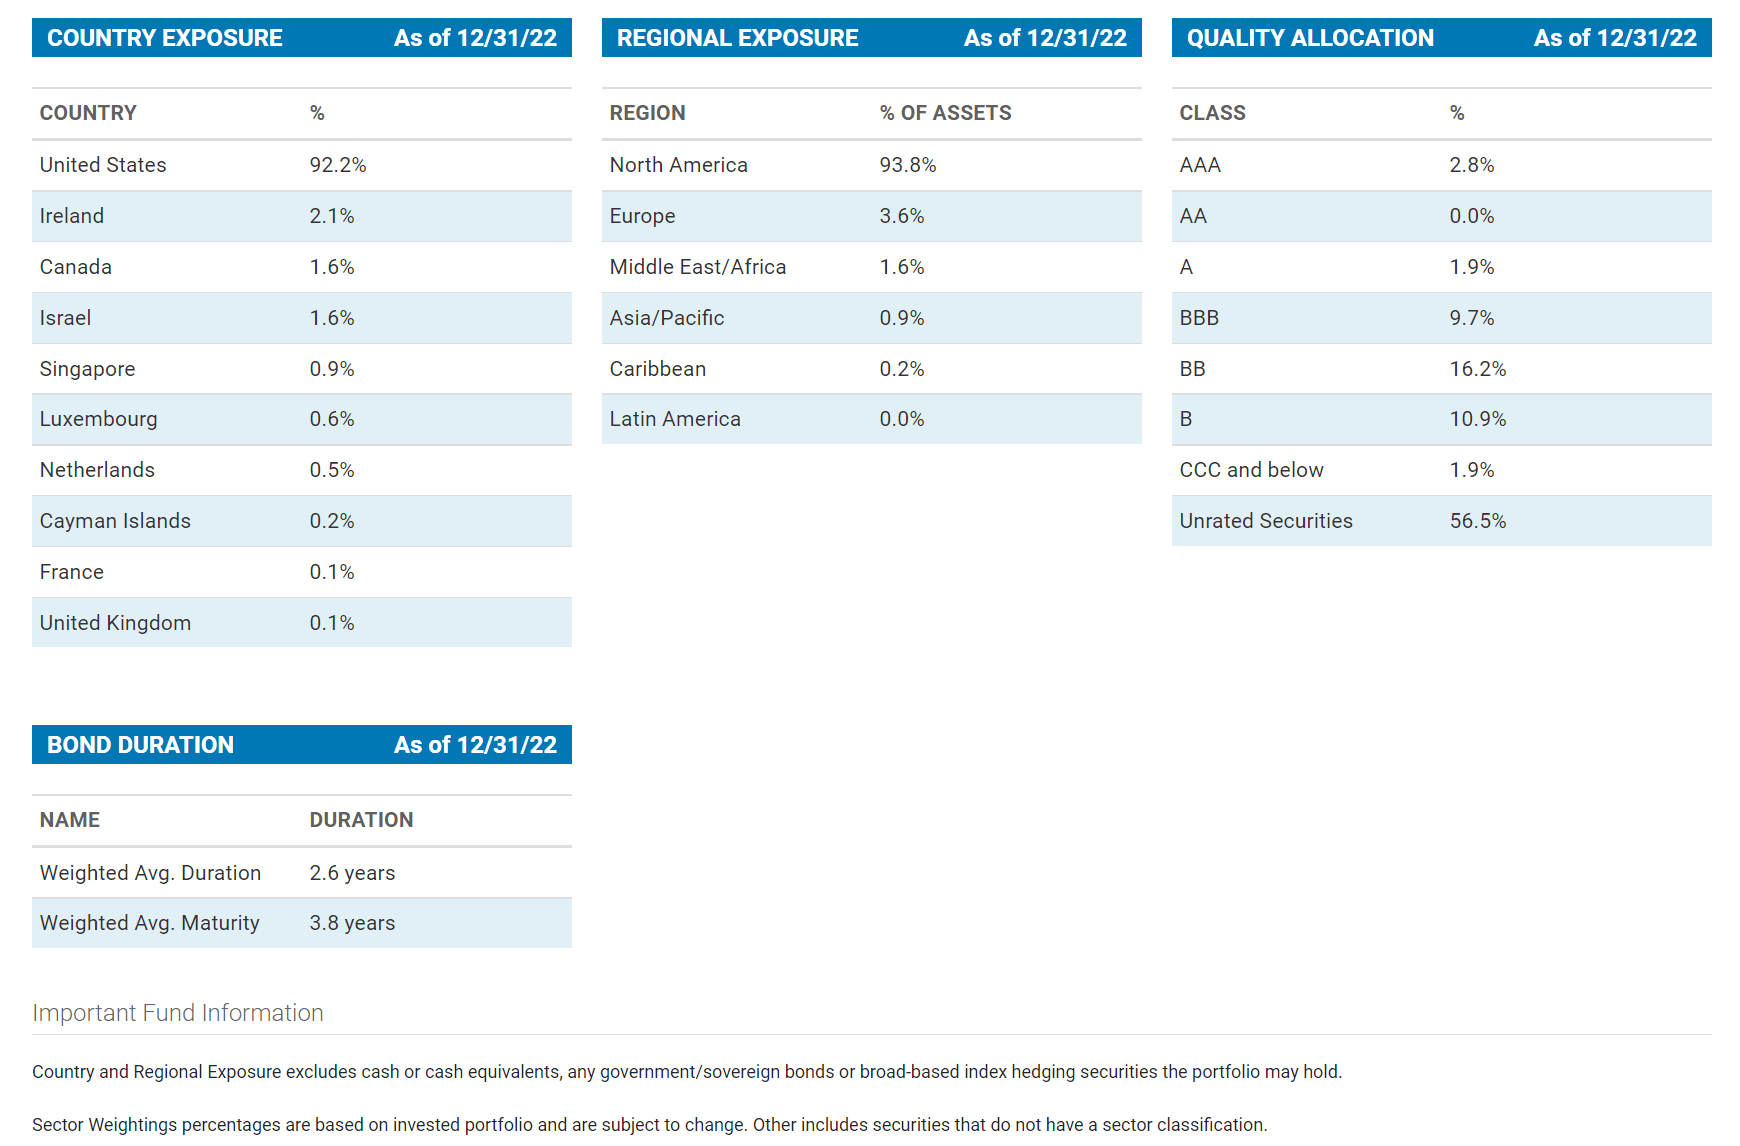
Figure 4 shows the fund's geographical exposure and credit quality allocation. The CHI fund is mostly invested in domestic U.S. securities. Given that most convertible securities are unrated, we can deduce that CHI's corporate bond exposure are mostly high-yield ("junk") bonds that are rated below BBB.
Figure 4 - CHI fund geographical and credit quality allocations (calamos.com)
Returns
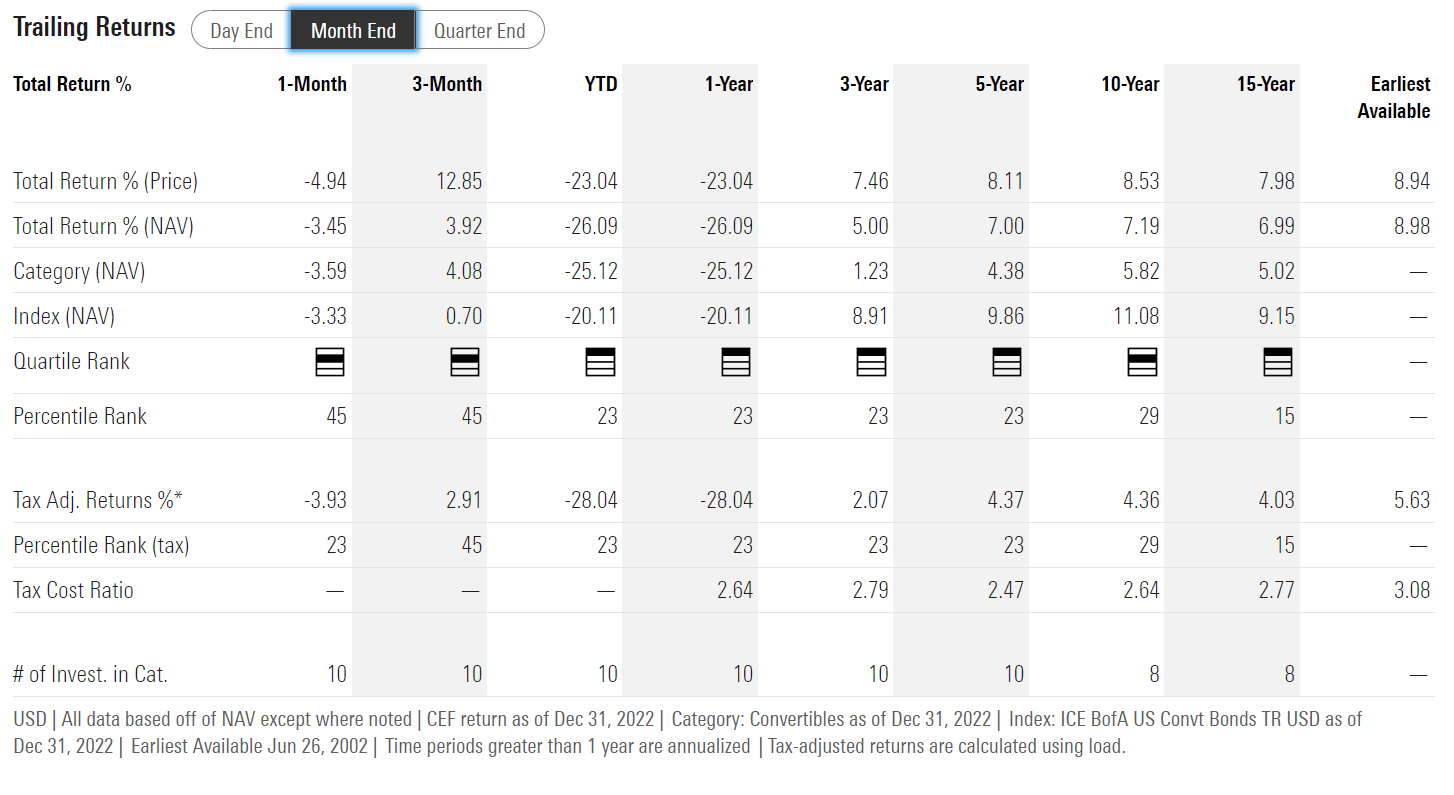
The CHI fund has delivered modest long-term historical returns, with 3/5/10Yr average annual total returns of 5.0%/7.0%/7.2% respectively. 2022 was a bad year, with the CHI fund returning -26.1%, as both equity and bond markets had down years (Figure 5).
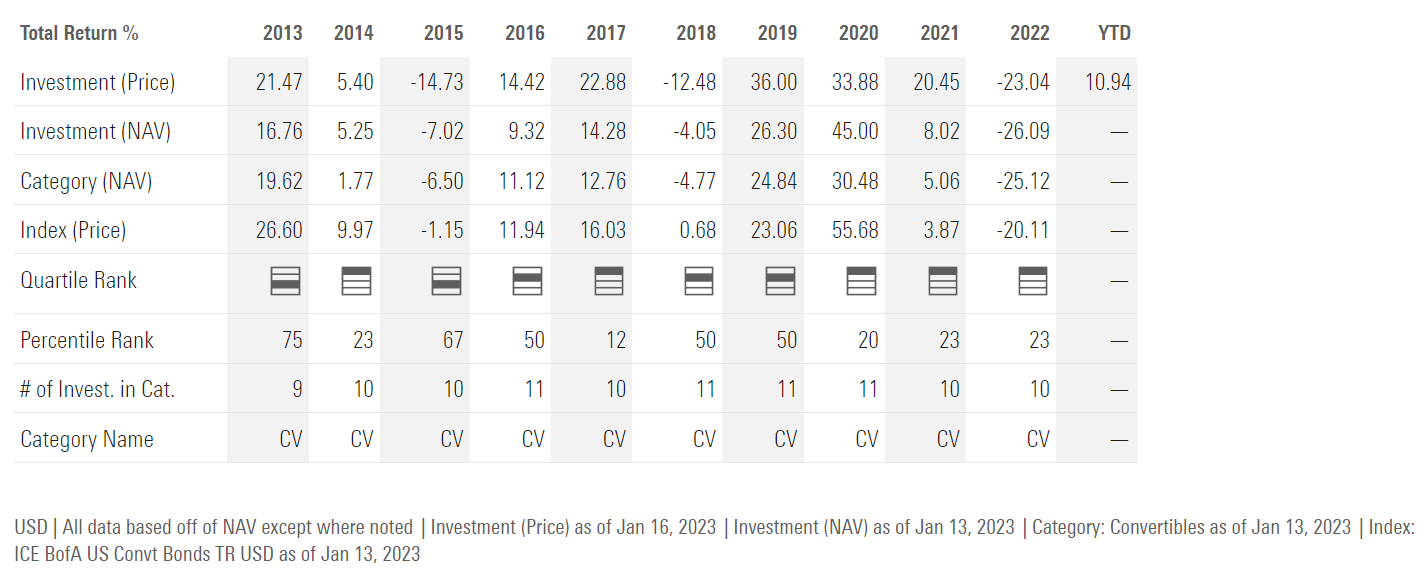
On an annual basis, we can see that CHI's performance generally tracks the equity markets. When equity markets perform well, the CHI fund does well due to the equity-like returns of convertible securities (Figure 6).
The annual performance of the SPDR S&P 500 Trust ETF (SPY) is shown in figure 7 below as reference.
However, the downside protection claim of Calamos referenced in figure 2 above appears to hold less water, judging by the CHI fund's underperformance relative to the SPY ETF in 2015 and 2022, both poor-return years for the markets. In 2018, the CHI fund performed about the same as the SPY ETF on the downside.
Distribution & Yield
One of the main selling points of the CHI fund is its high distribution rate. The CHI fund pays a $0.095 / share monthly distribution that translates into a 9.8% market yield or 10.9% yield on NAV.
The CHI fund's distribution was increased at the beginning of 2021 due to the fund's strong performance in 2020.
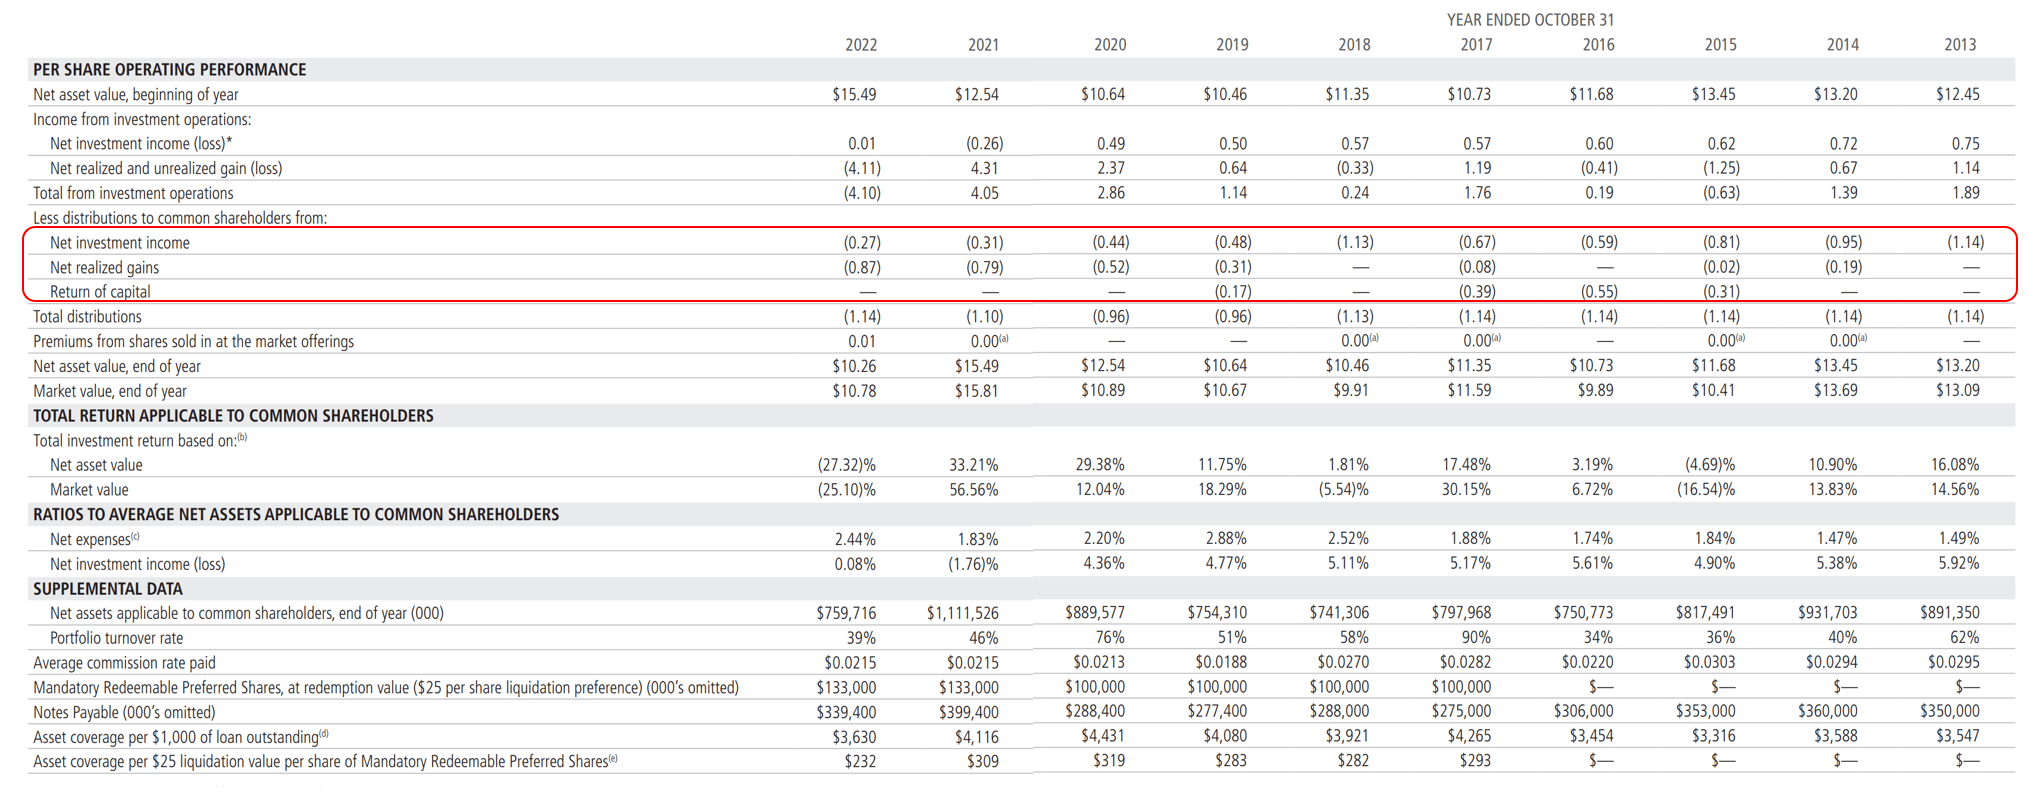
Historically, a significant percentage of the CHI fund's distribution has been funded by realized capital gains and return of capital ("ROC"). For example, in the past 10 fiscal years, 25% of the distribution has been funded by realized gains and 13% has been funded by ROC (Figure 8).
Figure 8 - CHI financial summary 2013 to 2022 (CHI 2022 annual report)
Should Investors Be Worried About Use Of ROC?
Some investors may see the use of ROC and automatically assume a fund's distribution is not sustainable. ROC is an accounting concept that tells investors when a fund was not able to fund its distribution via net investment income ("NII") or realized gains. Although it is generally accurate, it is not infallible.
I prefer to use the economic concept called "return of principal," which is similar to ROC. However, "return of principal" is more concerned with whether a fund's distribution is detrimental to its NAV:
The best measure of whether a fund has earned its distributions is the change in its NAV net of distributions. Regardless of how distributions are characterized, if a fund's NAV increases, the fund earned its distribution. If not, the fund did not earn its distribution - the economic concept of return of principal.
- Quote from an Eaton Vance whitepaper titled: Return of Capital Demystified.
Note the subtle difference between "return of capital" and "return of principal." ROC funds are a subset of "return of principal" funds, but the opposite is not necessarily true if the fund relies more on capital gains over a cycle to fund distributions
Long-Term NAV Decline Suggests CHI Distribution Rate Is Not Sustainable
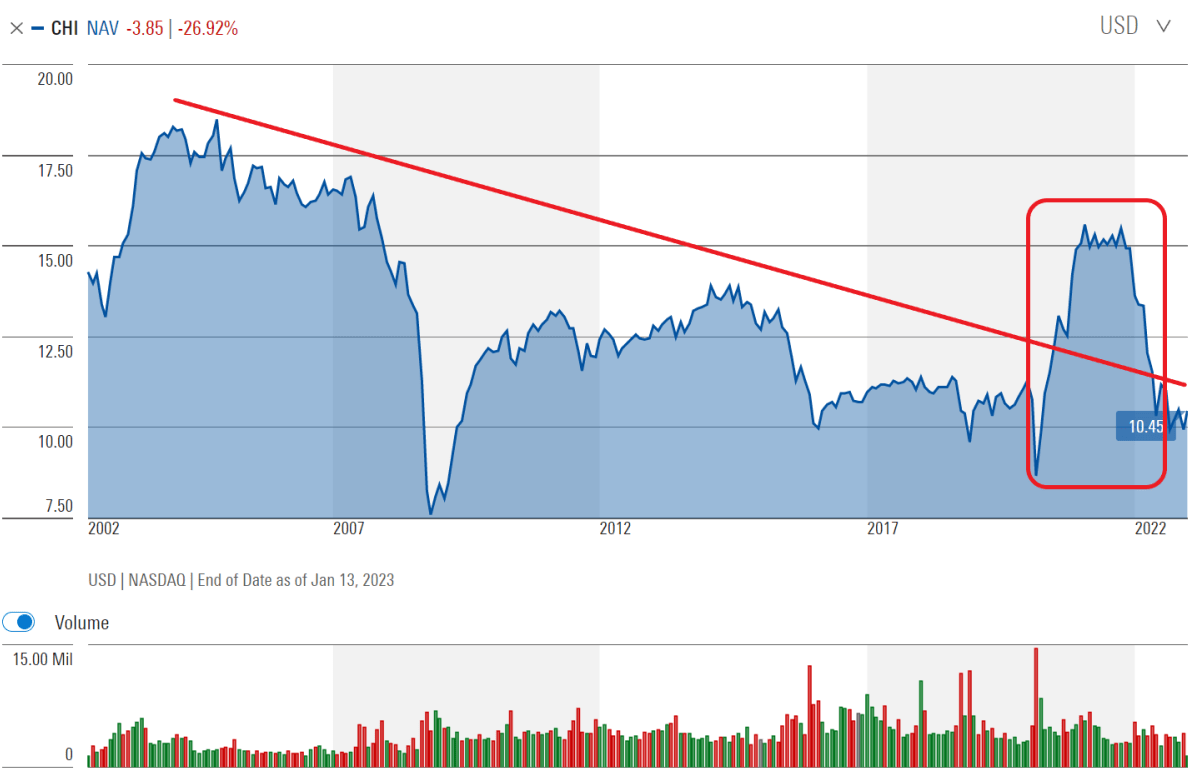
With that in mind, if we look at CHI's NAV over time, there are reasons to be concerned, as its NAV has declined from over $17.50 in the early 2000s to $10.45 recently, with a long-term downtrend in NAV (Figure 9). This suggests the fund is not earning its distribution.
Figure 9 - CHI's NAV has declined over time (morningstar.com)
Another interesting observation is that the period 2020/2021 was highly unusual in terms of returns. Readers may recall that 2020 was marked by the beginning of the COVID-19 pandemic and the Fed essentially flooded the global markets with cheap liquidity to prevent an economic collapse. This Fed largesse turbocharged equity market returns, leading to a phenomenal year for CHI.
Based on its extraordinary 2020 returns, CHI boosted its monthly distributions 19% to $0.095. However, if average annual total returns go back to historical norms, i.e., from 2013 to 2019, the numerical average annual total return was 8.7% p.a., then the current 10.9% yield on NAV is unsustainable.
In fact, if we look historically, CHI's monthly distribution was $0.15 / share in the early 2000s, however, it was slashed to a low of $0.08 / share by 2018. Declining NAV and shrinking distributions are both hallmarks of "return of principal" funds.
CHI vs. ACV
I recently reviewed another convertibles-focused CEF, the Virtus AllianzGI Diversified Income & Convertible Fund ( ACV ). How does CHI compare against the ACV fund?
Comparing ACV's historical annual returns in figure 10 below against CHI's annual returns in figure 6 above, we can see that ACV has performed better every year from 2016 to 2021. In 2022, ACV underperformed CHI by 1.9%.
Figure 10 - ACV annual returns (morningstar.com)
On the whole, ACV has a far higher 5Yr average annual total return of 9.6% vs. CHI's 7.0% (Figure 11).
Figure 11 - ACV vs. CHI (Author created with returns and risk metrics from morningstar and fund details and distribution from Seeking Alpha)
Looking at their respective risks, the ACV fund has higher volatility and max drawdown, but its higher returns give it a higher Sharpe ratio.
Finally, with respect to their forward distributions, ACV has a higher forward current yield of 10.3% vs. CHI's 9.8%. However, readers should note that CHI trades at a significant premium to its NAV, so CHI's forward yield is actually 10.9% of NAV vs. 10.2% of NAV for ACV.
Given ACV's higher historical returns, there is less evidence that its distribution is unsustainable, whereas CHI clearly has an earnings shortfall between its historical average annual returns and its current distribution rate.
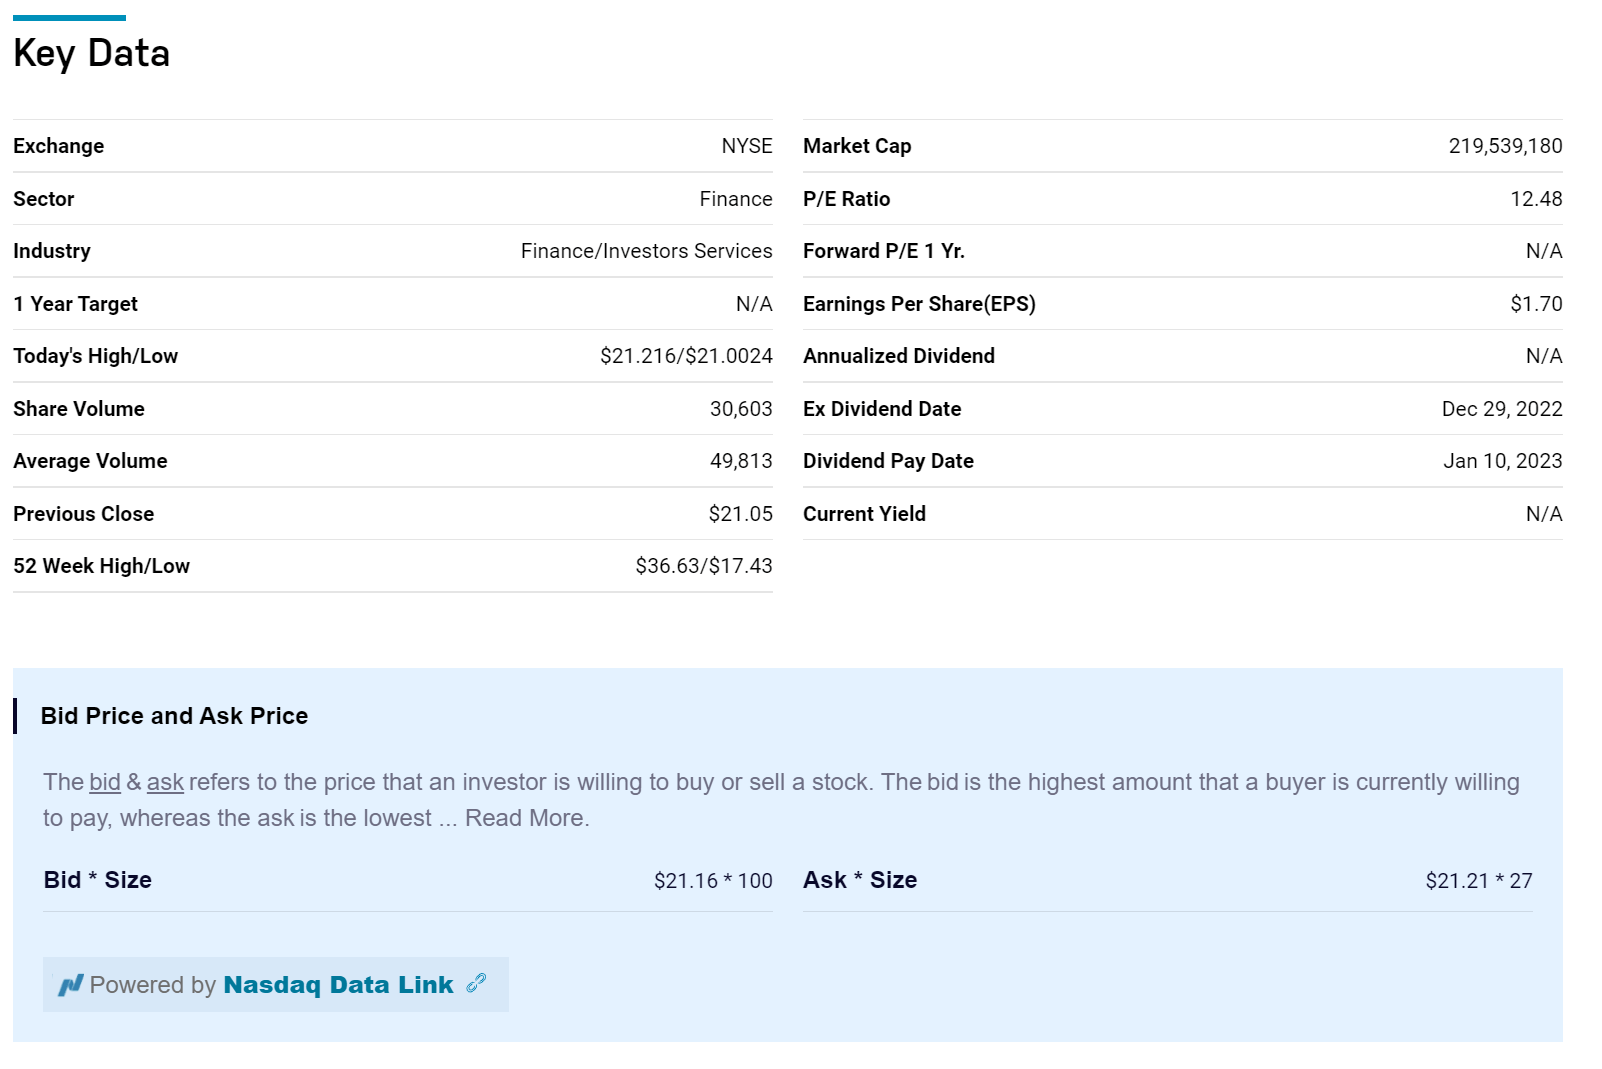
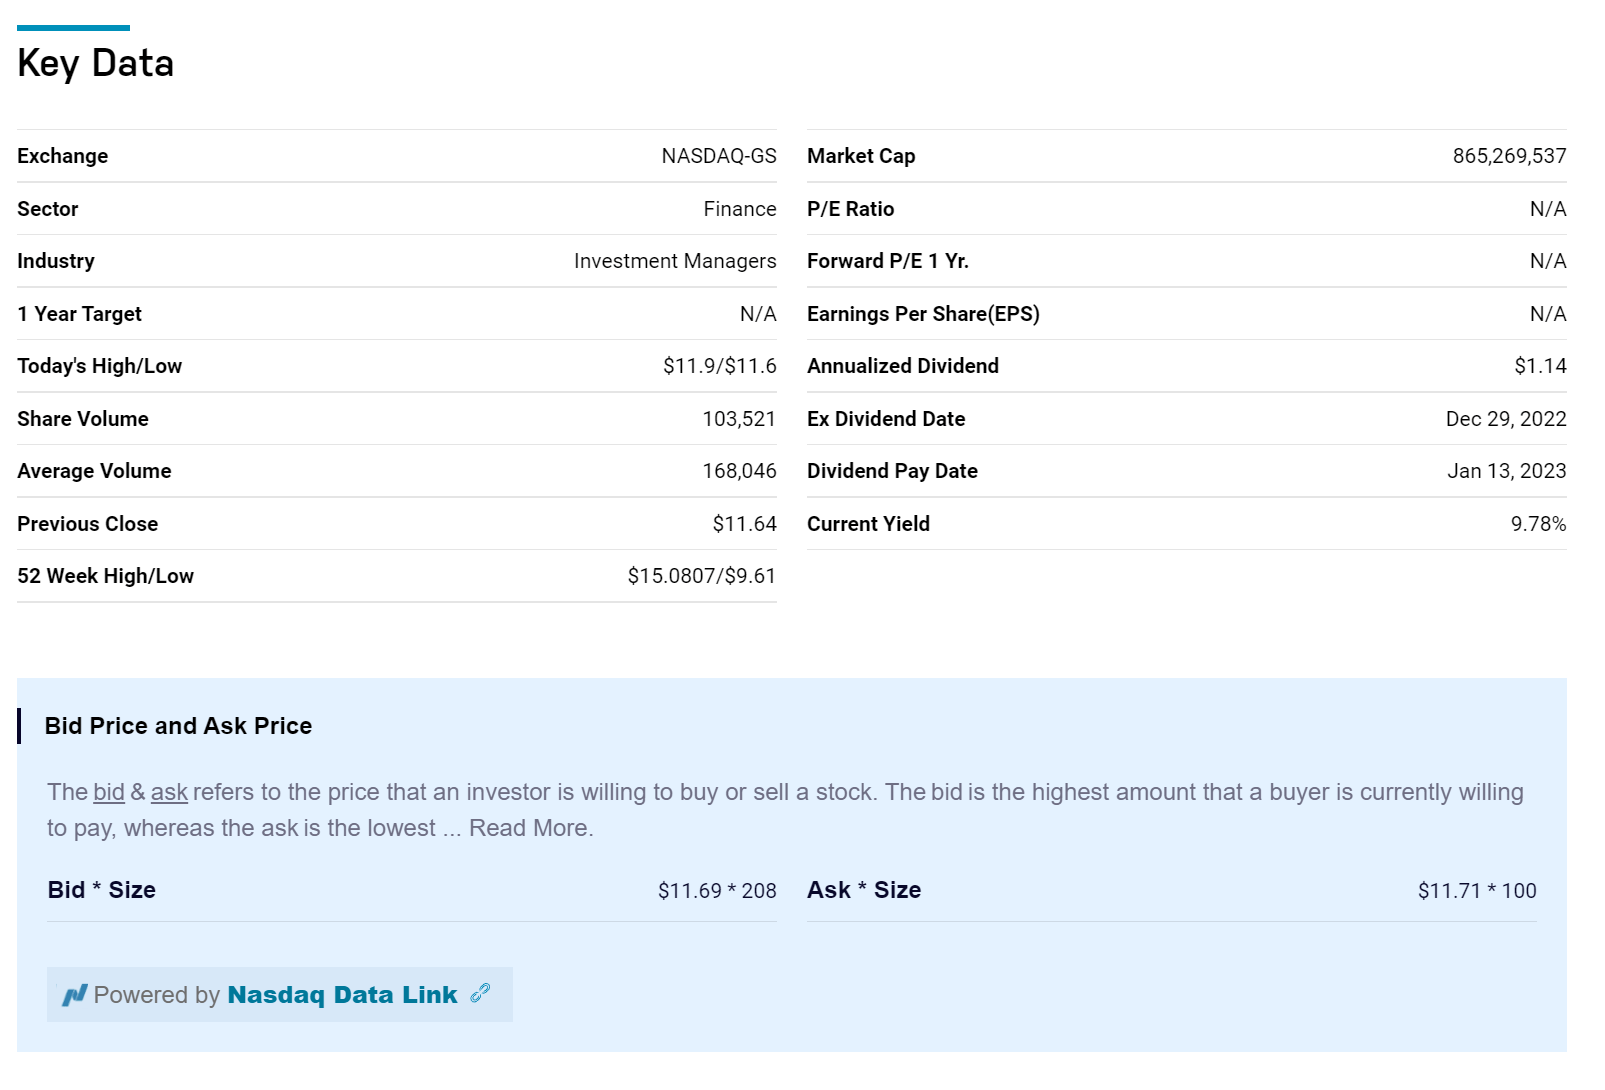
One knock against ACV is that the ACV fund is a much smaller fund than CHI, so it's liquidity is likewise lower than CHI. The ACV fund trades an average of ~50k shares a day or ~$1 million with 5 cents bid/ask spread (Figure 12) while the CHI trades almost 170k shares per day or ~$2 million with 2 cents bid/ask spreads (Figure 13).
Conclusion
In summary, the Calamos Convertible Opportunities & Income Fund is a convertibles-focused CEF that has been around since 2002. The fund has generated modest long-term average annual returns. However, Calamos Convertible Opportunities & Income Fund appears to be paying a distribution yield that is too high relative to its earnings power, as evidenced by long-term NAV declines and a 5-Year average total return of 7.0% vs. a current yield on NAV of 10.9%.
I believe Virtus AllianzGI Diversified Income & Convertible Fund may be a better convertibles fund, as it has performed better historically and its distribution appears more aligned with historical returns.
For further details see:
CHI: Convertibles CEF Paying More Than It Earns