CHS - Chico's FAS: A Deep Value Retailer With A Confusing Management Outlook
2023-09-18 00:36:28 ET
Summary
- Chico's FAS is a women's fashion retailer that operates under three brands: Chico's, White House Black Market, and SOMA.
- Starting in the mid-2010s, CHS has faced challenges, including decreasing store productivity and declining margins.
- Despite material improvements in sales and margins since the COVID-19 pandemic and solid recent performance, there are concerns about the sustainability of these improvements.
- The recent management outlook is confusing and discouraging, accentuating the concerns around the sustainability of the turnaround.
Chico's FAS, Inc. ( CHS ) is a women's fashion company that operates under three different brands. Chico's and White House Black Market (WHBM) focuses on women's apparel and SOMA which primarily sells lingerie, sleepwear, and loungewear.
A Brief History
The company has been public for well over 20 years, starting its operations with only the Chico's brand, acquiring WHBM in 2003 and developing the SOMA brand from scratch starting in 2004.
From the mid-90s to the start of the GFC, the company grew revenues at very strong rates, it was obviously affected by the economic picture in 2008-09 but afterward started growing again at very healthy levels almost exactly up to the moment of the announced retirement of David F. Dyer as President and CEO and the appointment of Shelley Broader as his successor.
Browder's previous experience was mainly with merchandise retailers and food distributors, with no apparent previous experience in the apparel industry.
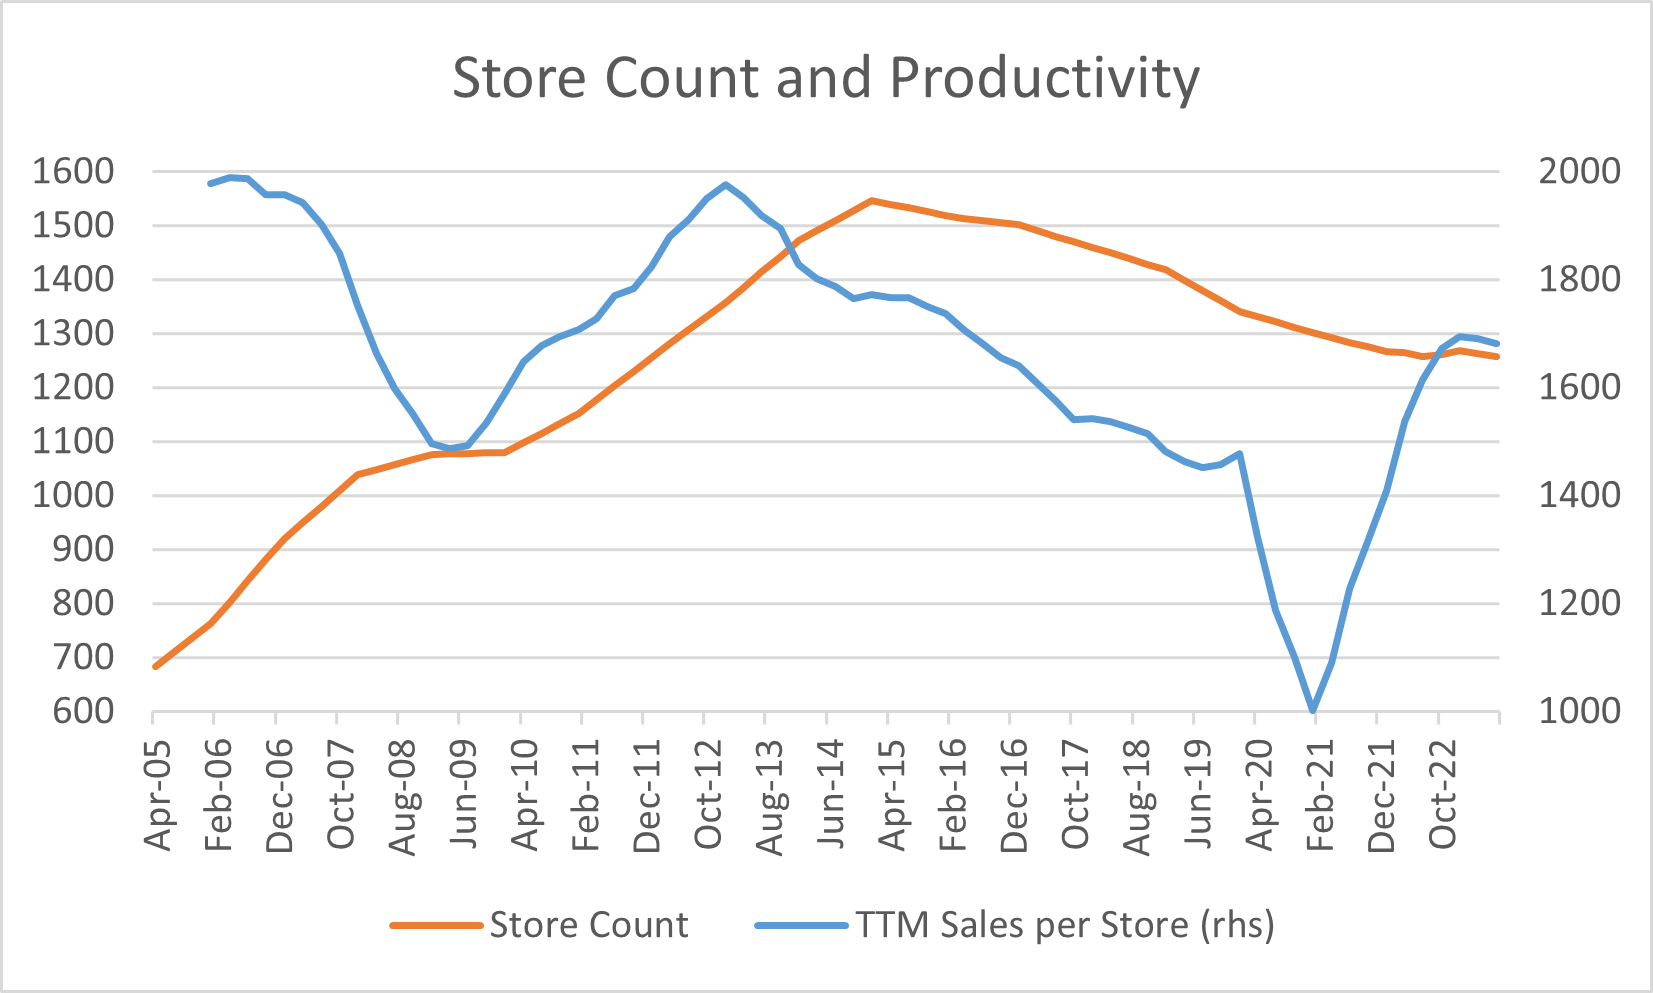
It would be unfair to pile all the challenges that the company faced after her appointment on Browder as beginning in 2013, the store productivity started to markedly decrease, so the last two years of revenue growth in Mr. Dyer's tenure were on the back of an increasing but less productive store count that materially affected margins.
By 2015, the company started to reduce its store count and changed its focus toward margin improvements, and it managed a significant increase through 2016 and 2017, but sales even on a per-store basis kept going down on a consistent basis.
CHS Financial Disclosures and Author Calculations
And 2018 was the year when everything derailed as by the end of the year, it was clear that margins were on a clear and consistent downtrend, leading to the resignation of Browder and the appointment of Bonnie Brooks , a director of the company at the time, as CEO on an interim basis.
In charge of the turnaround of the company, Brooks was confirmed as CEO and a few months later brought in Molly Langenstein, a 30-year retail industry veteran with a long career at Macy's, consolidating the responsibility of both apparel brands under her. She was promoted to the CEO position less than a year after her arrival, and by the 4th quarter of 2019, there were some encouraging green shoots with margins improving and the first positive sales quarter on a comparable basis since 2Q 2015.
But, as you all well know, a few months later, COVID came, free money flooded the economy, and consumption exploded. So, three and a half years later, sales per store are 14% above pre-covid levels, operating margins have improved by more than 700bp, and store count has largely stabilized.
And herein lies the most important question to any investor thinking about buying this stock.
To what degree all those improvements are? Just the consequence of the economic backdrop or is there anything that might point to a degree of sustainability looking forward?
To be honest, I do not have a solid answer but by looking at the health of the balance sheet, the level of inventories, recent operating performance, the latest guidance, and current valuation metrics, I will try to inform how risky is an investment in CHS at this point.
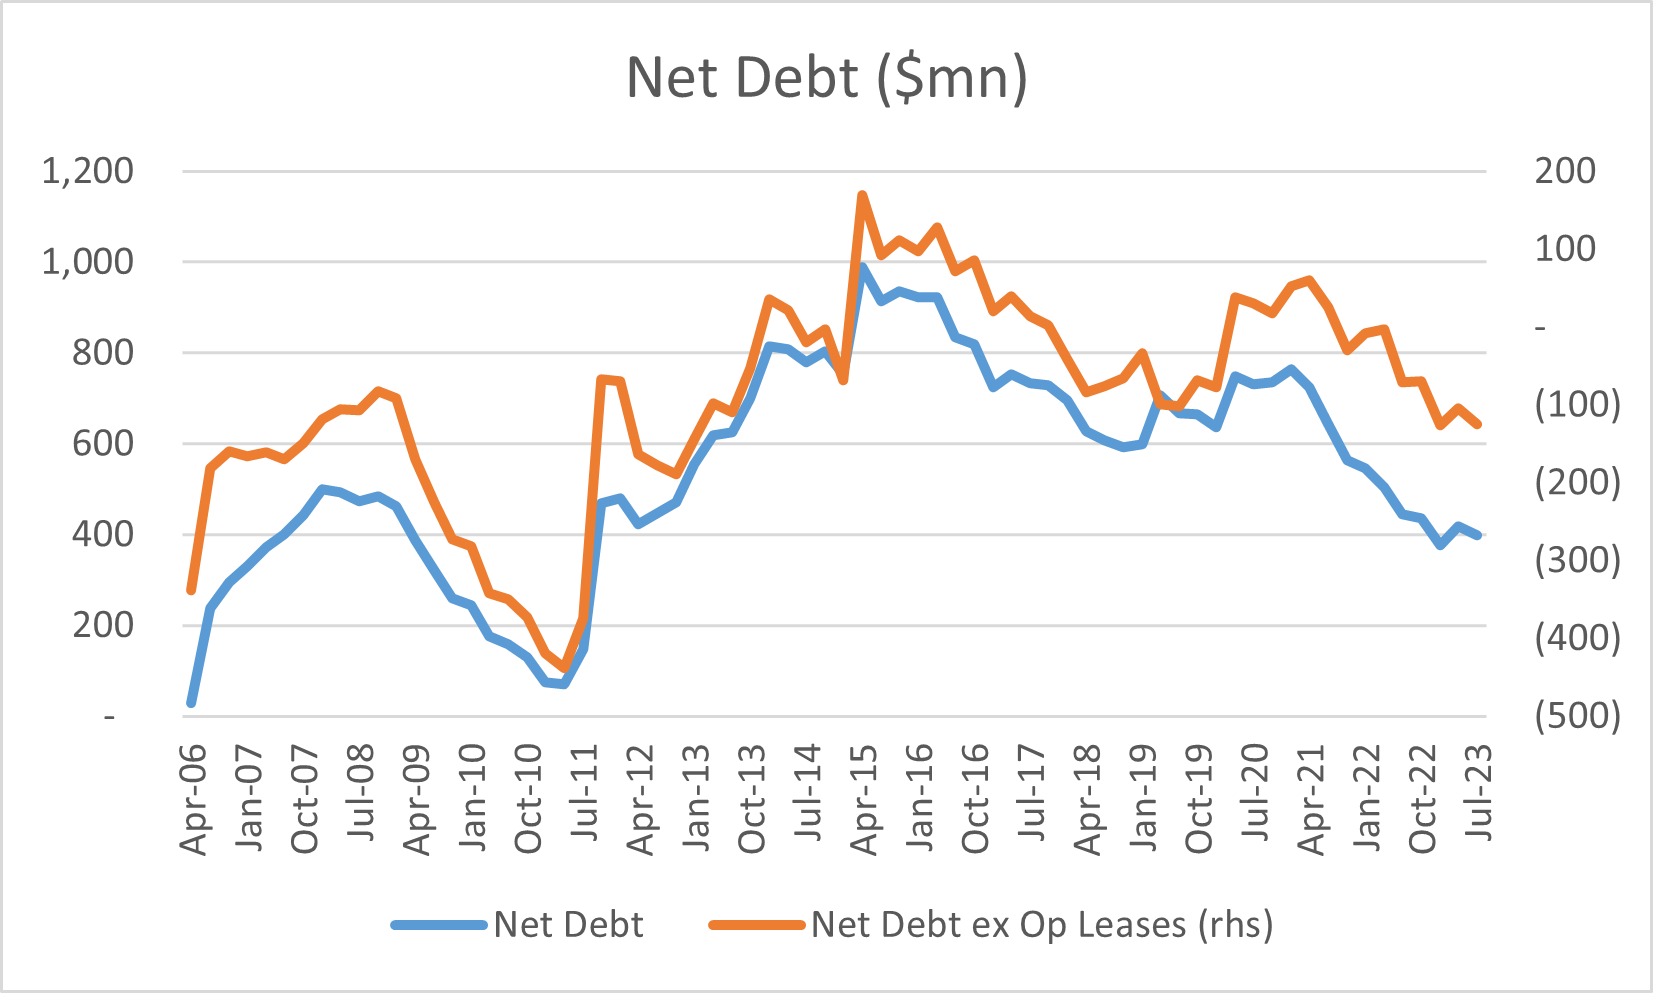
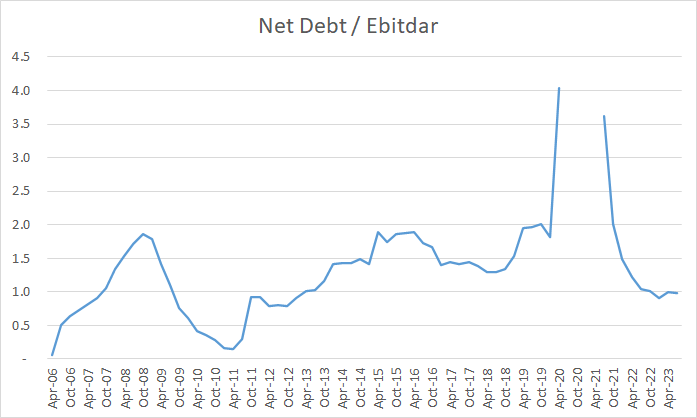
Balance Sheet and Inventories
Here, there is not much to worry about as debt in both absolute and relative terms stands at levels of health not seen in over a decade. Just to clarify, pre-2019 companies did not show operating lease liabilities in their balance sheet, so before that date, I am using adjusted data calculated by me by using the relationship between total commitments and liabilities in the balance sheet after the implementation of this new accounting standard. Of course, the numbers won't be perfect, but I'll be surprised if I am off by more than 5%.
CHS Financial Statements and Author Calculations CHS Financial Statements and Author Calculations
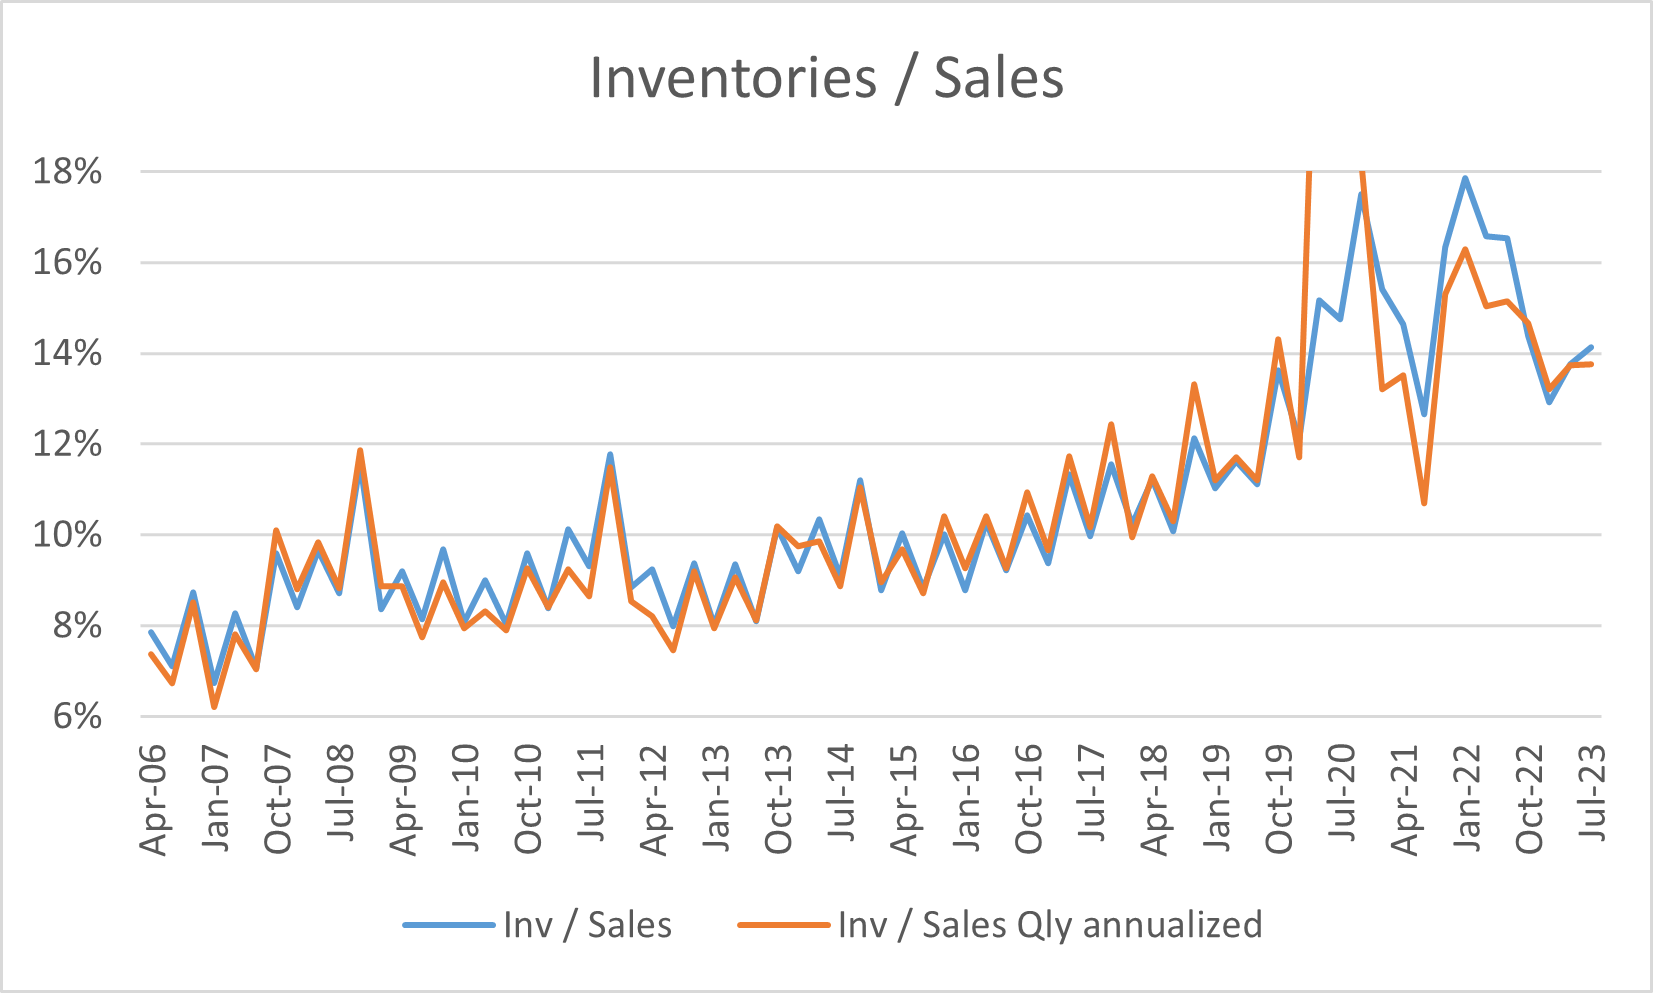
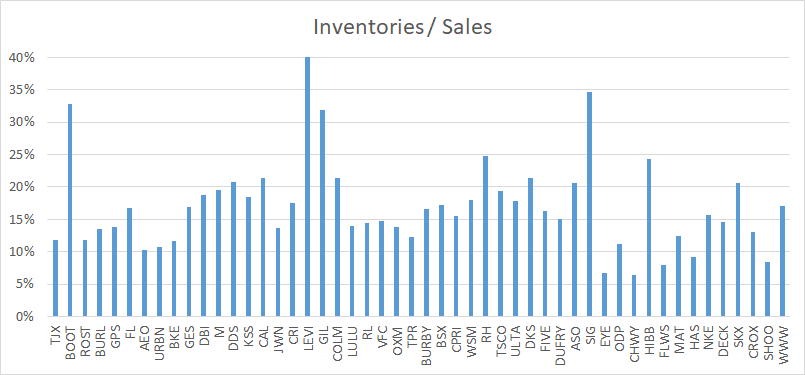
The picture around inventories is a little murkier as you can see that the company has consistently increased its level as a proportion of sales, that obviously is not a good development as more working capital implies a less efficient capital structure, but at the same time, you can see that current level of inventories are pretty much in line with other players in the retail industry.
CHS Financial Statements Seeking Alpha Standardized Financial Statement for each company in the sample
So, overall, the picture is not ideal, but I would not say that in and of itself might point to an imminent need for an increase in promotional activity.
Recent Performance and Valuation Metrics
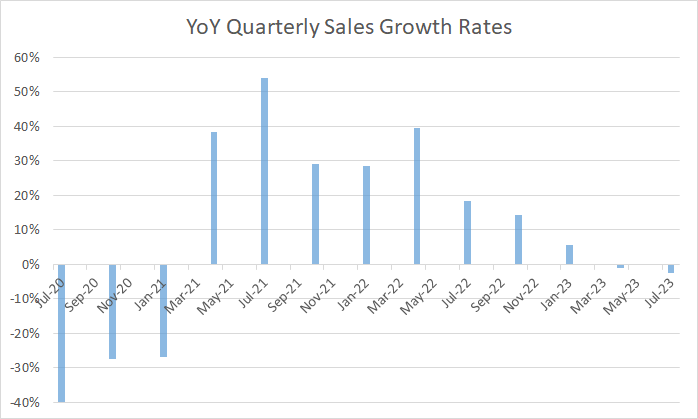
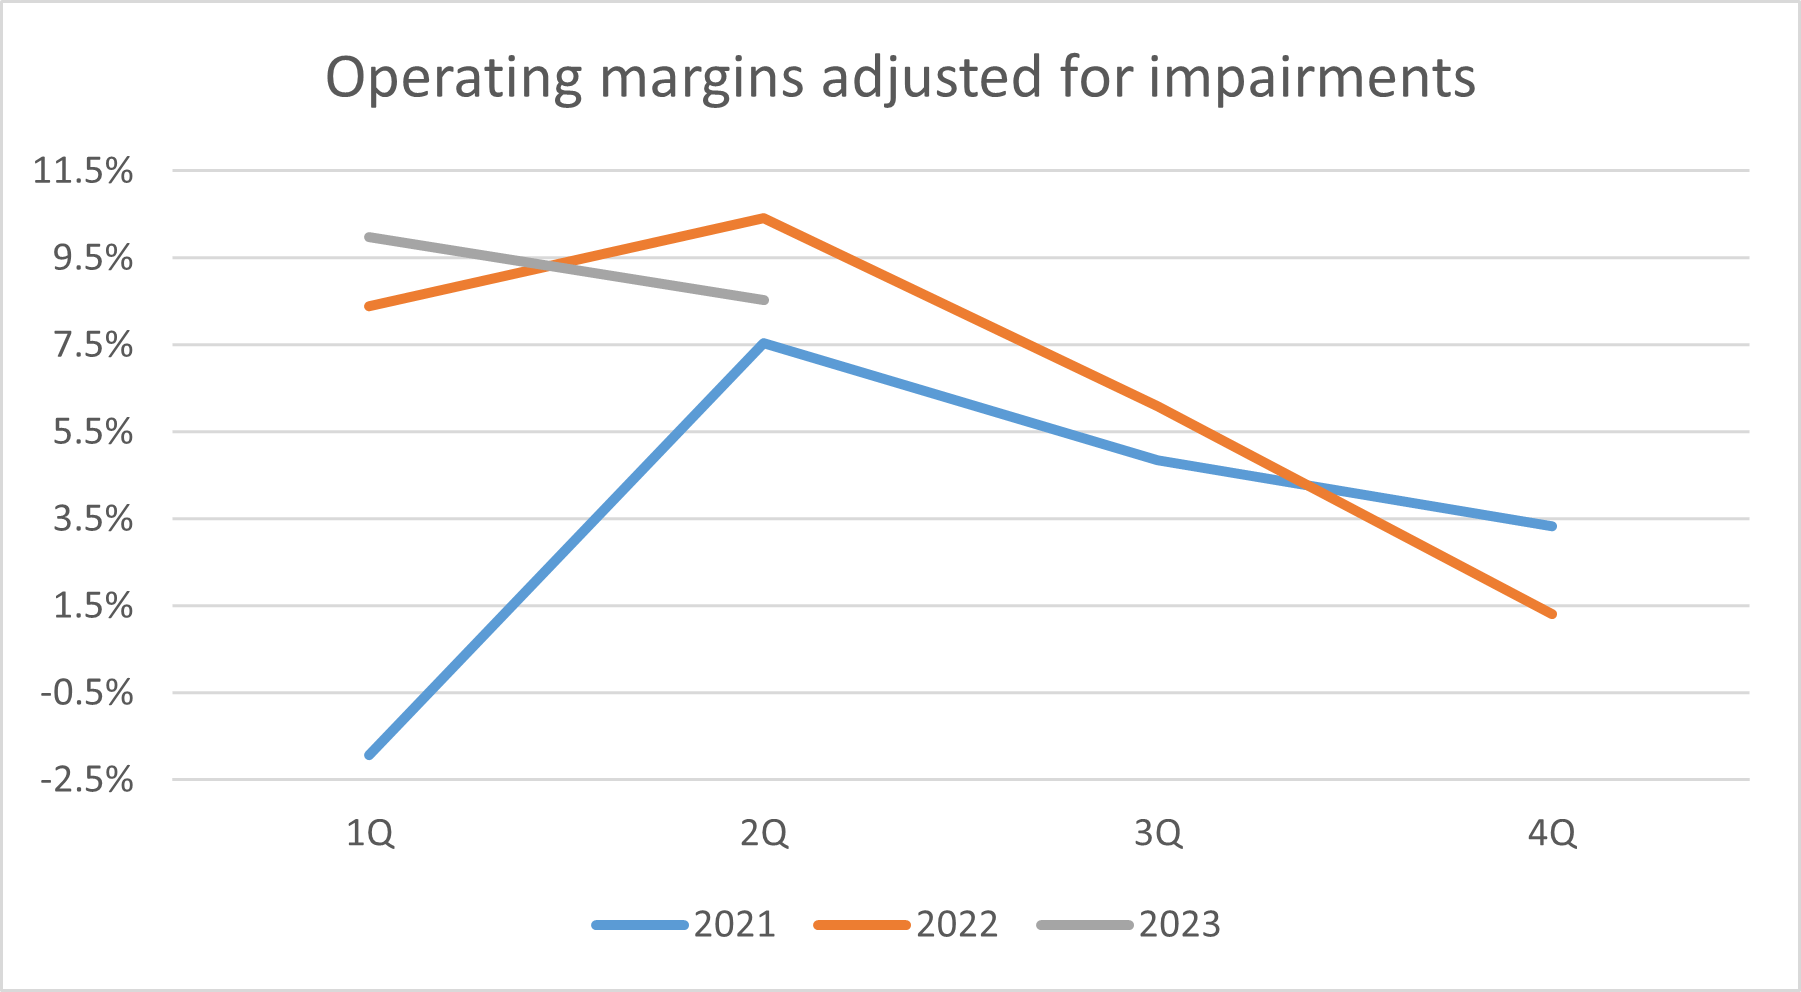
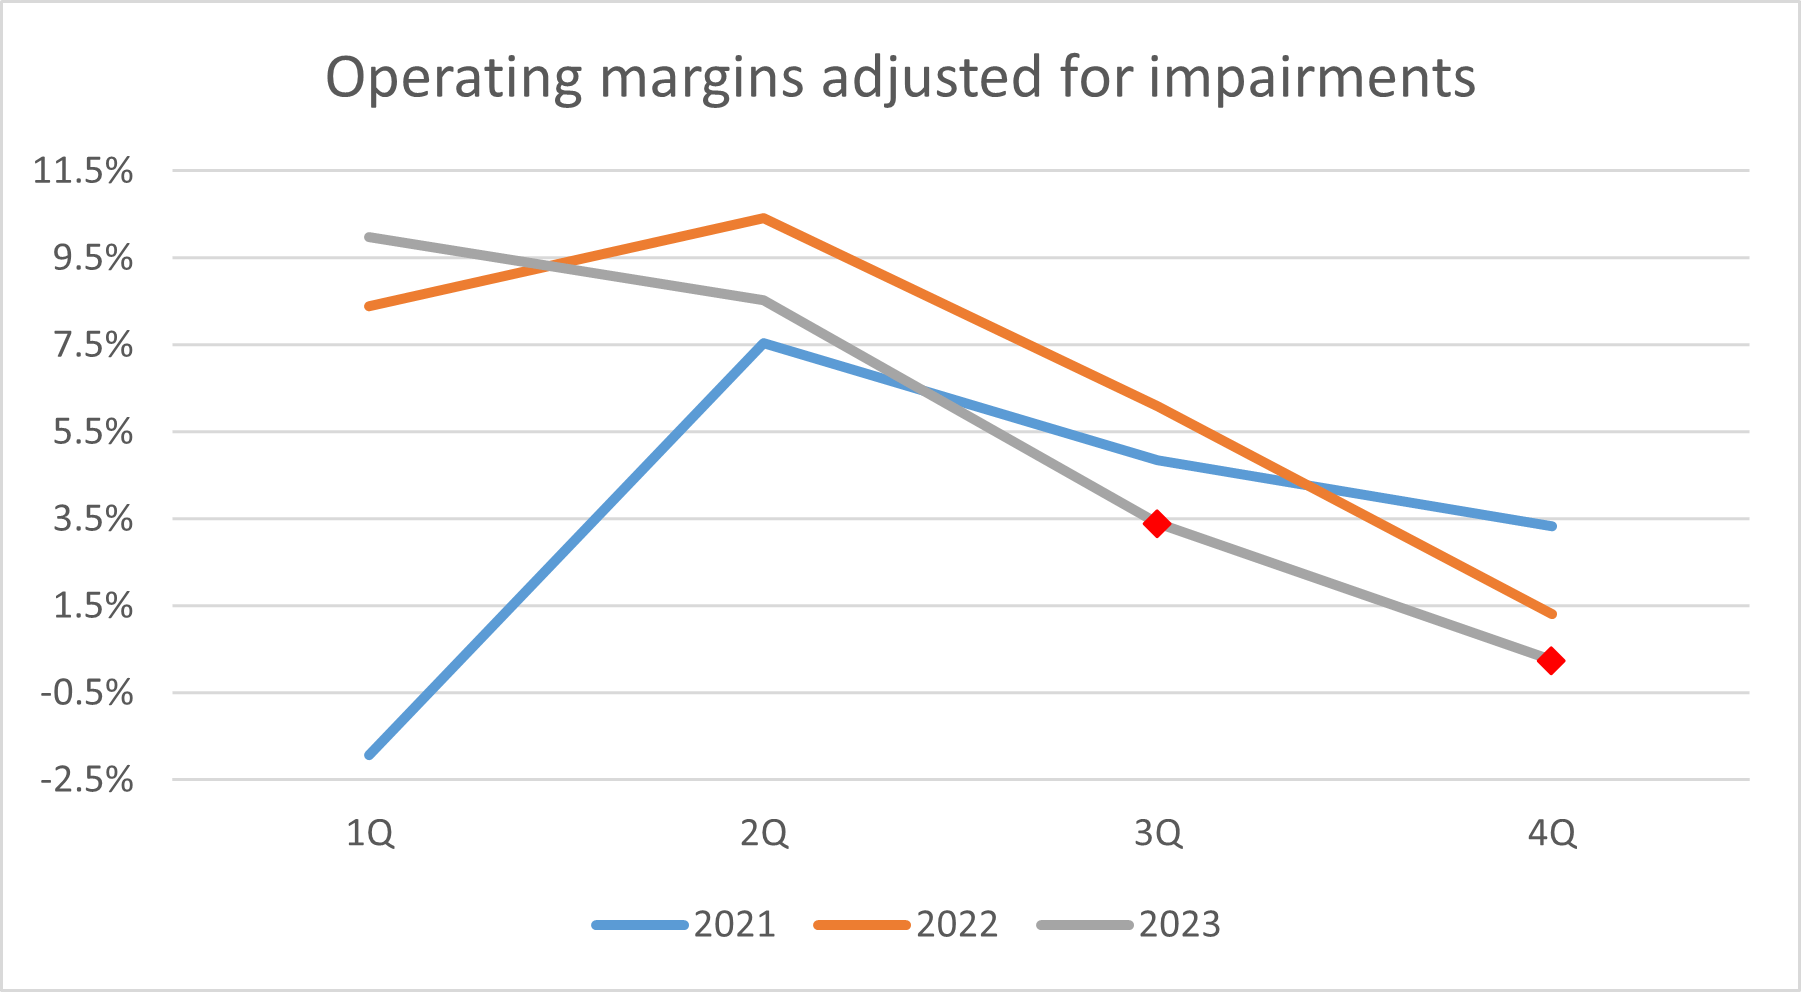
Recent performance has been very encouraging, especially considering that this is a retailer that I would still consider in turnaround mode. For almost all retailers, the second half of 2021 and the first half of 2022 were periods as ideal as it gets, but, starting in the second half of 2022, more and more retailers started showing signs of weakening performance in sales and margins.
But, as you can see, CHS has been able to hold on to sales and margins even in this decelerating environment for the economy and consumption.
CHS Financial Statements CHS Financial Statements
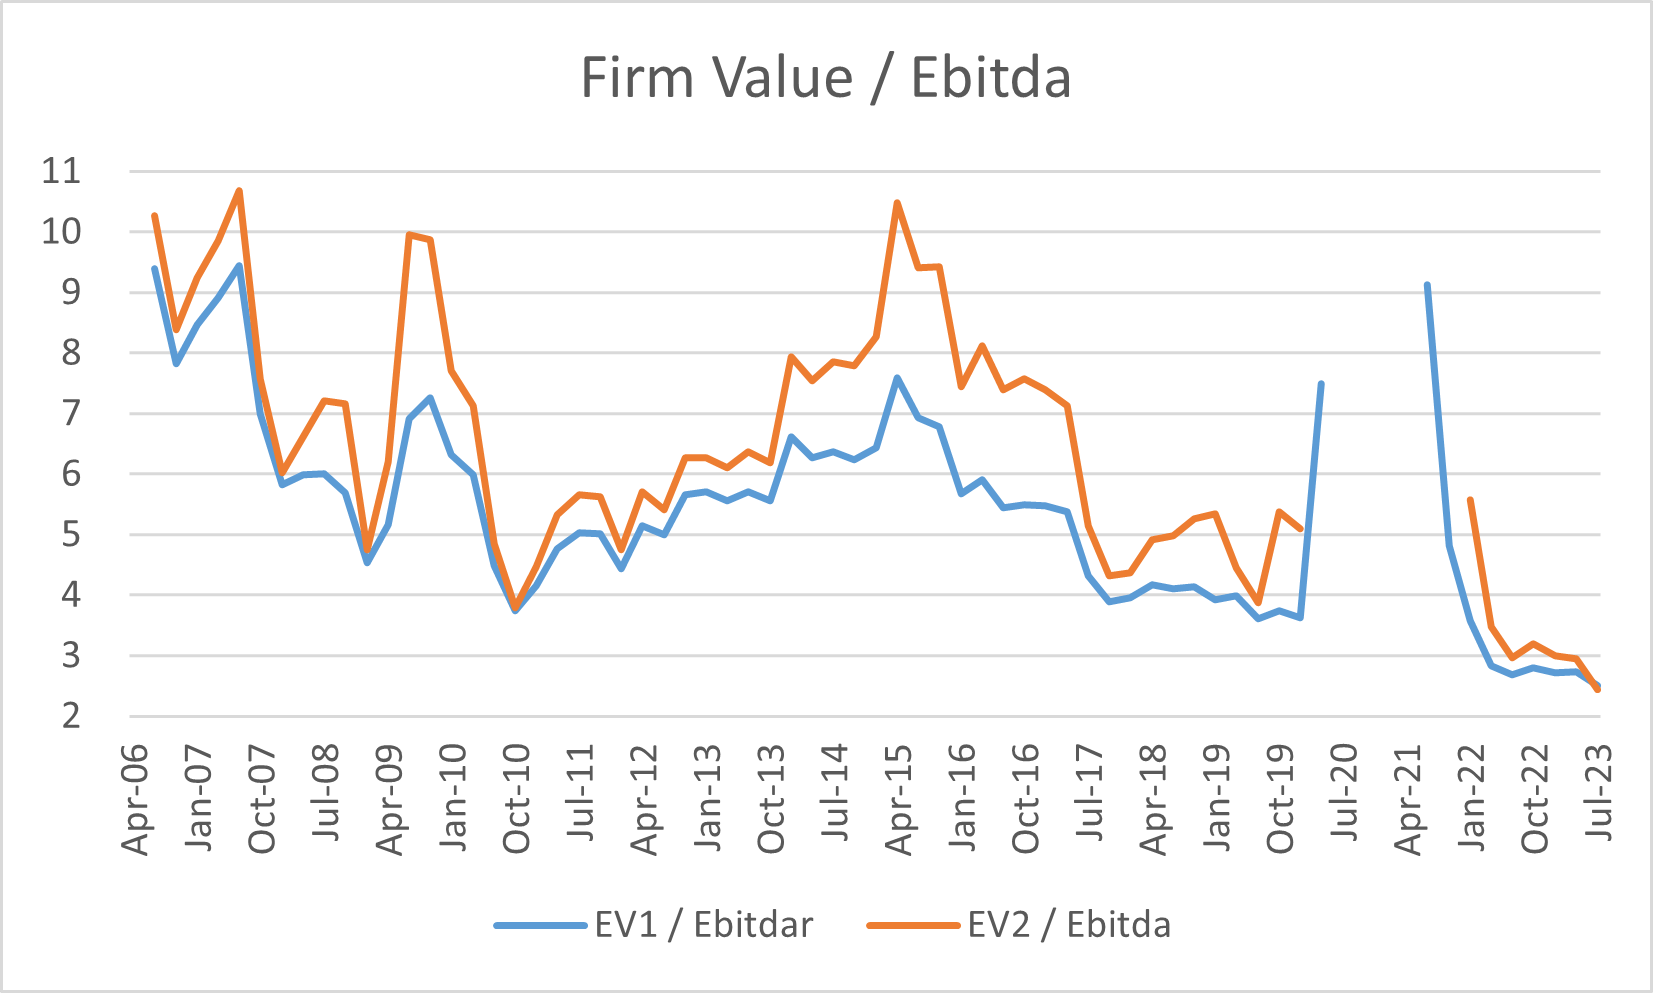
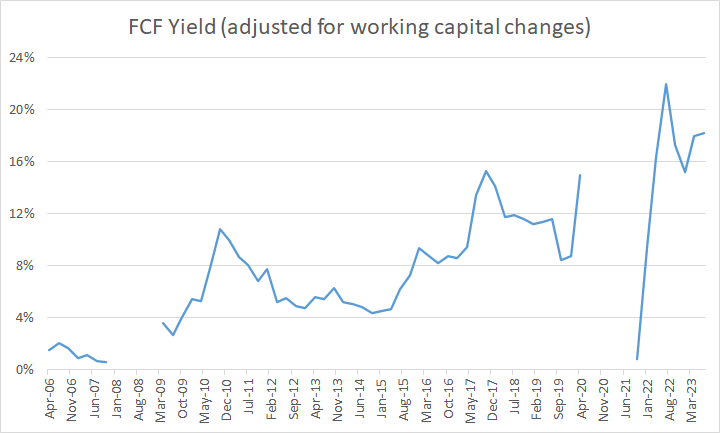
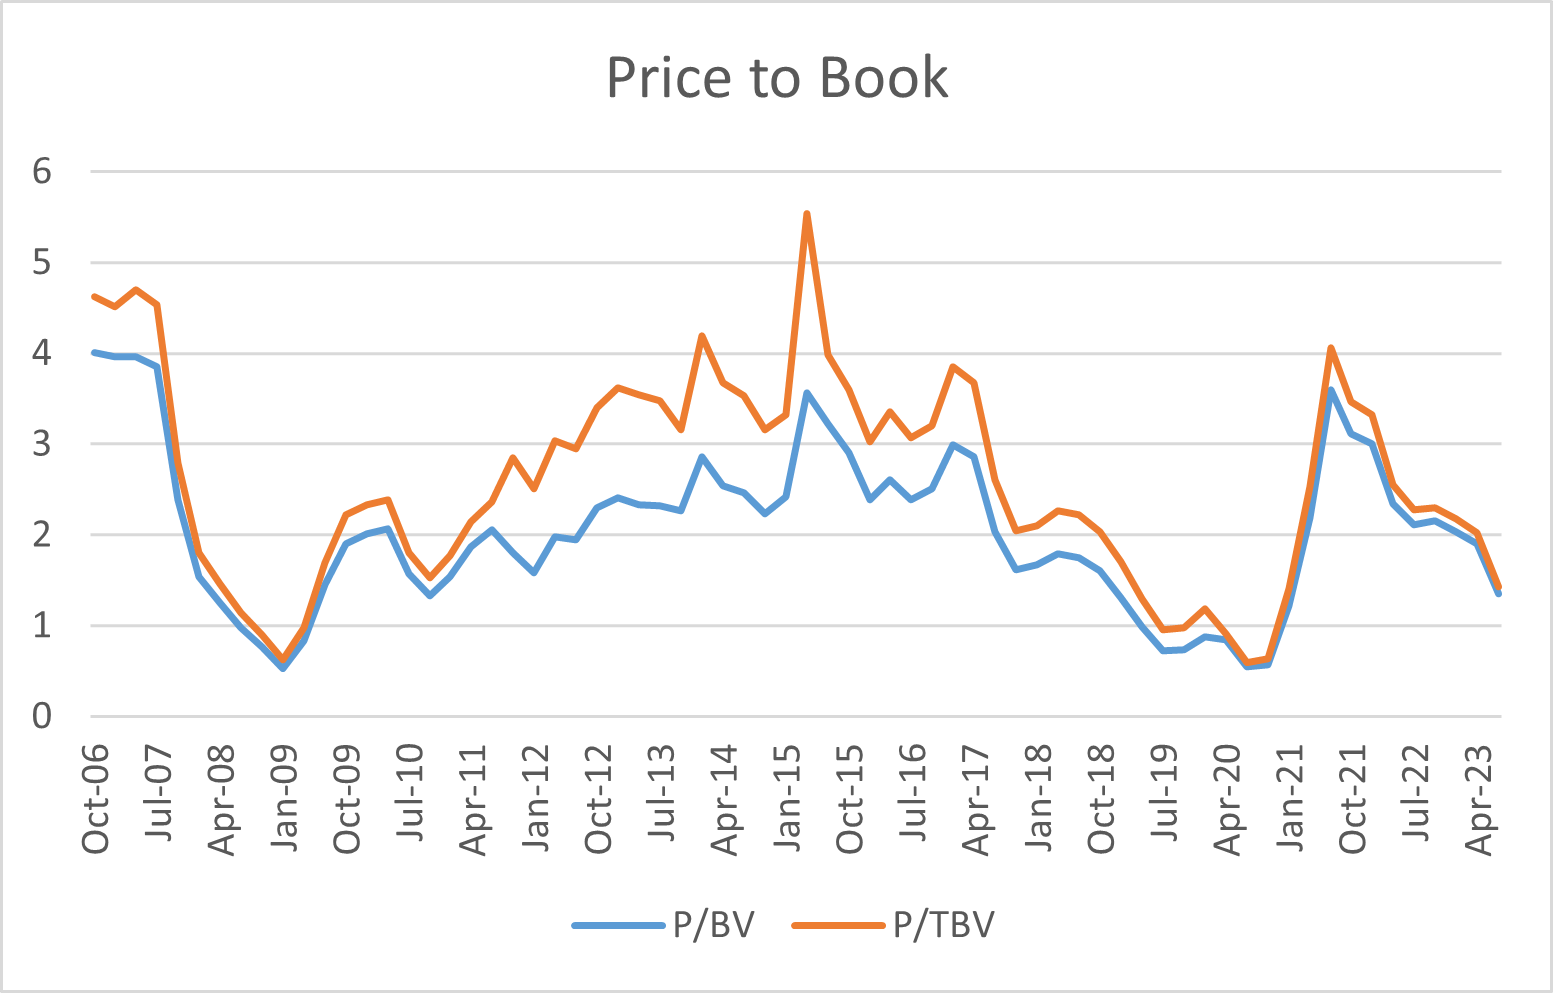
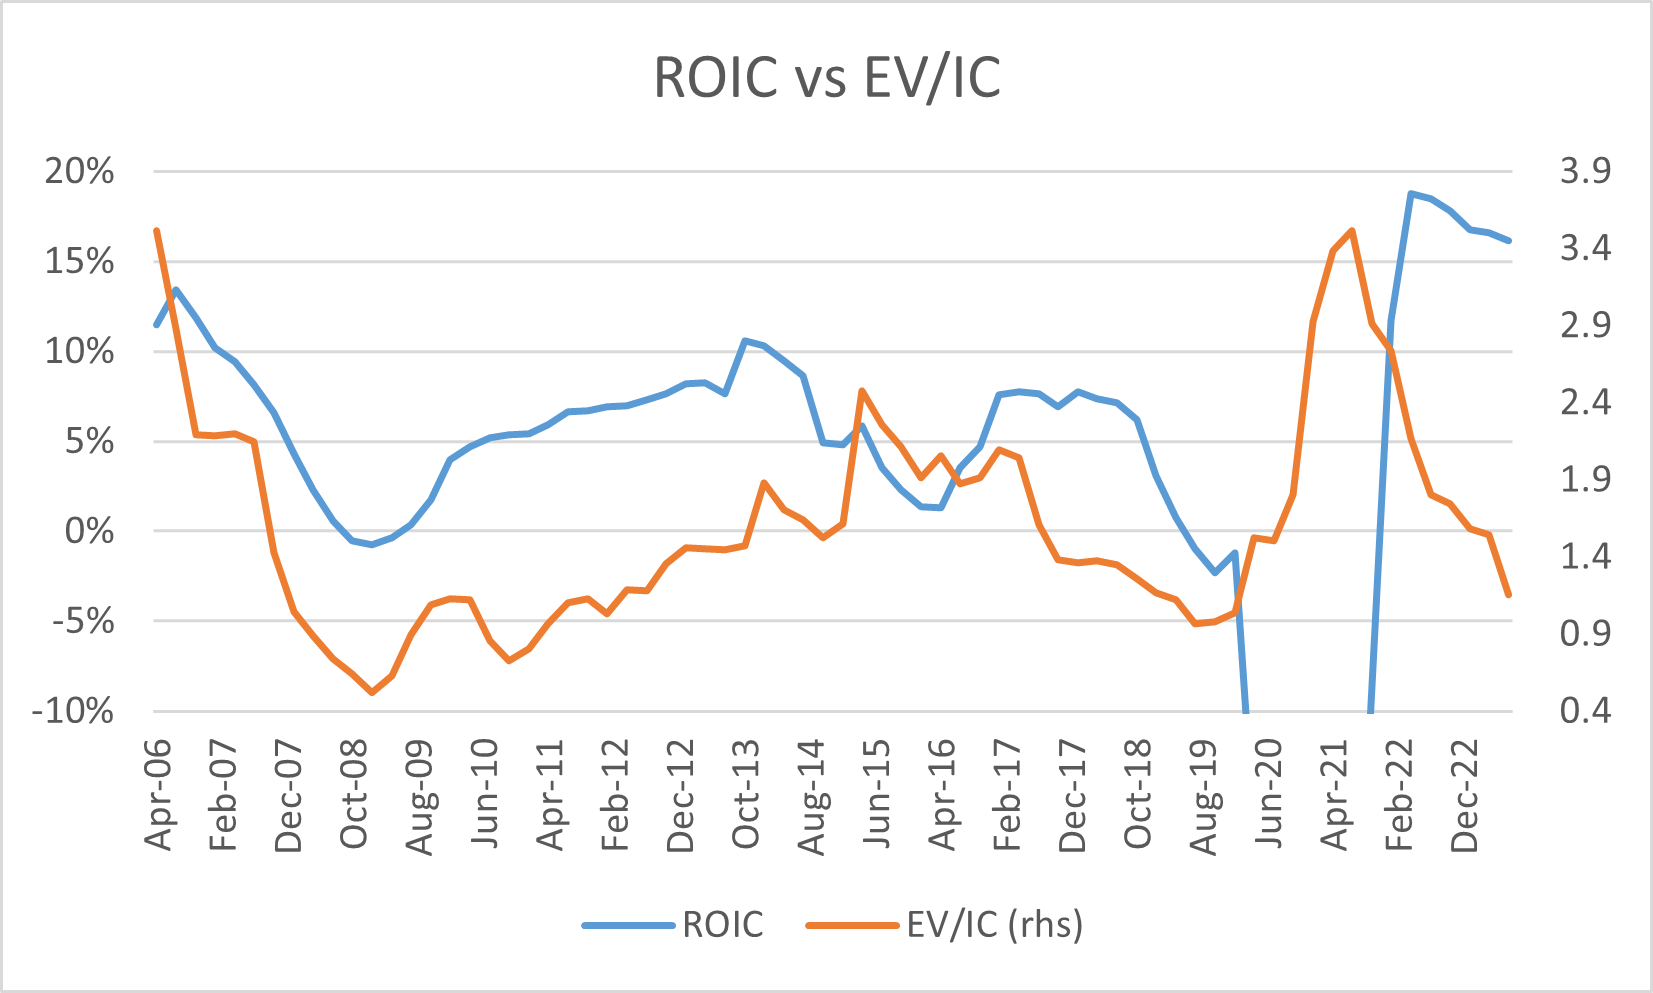
Turning to trailing valuations is where you can truly see the most attractive picture for CHS as an investment. Here is a handful of valuation metrics that show that the company is trading at almost ridiculously cheap levels at least on a trailing basis. One clarification relating to the EV/EBITDA metrics, Seeking Alpha and many other sites that calculate this metric on an automated basis include operating lease liabilities on the EV leading to an EV/EBITDA multiple closer to 5 times for CHS, but under US GAAP, rent expense is not included in depreciation but on operating expenses, so if you want to use an EV metric that includes operating lease liabilities, you should calculate EBITDAR and that is what I did, showing both metrics in one of the following charts.
CHS Financial Statements and Excel function of historical stock prices CHS Financial Statements and Excel function of historical stock prices CHS Financial Statements and Excel function of historical stock prices CHS Financial Statements and Excel function of historical stock prices
In general terms, retailers are trading at modest valuations given the macro picture, but this one stands out even among this group, hence the A valuation Grade provided by Seeking Alpha Quant Rating System .
I would assume that anyone reading up to this point is probably thinking about what is not like about this dirt-cheap investment with a solid balance sheet. To answer that question, let me take you to the next section of the article.
Guidance
Starting in the first quarter of 2022, the company started guiding on sales, gross margin, and SG&A as a percentage of revenues for the next quarter and full fiscal year and in the case of Capex just on an FY basis.
The following table shows the evolution of their FY 2023 Guidance.
CHS earning call presentations
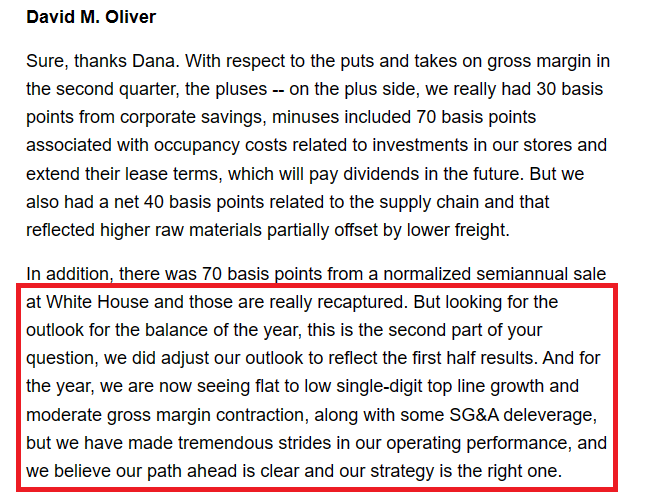
That is clearly not an ideal situation but the figures on isolation do not look that awful, the problem is that the first half of the year has so far shown a very solid performance, implying a significant deterioration in terms of margins for the second half of the year. This is a somewhat strange retailer in terms of seasonality. The second half of the year is generally worse than the first half and the fourth quarter is normally the worst of the year, so it would be normal for the second half to be more challenging; the problem is the level of deterioration expected for the second half against the second half of 2021 and 2022. And those expected margins are particularly difficult to understand as their guidance in terms of sales is somewhat constructive, with an expectation of flat to low single-digit revenue growth.
The first question in its latest conference call was about the drivers around margins and what follows is its CFO's not very illuminating answer.
Seeking Alpha 2Q2023 earning call transcript
The company's guidance for the 3rd quarter implies an operating margin of 3.4% and based on the full-year guidance, it's possible to derive an expected operating margin of just 0.25% for the 4th quarter. That expectation if proven correct would translate into a deterioration of more than 200bp for the second half of the year versus the last two years.
CHS Financial Statements and earning call presentations
In my opinion, this is a significant failure of communication on behalf of the company. Management should be able to explain what the drivers of that material deterioration in margins are, especially if your own guidance points to a healthy evolution of sales. But if you don't, investors will understandably assume that the significant improvement in margins observed in the last 3 years was mainly a consequence of the money thrown on the economy during the covid crisis and as such, not sustainable.
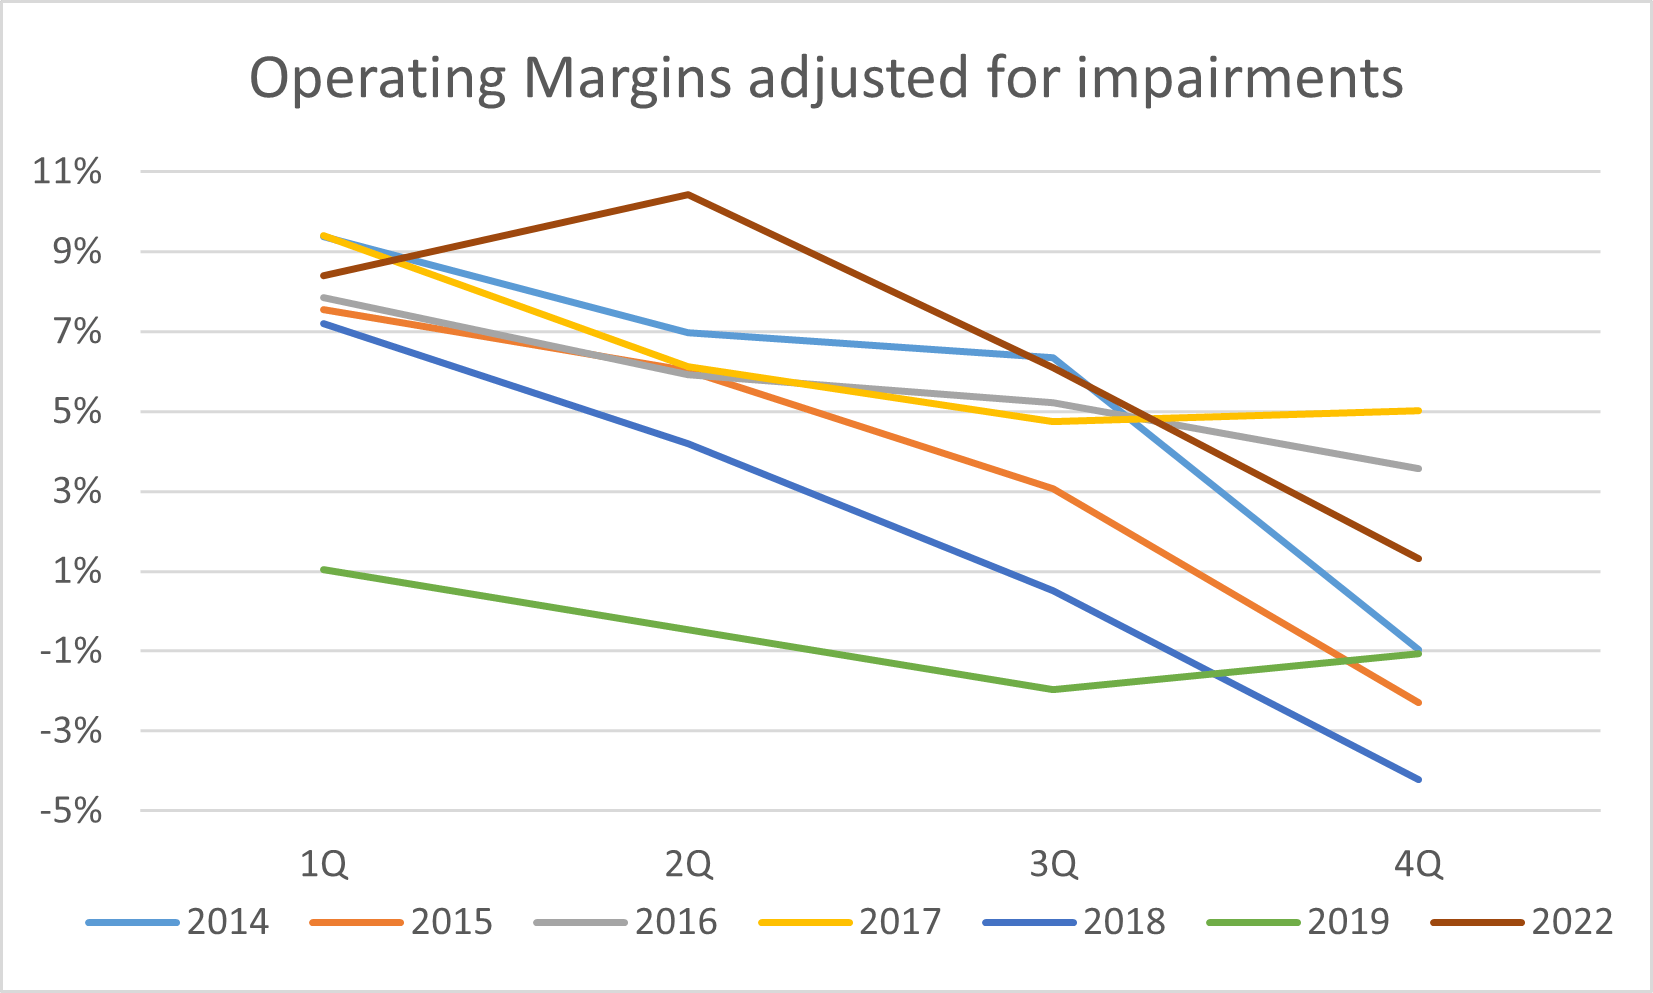
One interesting factoid in that line of thinking is that those expected margins for the second half of 2023 are almost exactly the same that you get when you average the quarterly margins of the years after the problems for the company started in mid-2013. I am leaving out the most affected years by the Covid crisis (2020-21) but importantly including the disastrous period of 2018 and 2019.
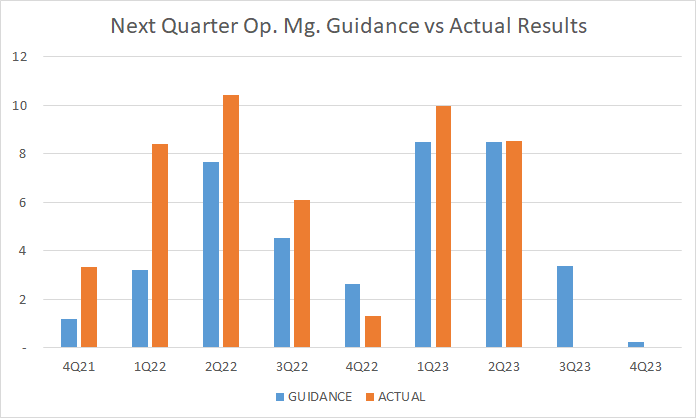
One last comment regarding guidance, and this time on the positive side of things is that since they started this more specific guidance model, management has proven to be relatively conservative at least regarding their expectations for the next immediate quarter, and if that is any guide, they should beat their margin projections for the coming quarter.
CHS Financial Statements and Guidance
A final drop of skepticism comes from the fact that the company recently announced a new $100 million share repurchase authorization, but the company did not deploy a single dollar during the quarter. Why not? The stock is trading at historically cheap valuation metrics and the balance sheet is as healthy as it has been in more than a decade, are they expecting a similar deterioration in margins?
It's impossible to be sure, but without more clarity regarding their guidance and unwillingness to deploy a portion of the repurchase authorization, the principle of margin of safety requires that we use a conservative approach to projecting results for the company.
For that, using the following set of assumptions, I will use a DCF exercise to get to an idea of how attractive an investment in CHS under those conservative expectations is.
Revenue: The midpoint of guidance provided for the company for the 3rd and 4th quarter. And afterward zero growth.
Operating Margins: The midpoint of guidance provided for the company for the 3rd and 4th quarter. And afterward, the average of the years 2014 to 2019 and 2022. Those margins are 7.26%, 5.6%, 3.43% and 0.2% respectively starting from the first and ending with the fourth quarter.
Capex: The midpoint of guidance provided for the company for 2023. And afterward a 2.5% of sales, in line with the latest reading.
Depreciation: A 1.9% of sales, in line with the latest reading.
Effective tax rate: The midpoint of guidance provided by the company for the 3rd and 4th quarters and afterward a 24% rate in line with the average of the years 2021, 2022, and their guidance for 2023.
Discount Rate: 10.4% based on current 10y treasury rates, a beta for the company of 1.18, and an equity risk premium of 5.18 based on figures provided by Professor Damodaran.
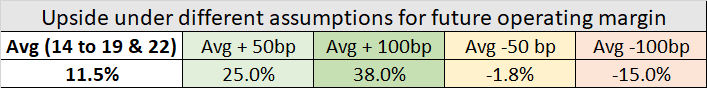
With all those inputs, I get to a mildly appealing expected upside of 11.5% over the stock price of $4.56 (Sep 14th market close).
Are those assumptions excessively conservative? Maybe the margin projections, but again, I am attempting to provide a sufficient margin of safety to justify an investment. In any case, the next table shows different margin assumptions and the associated expected upside.
I was originally attracted to the company for the valuations and recent strong performance, leading me to start a small position, but their latest guidance really spiked my scepticism and made me change my view to a more conservative outlook.
My recommendation here would be to hold any position that you might have, that is what I would probably do in the absence of new information, as shares are trading near the bottom of the range it has held for the last two years.
I am fully open to changing my mind and moving to a more bullish stance, but that would require some further clarity from the company regarding its seemingly disconnected perspective for margins and sales.
Hope this article was useful in your due diligence around CHS, thanks for reading, and good luck with your investments.
For further details see:
Chico's FAS: A Deep Value Retailer With A Confusing Management Outlook