CHRD - Chord Energy: At The Mercy Of Rising Oil Prices
2023-10-15 07:31:01 ET
Summary
- Chord Energy is an oil and gas exploration company with the largest footprint in the Bakken Shale and Williston Basin in North Dakota.
- The company was formed through a merger between Oasis Petroleum and Whiting Petroleum.
- Chord Energy has a disciplined capital program but is struggling to grow its oil production which means growth is only possible via rising oil prices.
- A comparison to Permian Resources highlights the two different growth trajectories between the two companies.
Chord Energy( CHRD ) is an oil and gas exploration company primarily focused in the Bakken Shale in the greater Williston Basin area in North Dakota. The company currently trades with a market cap of $6.8 billion.
The company resulted from the "merger of equals" that happened in July 2022 between Oasis Petroleum and Whiting Petroleum. When the company combined , they were producing a total of roughly 90,000 barrels of oil per day and 160,000 barrels of oil equivalent per day. Given that the two companies operated in the same region in the same play, the two companies believed they could achieve significant synergies. To provide a snapshot on their progress, the combined company now produces 169,000 barrels of oil equivalent per day and 96,000 barrels of oil per day.
Oasis/Whiting Bakken Positions Before Merger (Chord Merger Presentation)
Oasis Petroleum was founded in 2007 when it purchased 175,000 net acres in the Williston basin for the ridiculously low price of $83 million. Whiting Petroleum finds its roots dating back to 1980 but was spun-off as a public company in 2003.
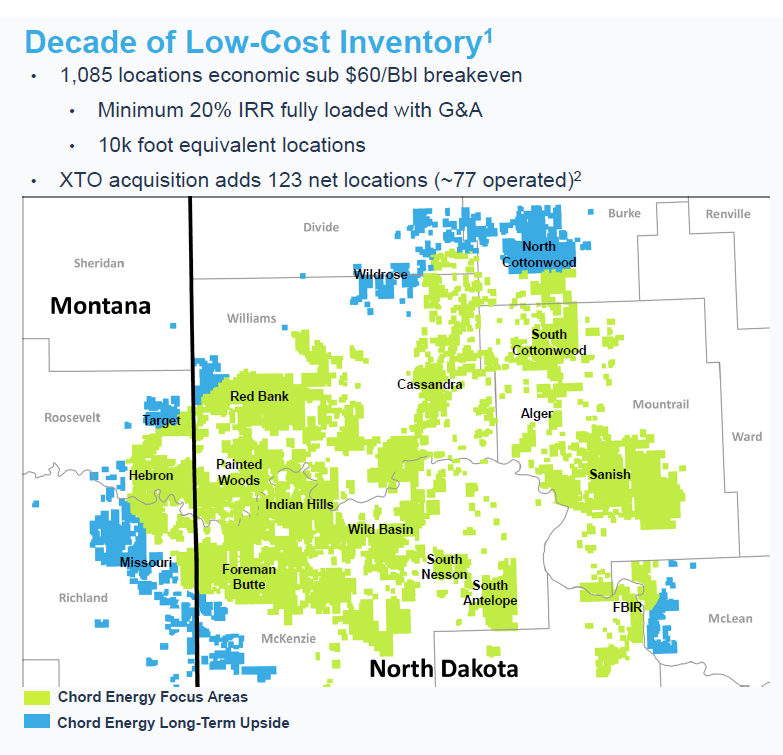
The combined company just recently made an acquisition from XTO Energy in June 2023 where it acquired interests in acreage on the edges of their existing acreage in the Williston Basin. With this acquisition, the company expects to achieve a 20 percent IRR.
Chord Energy Acreage (Chord Energy Presentation)
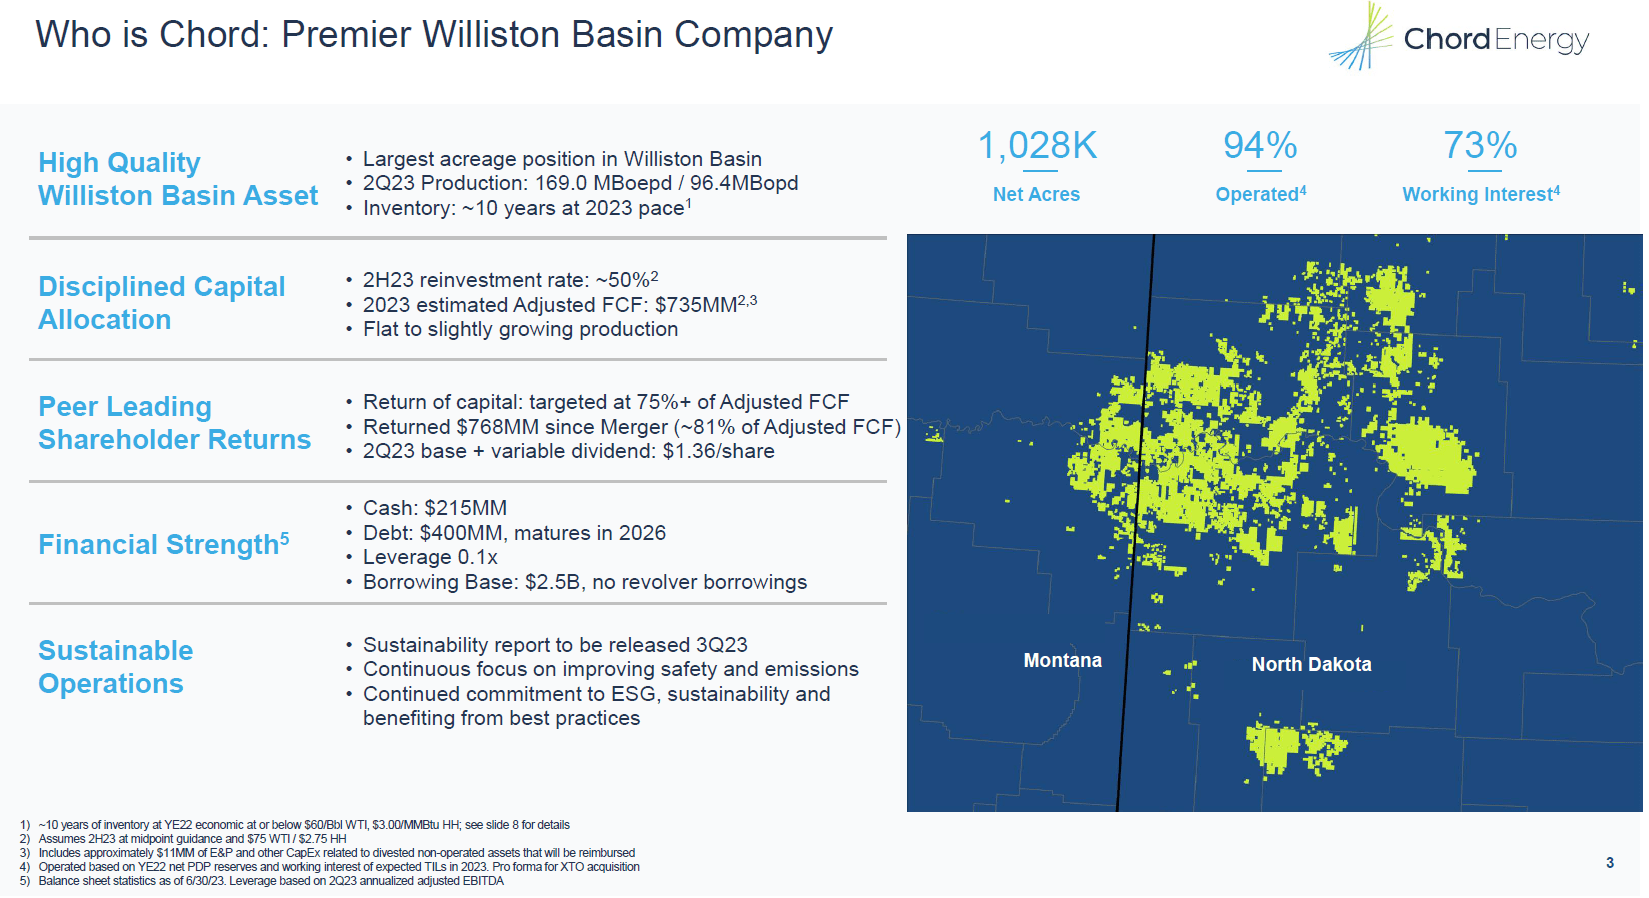
This slide gives a broad overview of Chord. If you are interested in investing purely in a Bakken Shale and Williston Basin play, then this company is one to consider. According to them, they are the largest acreage holder in the play. If they continue drilling at their current pace, they have 10 years of existing drilling inventory. Like many companies, they are focused on disciplined capital management while paying the combination of a base dividend and a variable dividend while remaining flexible to fluctuating hydrocarbon prices.
Chord Energy Highlights (Chord Energy Presentation)
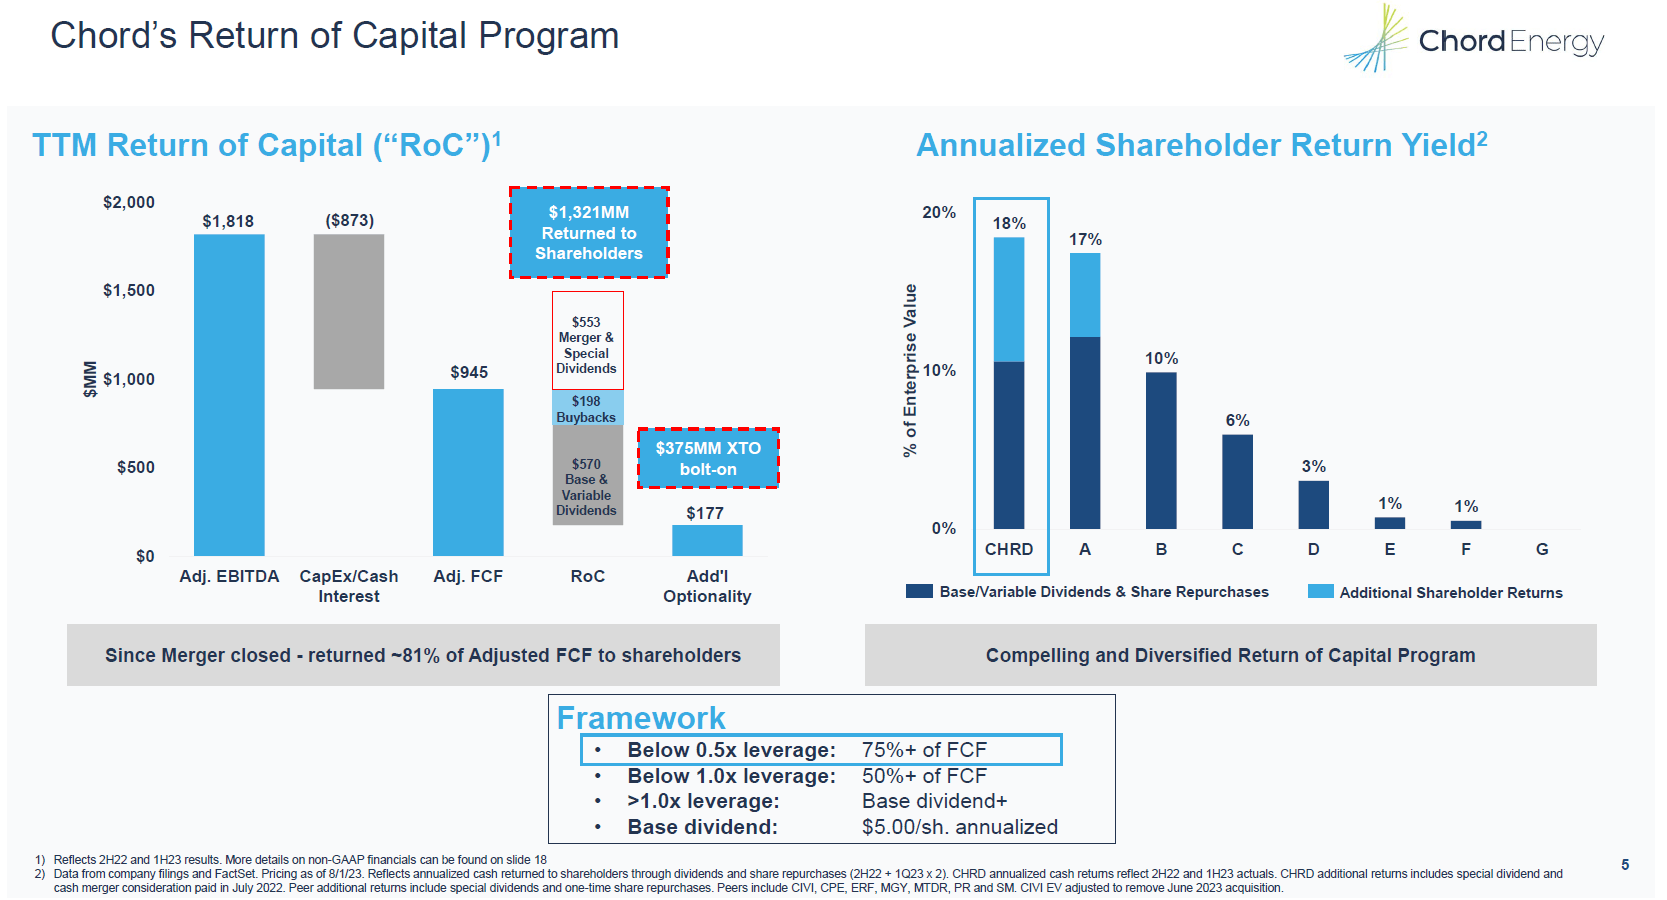
This slide outlines Chord's return of capital program. They are in the mode of returning most of their Free Cash Flow to shareholders in the form of dividends, both base and variable, and share buybacks. This makes up 81 percent of the free cash flow since the two companies merged. Their strong balance sheet gives them the ability to return a large percentage of their free cash flow to shareholders.
Chord Energy Return of Capital Program (Chord Energy Presentation)
Balance Sheet
The company is very disciplined with their balance sheet. With a debt-to-asset ratio of .27, they maintain one of the lowest leverage ratios that I've seen thus far. In a rising interest rate environment, more and more companies will begin to focus on decreasing their debt ratios. This is truly one of Chord Energy's strengths.
| $ millions |
| 2018 |
| 2019 |
| 2020 |
| 2021 |
| 2022 |
| Q2 2023 |
| Assets |
| 7,626.1 |
| 7,499.3 |
| 2,159.0 |
| 3,026.8 |
| 6,631.1 |
| 6,559.7 |
| Debt |
| 3,707.3 |
| 3,662.2 |
| 1,146.3 |
| 1,805.2 |
| 1,951.3 |
| 1,740.1 |
| Debt-to-Asset Ratio |
| .48 |
| .49 |
| .53 |
| .59 |
| .29 |
| .27 |
When you dig into Chord Energy's balance sheet further, you will realize that the company only has $400 million in long-term unsecured debt due June 2026 with a 6.375% interest rate. All of the company's other liabilities are short-term and are adequately covered by the company's short-term assets.
Cash Flow Statement
Here is the track record of Chord's operating cash flows and free cash flow. Following the great oil price crash of 2020, the company rebounded and is now once again deploying heavier amounts of capex to maintain and grow its oil production. I will discuss this further in the article in a comparison to Permian Resources.
| $ millions |
| 2018 |
| 2019 |
| 2020 |
| 2021 |
| 2022 |
| TTM 2023 |
| Operating Cash Flow |
| 997 |
| 893 |
| 299 |
| 914 |
| 1,924 |
| 2,139 |
| CapEx |
| (1,149) |
| (869) |
| (342) |
| (213) |
| (531) |
| (825) |
| Free Cash Flow |
| (153) |
| 24 |
| (44) |
| 701 |
| 1,393 |
| 1,314 |
West Texas Intermediate oil prices reached a high of roughly $120 in 2022 and have since come down into the $80s range. The company's cash flow jumped with oil prices appropriately in 2022 and is remaining steady.
Shares Outstanding
I always like to look at the shares outstanding over a certain timeframe to see how often they sell shares for financing reasons. Since the merger completed in 2022, the company's shares have remained stable and given the strength of the balance sheet and that they are leveraged to oil and not natural gas, dilution is a low risk.
| $ millions |
| 2022 |
| TTM 2023 |
| Shares Outstanding |
| 41.5 |
| 41.4 |
Hedging Programs
Chord has a very light hedging strategy. For a company that doesn't use very much leverage, they can operate without hedging as they can survive dramatic downturns like we saw in 2020.
For a company that uses higher amounts of balance sheet leverage, you might see them using derivatives to manage their risk a bit more aggressively. That is not the case for Chord Energy.
Operations
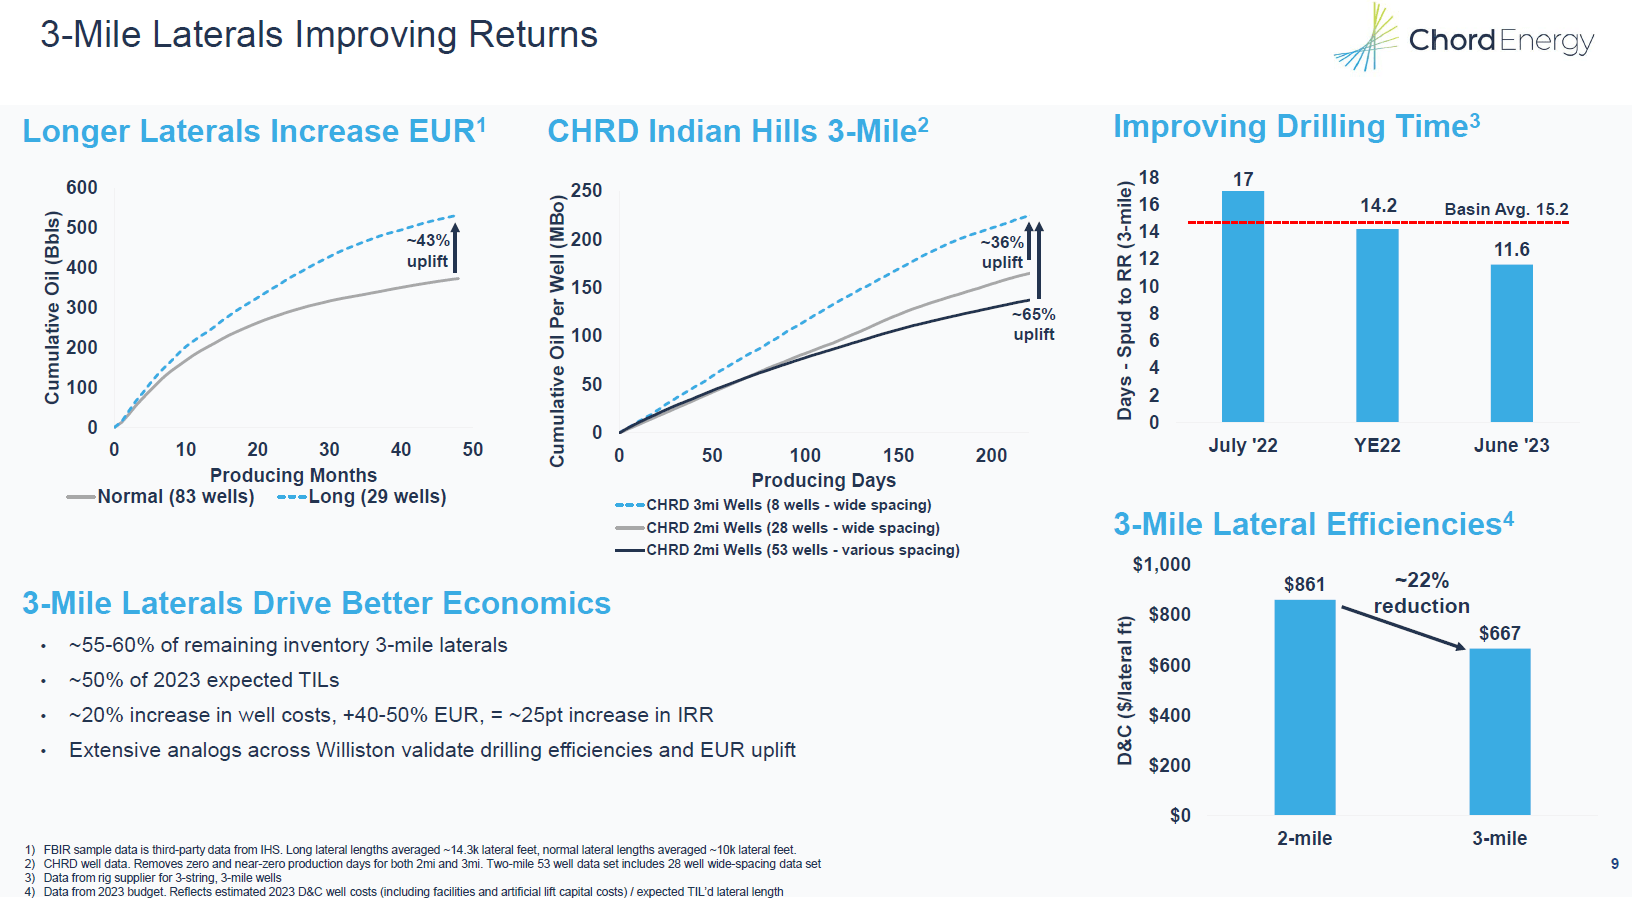
Given the company's laser focus in the Williston Basin, this allows them the ability to fine tune things so that they can generate greater returns. Currently they are doing so by experimenting with longer laterals while at the same time completing each well faster. The longer lateral naturally reduces the cost per foot of drilling.
Chord Energy Improving Operations (Chord Energy Presentation)
They are also seeing greater returns from greater well-spacing. Of course, this means less wells. However, a company could drill 100 wells with narrow spacing with a 2 percent IRR or a 20 wells with wide spacing with a 20 percent IRR. Which one would you rather have?
Chord Energy Decline Curve (Chord Energy Presentation)
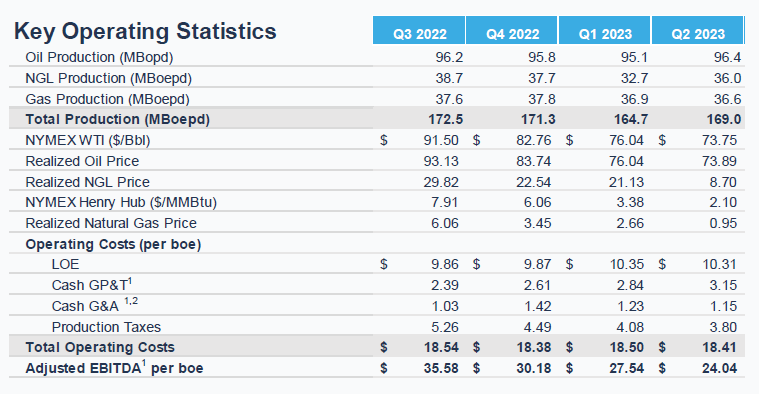
Production
One of the strikes against investing in Chord is that they are behaving very conservatively. As you can see from the table provided below, they are not growing their oil and natural gas production. In future writings, I will continue to watch this and try to understand if they intend to try to growth their oil production more aggressively in the future.
If they simply maintain production and not grow it, the company can still get a good rate of return by doing so and providing a strong dividend which today sits at 3 percent, but this fact turns my attention away from Chord Energy. I would rather focused on companies that are growing cash flows and capex while aggressively trying to grow oil production. At this moment, that does not represent Chord Energy. Chord Energy's performance as a stock will much more depend upon hydrocarbon prices increasing. I am bullish on hydrocarbon prices , but I'd rather have both increasing production and increasing prices.
Chord Energy Production Trend (Chord Energy Presentation)
Comparison to Permian Resources ( PR )
As you read my articles, you will notice that as I'm analyzing a company, I find it valuable to compare to how other companies are performing. Although the Williston Basin is a good place to invest, the question you must ask is, "is it the best place to invest?" And as I share this brief comparison with Permian Resources, I think you will see that the Williston Basin is not providing the same growth rates that the Permian Basin is.
Chord Energy has largely been able to maintain production in this current environment. And ultimately, the company is able to provide attractive returns to their investors via dividends and other returns of capital. However, we are in search of the best returns.
Permian Resources Shares Outstanding
| millions |
| 2018 |
| 2019 |
| 2020 |
| 2021 |
| 2022* |
| Q2 2023 |
| Shares Outstanding |
| 267 |
| 277 |
| 277 |
| 310 |
| 558 |
| 569 |
*Merger between Colgate and Centennial completed
Permian Resources Quarterly Production
Permian Resources most recently reported Q2 results and the merger between Centennial and Colgate didn't complete until Q3 of 2022. They didn't have updated oil production to report on their 10K for 2022. Therefore, we only have two quarters to evaluate their oil production since their merger. This will help us to evaluate whether they are growing oil production faster than a Williston Basin pure-play like Chord Energy.
| per day |
| Q1 2023 |
| Q2 2023 |
| Oil(Bbls/day) |
| 78,332 |
| 84,393 |
| Natural Gas (Mcf/day) |
| 266,374 |
| 275,734 |
| NGLs(Bbls/day) |
| 31,094 |
| 35,502 |
| BOE per Day |
| 153,822 |
| 165,850 |
Permian Resources is currently growing production faster in one quarter than Chord Energy has been doing in one year. This will be something to continue to watch and should clearly give Permian Resources our attention as investors.
Permian Resources Balance Sheet
Similar to Chord Energy, Permian Resources is also maintaining a strong balance sheet. So far, they are growing production without sacrificing the balance sheet.
| $ millions |
| 2018 |
| 2019 |
| 2020 |
| 2021 |
| 2022 |
| Q2 2023 |
| Assets |
| 4,260 |
| 4,688 |
| 3,827 |
| 3,805 |
| 8,493 |
| 8,926 |
| Debt |
| 1,016 |
| 1,418 |
| 1,223 |
| 1,054 |
| 2,836 |
| 3,000 |
| Debt-to-Asset Ratio |
| .24 |
| .30 |
| .32 |
| .27 |
| .33 |
| .34 |
Permian Resources is currently in the middle of closing on an acquisition of Earthstone Resources ( ESTE ) which will bring the company's market cap up from $7 billion to a little over $10 billion. But given that these numbers presented above are without the current acquisition, do you think its appropriate that Permian Resources and Chord Energy are valued roughly the same? They are not quite equal regarding production, as PR trails Chord slightly, but they are relatively close. But one is aggressively growing production and one is not.
Conclusion
Due to the fact that Chord Energy is not growing their oil and gas production, I am going to rate Chord a hold. The company checks a lot of the important boxes for investors. They have a strong balance sheet with disciplined capital management. They are focused on the Williston Basin which is an oil-focused play rather than a natural gas play. However, the Williston is not driving the same returns that the Permian Basin is, based on this analysis.
According to Chord Energy, they have roughly 10 years of inventory if they simply maintain their current rate of drilling, however, it would be nice to see the company increase their drilling in order to grow production. Again, as I learn more about the company I will try to understand why they are not trying to grow production more aggressively. It is nice to see the company doing "bolt-on" acquisitions such as the XTO acquisition but it would also be nice to see them find ways to grow their production. If that means branching outside of their core area of focus, the Williston Basin, then that may be what they need to do. Granted, given the environment where companies like Exxon Mobil (XOM) are hunting for acquisitions, it likely makes for a very competitive environment to find accretive deals, whether organically through the drill bit or by acquisition.
Chord Energy is currently hold.
For further details see:
Chord Energy: At The Mercy Of Rising Oil Prices