CI - Cigna: A Trend Reversal In Operating Margins Is Required
2023-10-24 01:58:31 ET
Summary
- Cigna Group is a leading healthcare and insurance company with a strong presence in the industry.
- The company has experienced significant revenue growth through acquisitions, but EBIT has declined in the past decade.
- Cigna has a strong focus on generating cash flow and offers innovative healthcare services, but caution is advised due to potential risks.
The Cigna Group ( CI ) represents a solid company operating in the healthcare industry, active on the market for more than 40 years. Revenue has grown by double digits (19% CAGR) in the last 10 years also thanks to important acquisitions. EPS also grew significantly (6.9% CAGR) while the most extraordinary figure is represented by the FCF with $38.2/share. This last parameter appears to be the data that most distinguishes company growth in terms of share price. Going into the merits of the operating parameters, we instead notice a discordant trend in EBIT which instead had a worrying decline in the last decade until it reached its lowest point in 2023. In my opinion, this parameter also represents a strong element of risk as the company is burning value organically. This trend does not go well, in my opinion, with the EPS trend and I prefer to wait for any future developments. My rate is Hold.
General Overview
The Cigna Group is a leading healthcare and insurance company in the United States and internationally. Founded in 1982, the company has grown over time through acquisitions and mergers and has established a significant presence in the healthcare and insurance industries.
Cigna offers a wide range of health care services, including health insurance plans for individuals, families, and businesses. It has a global presence and offers services in various countries across the world. The company provides international health insurance solutions for individuals and companies with employees abroad.
Key Acquisitions: In 2018, Cigna announced the acquisition of Express Scripts, one of the largest pharmacy and pharmacy services operators in the United States. This acquisition led Cigna to further expand into the prescription industry.
Cigna has a strong social commitment and is involved in philanthropy and sustainability initiatives. The company focuses on promoting the well-being of communities and the environment.
Like many companies in the healthcare industry, Cigna is adopting innovative technologies to improve access to healthcare services such as Cigna Virtual Care (which allows you to access medical care from anywhere, anytime 24/7), Cigna Care on Demand (which provides access to medical care from home with prescription medications, follow-up visits, and mental health counseling), and Cigna Health Insights (a health management program that uses artificial intelligence to help people stay healthy)
Financial
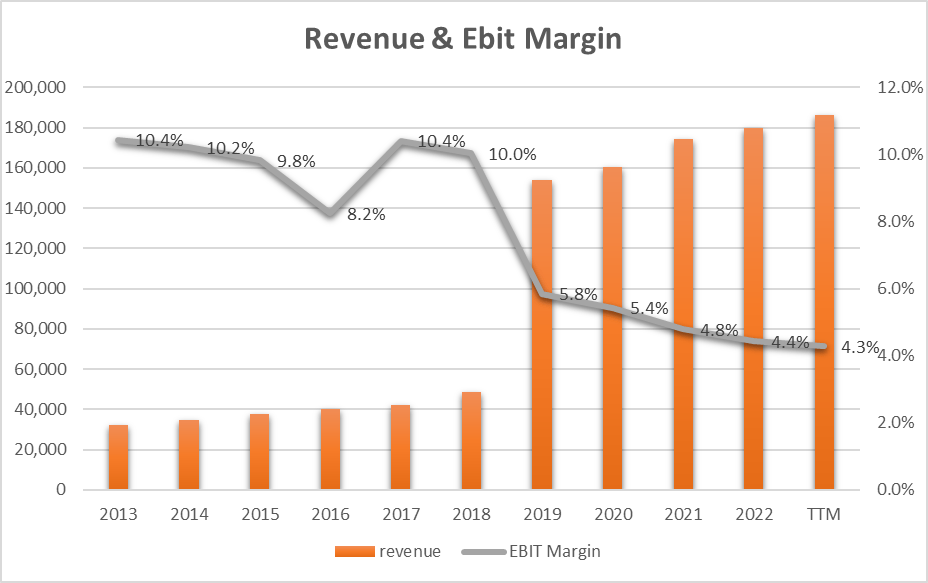
As we can see from the graph, 2019 (following the acquisition of Express Scripts) sees an important leap in terms of Revenue. The Revenue trend is also constant and growing and there are no years of decline. On the other hand, the EBIT trend records a trend exactly opposite to that of revenue. In particular, if we want to analyze the data from 2019 to today we can see how EBIT went from 5.8% to 4.3% with an erosion of 1.5 percentage points. We also note that there are no signs of a reversal of the trend, that is, every year the worst data is always the case.
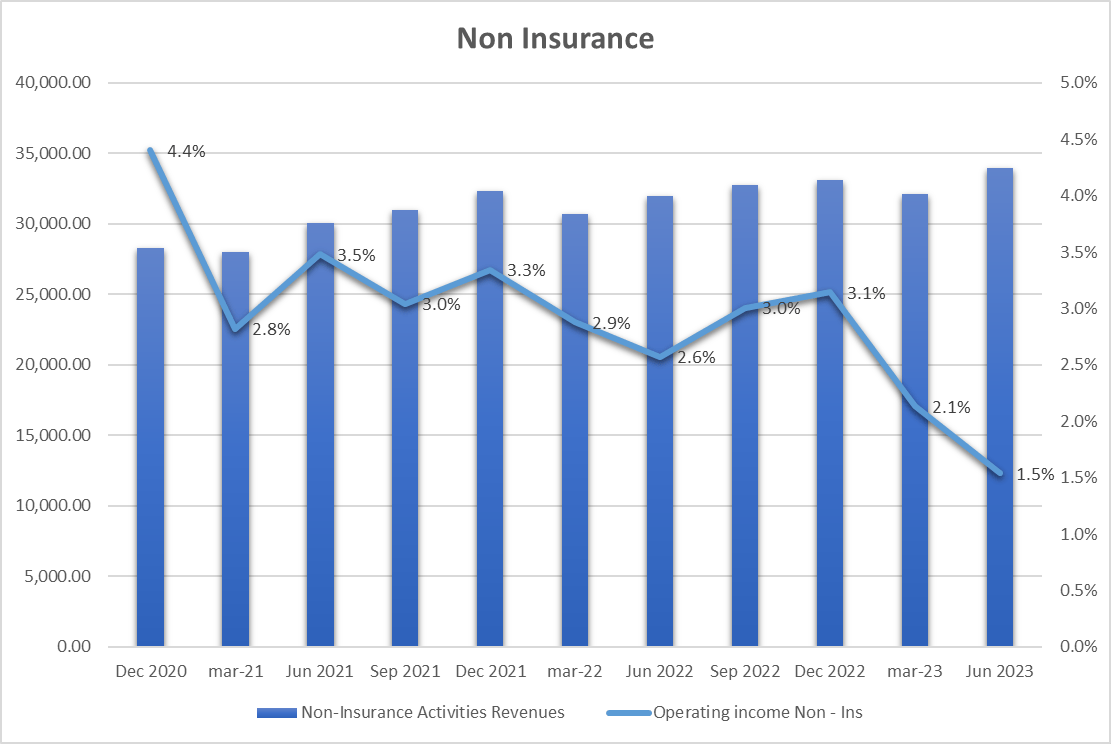
Going into detail over the last 3 years at the Quarter level we can see how the problem is at the level of operating margin in the Non-Insurance sector where, in the face of a growing trend from Revenue, the operating margin has reached the historic minimum figure of 1.5% in Q2-23, a figure more than halved compared to Q4 of 22 (3.1%).
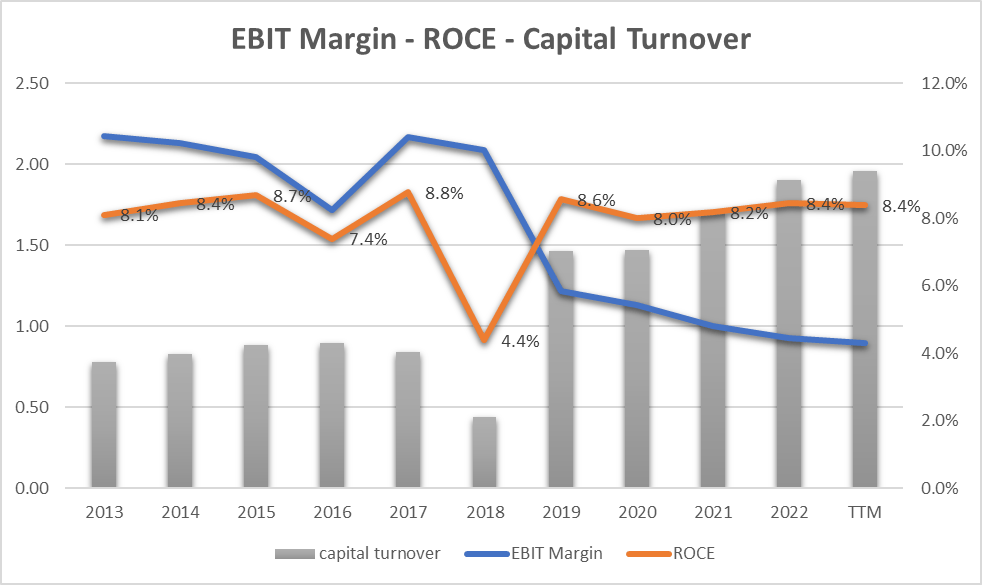
Going into the merits of the capital employed in the company, however, we see that the ROCE has a more stable trend, i.e. it does not follow the negative trend of the EBIT. This is mainly due to the constant growth of the Return of Capital (grey bars in the following graph), i.e. the ability to generate sales for every $1 employed in the company. The 2023 figure is particularly brilliant as it marks the highest peak of the last decade up to reaching the threshold of 2 ($2 generated in sales for every $1 invested in the company).
The company therefore shows an excellent ability to make the invested capital return (and the figure is also growing) while at an operational level, they are pursuing major margin problems, especially in non-insurance products.
EPS and Free Cash Flow
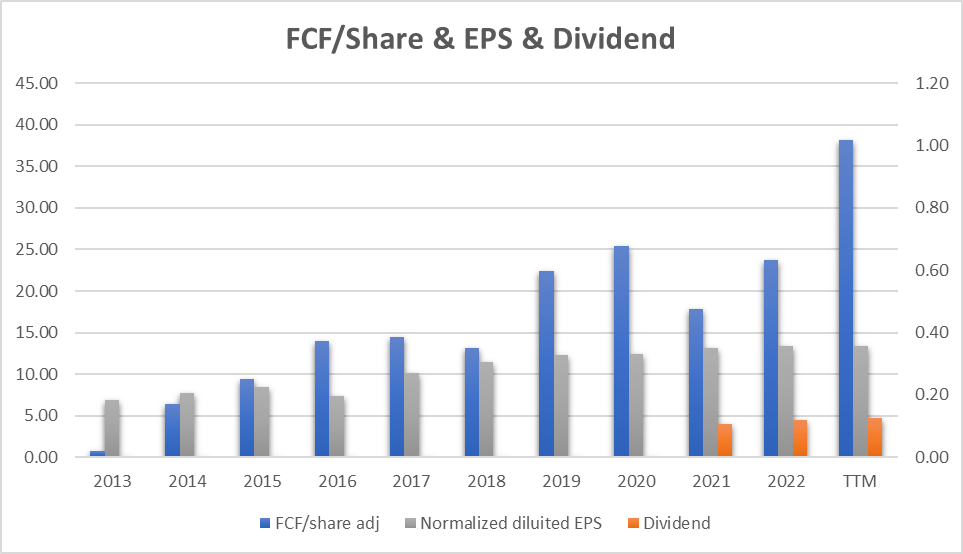
A different and more interesting trend is recorded in the growth of EPS (grey bars) with a growth [CAGR] of 6.9% per year and above all in the Free Cash Flow (blue bars) which reached (2023) a good $38.2 per share compared to an almost zero value compared to 10 years ago. This perhaps represents the most positive element in company management. Cigna is now able to generate enormous cash flow with more moderate EPS growth.
Lastly, we note the growth of the dividend starting from 2021 with a yield that has reached 1.6%.
Going into the merits of how Cigna can generate such a generous Cash Flow we can understand ( Form -10 K ) what the operational Cash Flow consists of:
Operating activities Cash flows from operating activities consist mainly of cash receipts and disbursements for pharmacy revenues and costs, ….
So the non-insurance part that is not able to generate large margins is instead able to generate a huge cash flow.
But it's not just the operational part and reading the explanations of the Form 10-k
Operating cash flows for the year ended December 31, 2022, including the benefits from the delayed 2021 CMS Part D settlement. The remaining increase was driven by the timing of accrued liabilities and lower income tax payments, partially offset by lower insurance liabilities and higher inventories.
More specifically, a “CMS Part D settlement” could result from a dispute between a Medicare beneficiary and his or her prescription plan regarding coverage of certain drugs or prescriptions. This in addition to other non-operational effects such as lower income tax payments and the timing of accrued liabilities lead us to think that some extraordinary elements are in place that have contributed substantially to increasing the FCF parameter.
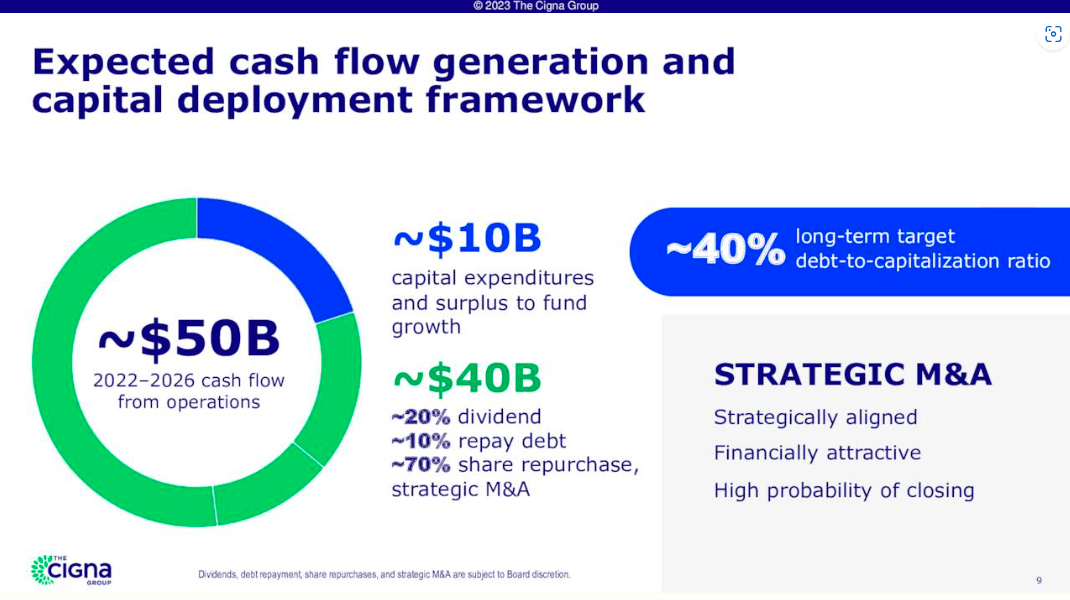
The Cigna Group 2023 Q2 - Results - Earnings Call Presentation
Looking at how this liquidity will be used we can see how a small part (20%) will be allocated to organic growth (Capex & Growth) while the remaining part (80%) will be allocated in particular to Share repurchase or M&A.
This last aspect (share repurchase) explains how, in the face of a decreasing trend in EBIT, it was possible to grow EPS while regarding M&A it will be necessary to evaluate any impacts on the financial statement data to advance any hypotheses.
The company will therefore be able to increase shareholder value almost exclusively through share buyback activities.
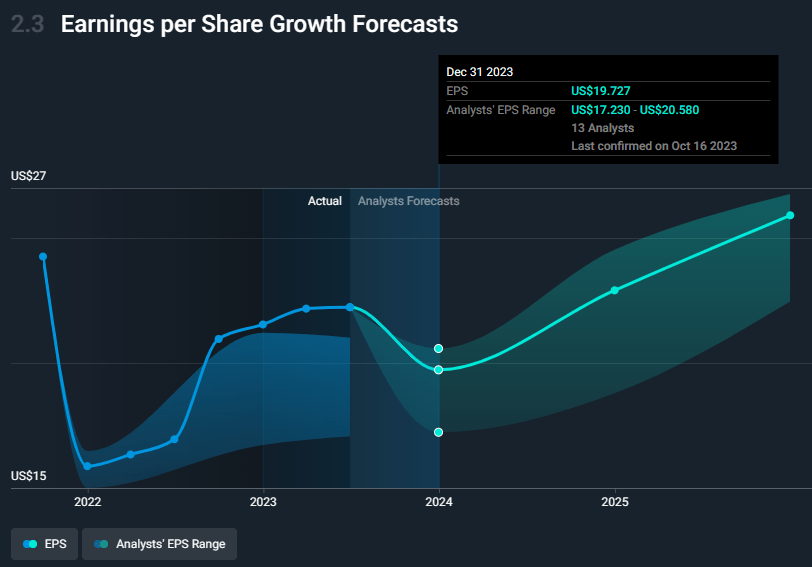
To evaluate the possible future growth of EPS we can look at the following graph which projects the trend hypothesized by the analysts.
We see that the end of 2023 could see a decline while growth at a rate of 5.1% per year should start again from 2024. Note how the range (minimum-maximum) hypothesized by analysts was beaten by the company during 2023.
Price share evaluation
CI and Earnings Power Value
Assuming that the cash profit remains constant over the long term, I use the EPV (earnings power value) method to calculate the intrinsic share price value.
The method starts with EBIT. The second step is to add depreciation and amortization and then subtract stay-in-business CAPEX.
The result is the Cash Trading Profit
I then subtract the taxes by calculating the amount using the actual tax rate that the company pays.
The result is the After-Tax Cash Trading Profit
To calculate the total company enterprise value I divide the After-Tax Cash Profit by the interest Rate I define as fine for this kind of Company (according to a study made by NYU, the cost of capital for Insurance is 9.53%)
The result is the Total Company Earnings Power Value. Dividing the result by the total number of shares we find the value per single share.
The table below shows the calculation for the CI
| EBIT |
| 7,975.00 |
| Dep & amort |
| 324.00 |
| CAPEX |
| -1,488.00 |
| Cash Trading Profit |
| 6,811.00 |
| TAX |
| 18.20% |
| TAX |
| -1239.6 |
| After TAX cash profit |
| 5,571.40 |
| Interest Rate |
| 10% |
| EPV |
| 58461.68 |
| Share in issue |
| 295.70 |
| EPV per share |
| 197.7 |
$197.7 represents the share price valuation using the EPV method. If we compare the data with the current market price ($306) we see that the current price could be seen as very expensive. However, this evaluation could be misleading as it is mainly based on Earnings and EPS. We have seen how cash flow generation is another very important and characterizing element of Cigna's business and therefore we also use the method based on FCF/Share as a comparison.
Free Cash Flow evaluation
The formula is:
Maximum buying price = Cash profit per Share/interest rate – 20% (safety discount)
If TTM Cash Profit per share is $38.21
Interest Rate= 9.53%
Maximum price before Safety discount = 38.21/9.53%= $400.9
The maximum price at 20% discount = $334
Under the FCF analysis, it seems that the actual price of $306 is cheap.
These two analyses compare how the share price can be very expensive if we evaluate it on the ability to create Earnings per share while if we base ourselves solely on the ability to create Cash Flow the perspective changes completely. This could also underline how the two parameters are not exactly aligned (we have seen this above all in terms of trends) and this could indicate the need to wait for a clearer period to make any decisions regarding the evaluation of the share price.
Peer comparison
The main competitors identified for this analysis operate in similar or related sectors and compete for customers, insurance contracts, and healthcare services.
• UnitedHealth Group Incorporated ( UNH ): A major player in the health insurance and healthcare services industry in the United States. It offers a wide range of insurance plans, medical services, and health benefits management services.
• Humana Inc. ( HUM ): is a health insurance company that offers Medicare Advantage plans, Medicaid plans, and other health care services.
• Aetna ( CVS ): Part of CVS Health, is involved in health insurance and integrated health services. This merger created a combined entity that offers insurance services and healthcare services in one package.
• Molina Healthcare, Inc. ( MOH ): Specializes in managing government healthcare programs, including Medicaid and Medicare.
• Centene Corporation ( CNC ): A healthcare services company that operates through government programs, health insurance plans, and healthcare benefit management services.
Using Seeking Alpha's Ratings we can see how different companies have different rating profiles. CI, HUM, and MOH are going through a favorable moment with a 'Strong Buy' while the others CVS, UNH, and CNC are in 'Hold'.
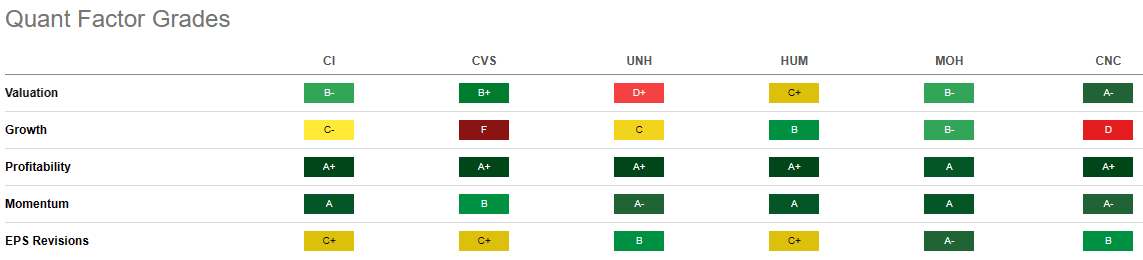
Going into the merits of the Grades, we immediately notice that the sector is going through a very positive moment in terms of Profitability (all companies have an 'A+') and Momentum (where only CVS has a 'B'). Compared to competitors, we are penalized in terms of Growth and EPS which are the same parameters that raised a red flag in the previous paragraphs of this article. While compared with peers it is also attractive in terms of valuation.
In general, CI could be a good investment opportunity if you want to invest in Health Care and Services but you need to pay attention to the performance of EPS and Growth.
Risks
Investing in CI does not involve major structural risks as it is a very solid company well established in the reference business. The biggest risk in my opinion is represented by the share price when compared to the EPS growth forecasts for the next quarters. In other words, buying even a good company at too high a price is never a good deal and this could be a big risk if the operating margin part does not reverse the trend in terms of future growth.
Bottom Line
Cigna Group represents a solid reality operating in health care. It has grown in terms of Revenue over the years also thanks to M&A. It is also able to increase EPS and above all Free Cash Flow. From 2021 it will also pay an interesting dividend. Based on the analysis carried out, the profitability parameters (EBIT) instead show an inverse trend, reaching the minimum peak of the last 10 years. This combined with a share price evaluation that could be less than advantageous puts me in a waiting period ((HOLD)).
For further details see:
Cigna: A Trend Reversal In Operating Margins Is Required