CI - Cigna: Buy During The Next Correction (Technical Analysis)
2023-08-07 21:41:17 ET
Summary
- Cigna's financial results for Q2 2023 show a decline in net income and adjusted income from operations due to losses from divested businesses.
- Despite the decline in income, total and adjusted revenues have surged, driven by Evernorth Health Services and Cigna Healthcare.
- Cigna's long-term trend remains bullish, and market corrections may present attractive buying opportunities.
The Cigna Group ( CI ), a global health service provider, unveiled its financial results for the recent quarter, painting a nuanced picture of success and challenges. With shareholders' net income and adjusted income from operations both showing a decline, reflecting losses from divested businesses, the figures revealed a mixed landscape. However, a surge in total and adjusted revenues showcased the strength of Evernorth Health Services and Cigna Healthcare, despite some shortcomings. This article conducts a technical analysis of Cigna's stock price to determine the company's next trajectory and identify appealing investment levels. The long-term trend for Cigna appears to remain firmly bullish, and any market correction may present attractive buying opportunities.
Financial Performance and Mix of Progress and Challenges
Recently, Cigna disclosed its financial figures for Q2 2023, which illustrated a blend of progress and obstacles across its varied business segments . During Q2 2023, Cigna reported a shareholders' net income of $1.5 billion or $4.92 per share , showing a slight dip from the $1.6 billion or $4.89 per share observed in Q2 2022. Moreover, the quarter's adjusted income from operations settled at $1.8 billion or $6.13 per share, down from $2.0 billion or $6.20 per share during the same quarter in the previous year. These shifts in vital financial metrics were primarily influenced by the missing income from businesses that have been divested.
Nonetheless, Cigna experienced a positive trend in its total and adjusted revenues, showcasing a 7% rise from Q2 2022. The surge can be largely credited to the significant contributions from Evernorth Health Services and Cigna Healthcare, despite the revenue void left by the divested businesses. That said, this very void also led to a 6% and 8% fall in shareholders' net income and adjusted income from operations, respectively, relative to last year. Despite the drop in net income for Q2 2023, the long-term profitability is still on the positive track as seen in the chart below.
Evernorth Health Services, a branch offering an array of health services, noted a 10% increase in adjusted revenues in Q2 2023, compared to the same quarter of 2022. This increment was largely spurred by substantial organic growth in specialty areas and care delivery and management solutions. However, the pre-tax adjusted margin observed a slight dip from 4.2% in Q2 2022 to 4.0% in Q2 2023, reflecting the strategic investments made in technology. Moreover, Cigna Healthcare saw a 12% rise in adjusted revenues compared to Q2 2022. This increase was propelled by an expansion in clientele and premium rate hikes aimed at offsetting underlying medical cost trends. Yet, the pre-tax adjusted income from operations dropped by 5%, mainly due to an escalated estimated risk adjustment payable in the Individual business and a decrease in net investment income.
While Cigna has exhibited significant growth in areas like Evernorth Health Services and Cigna Healthcare, it also faces clear hurdles due to the lack of income from divested businesses and specific operational adjustments. The organization might tread carefully in the coming quarters, maintaining a focus on profitability while strategically investing for sustained growth.
Exploring Historical Perspectives through Analysis
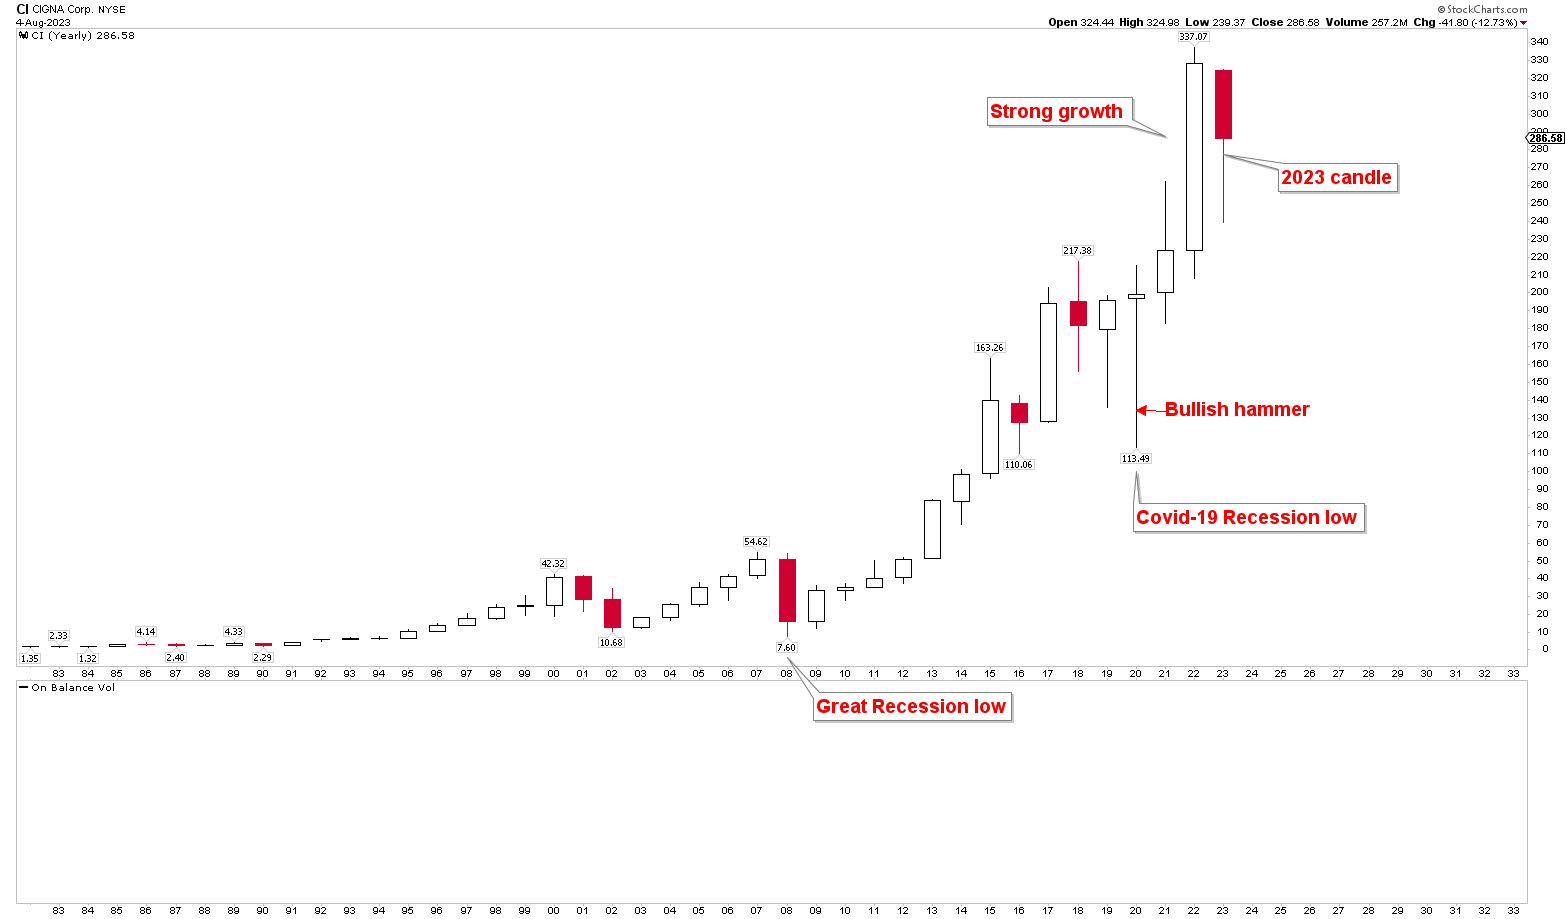
A close examination of Cigna's long-term perspective reveals a distinctly bullish trend, evidenced by the yearly chart. In 2008, the stock price plummeted to a low of $7.60 following the Great Recession. This drop wasn't simply a single event but resulted from complex interplay. A massive loss of jobs led to fewer people with employer-sponsored health plans, slashing Cigna's revenue. Simultaneously, financial market uncertainty, tighter credit conditions, and lower consumer spending shook investor confidence. Together, these factors created a tough climate for Cigna, mirroring struggles across the health insurance and financial sectors, resulting in a temporary dip in its stock price. However, this dip in price established a long-term bottom, leading to a higher price as the economic conditions began to recover.
Another price dip was observed at $113.49 during the Covid-19 recession in 2020, but this dip was also firmly reversed, leaving a bullish hammer candle that year. Cigna's stock price rose robustly after this recession. This growth was fueled by several elements. An unparalleled demand for health services and a pivot towards telehealth, areas where Cigna has major stakes, set the stage for the company's quick adaptation to pandemic-driven healthcare changes. Government aid and economic stimulus packages, along with Cigna's diversified approach and strategic management, allowed the company to navigate economic uncertainties, resulting in some strong financial performances. All these factors coalesced to attract investors and boost Cigna's stock price following the Covid-19 recession.
The latest data from 2023 shows a correction that has shifted into positive territory, indicating a move above the all-time high of $337.07 may trigger another strong rally in Cigna.
Understanding the Bullish Move and Identifying Key Levels
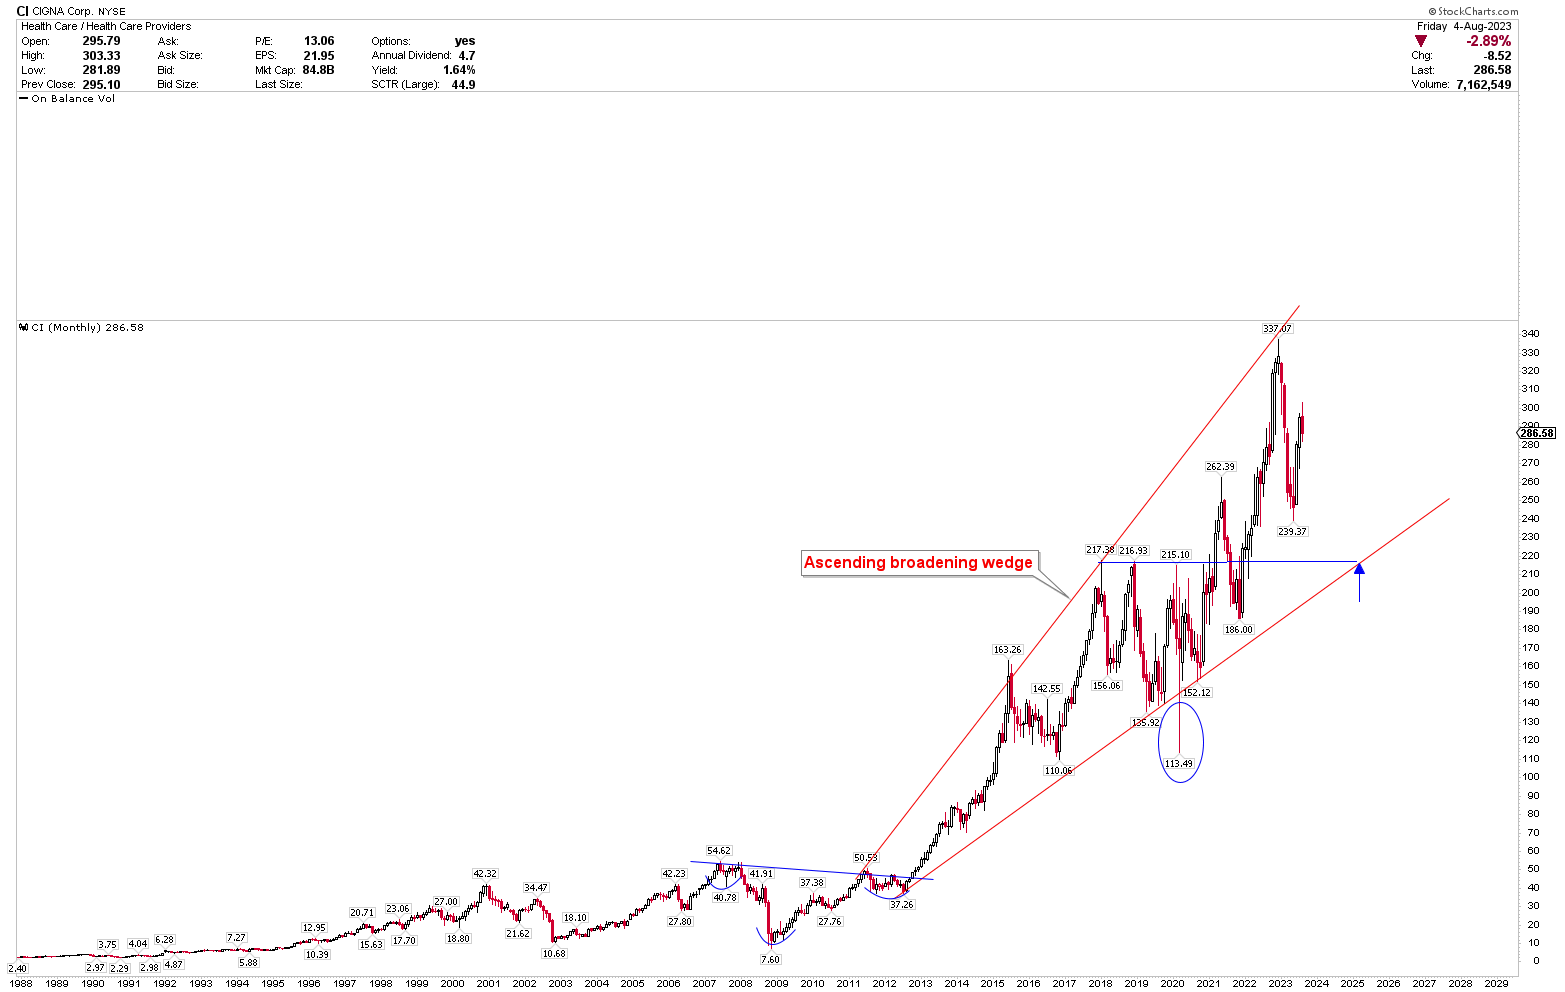
Cigna's bullish trajectory can also be observed in the monthly chart, showcasing an inverted head and shoulders pattern during the Great Recession's bottom, with the head at $7.60 and shoulders at $40.78 and $37.26. This pattern broke in 2013, sparking a remarkable 10-year rally to all-time highs. A broadening wedge pattern further supported this rally. Although the quick Covid-19 recession drops briefly dipped below the wedge line, it swiftly reversed, closing above it to demonstrate strong price action. The all-time high at $337.07 was met with substantial resistance from this ascending broadening wedge, and the price correction settled at $239.37. Now, the price appears poised to climb once again. However, keen-eyed investors should watch the strong support level at $215 as a significant buying opportunity for long-term prospects.
For a deeper analysis, the weekly chart illuminates a rising blue trendline, with a bottom already established at $239.93, which aligns with the support of the 38.2% Fibonacci retracement level, calculated from the Covid-19 lows to all-time highs. With no two successive weekly closes below this Fibonacci retracement and price supported at this level, and RSI above the mid-level of 50, bullish market sentiments are evident. Investors may find buying at current levels attractive and could consider adding positions if the market approaches the $215 support level. The upward trajectory for Cigna seems poised to continue in the long term.
Market Risk
Cigna's growth in adjusted revenues across key branches has been fueled primarily by organic expansion and hikes in premium rates. This strategy, while successful so far, poses risks should the company falter in maintaining growth in its specialty areas or face regulatory impediments that limit its ability to raise rates. The sensitivity of Cigna's stock price to broader economic conditions, illustrated by reactions to the Great Recession and the Covid-19 crisis, further emphasizes the vulnerability of the company to global economic uncertainties and potential downturns.
Adding to the complexity of Cigna's risk profile is the regulatory landscape of the healthcare industry. As a key player in the U.S. Commercial and U.S. Government sectors, changes in healthcare laws, regulations, or policies could have profound impacts on its operations, placing additional pressure on the company to adapt and comply.
The competition also looms large for Cigna. The fiercely competitive healthcare market requires constant innovation and strategic positioning. Emerging strong competitors and shifting market dynamics in vital segments like health services and care delivery may challenge Cigna’s standing, necessitating robust strategies to maintain its competitive edge.
From a technical perspective, the investment landscape for Cigna is delicately poised. An inability to break through all-time highs may stall the company's long-term bullish trend. Meanwhile, any significant drop below the $215 mark could negate the immediate term bullish trend, signifying the potential for future declines. This technical analysis encapsulates the intricate balance Cigna must navigate, threading between growth opportunities and multifaceted risks that could shape its market position and financial future.
Bottom Line
Cigna's recent financial results and market position reveal a complex tapestry of growth, adaptability, and challenges. The company's marked expansion in key areas such as Evernorth Health Services and Cigna Healthcare demonstrates a strong potential for continued success. Simultaneously, it has to grapple with the loss from divested businesses, regulatory complexities, and a competitive healthcare market that requires vigilance and agility. The historical analysis underscores Cigna's resilience and ability to bounce back from global economic challenges like the Great Recession and the Covid-19 crisis. Its strategic investments in technology and diversified approach have positioned it well for current market trends, even as it must be mindful of potential downturns and regulatory shifts.
From a technical perspective, Cigna appears poised for continued bullish momentum, though key support and resistance levels must be carefully monitored for signs of change. The appearance of an inverted head and shoulder pattern historically indicates long-term bullish trends, suggesting the possibility of price continuation for another decade. The identified long-term support level of $215 presents a substantial opportunity for long-term investors. The yearly chart suggests that the price might continue to climb higher. Investors can buy Cigna at the current levels and consider adding more positions if the market dips toward $215.
For further details see:
Cigna: Buy During The Next Correction (Technical Analysis)