CI - Cigna: Buy Rating Driven By Undervaluation & Revenue Growth
2023-10-01 10:09:35 ET
Summary
- Cigna (CI) gets a Buy rating today.
- Strengths: dividends, valuation, revenue growth, net income & EPS, share price vs moving average, capital & liquidity.
- Offsetting factors: price performance vs S&P 500.
- The downside risk of exposure to bonds / debt-securities has been discussed.
Analysis Summary
In today's analysis, I will be covering The Cigna Group ( CI ) , in the healthcare sector, subsector of health care services .
The Connecticut-based company trades on the NYSE and has roots dating to 1792. It provides insurance and related products and services in the US, according to its company profile . One of its listed peers is CVS Health ( CVS ).
I gave this stock a buy rating, due to having more strengths in my review than offsetting factors.
Strengths: dividends, valuation, revenue growth, net income & EPS, share price vs moving average, capital & liquidity.
Offsetting factors: performance vs S&P500.
A risk to my bullish outlook that I identified is the firm's exposure to debt-securities in its asset portfolio.
My rating methodology is to analyze the stock holistically across the following 7 categories of equal weight, and if it has more strengths than offsetting factors it gets a buy rating:
dividends, valuation, revenue growth, net income & EPS, capital & liquidity, share price vs moving average, performance vs S&P 500.
Dividends
In this section I will go over the dividend yield, dividend growth over 10 years, and dividend stability of steady payouts. As a dividend-focused analyst and investor, I believe these are vital metrics to look at.
Though not all investors are dividend-oriented, I think it is an opportunity to generate regular cashflow from holding a stock longer-term.
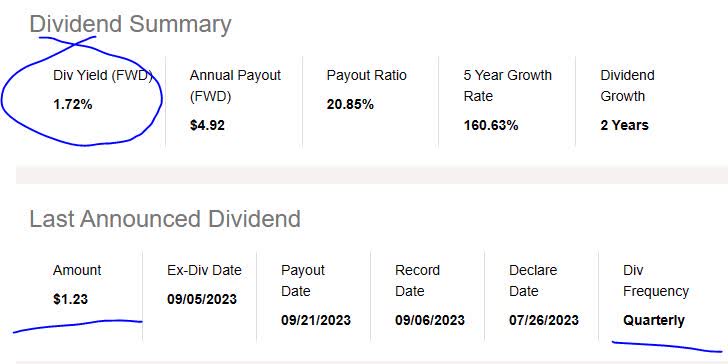
First, let's look at the yield, which is 1.72% as of this article, along with a dividend payout of $1.23 per share on a quarterly basis.
In comparison to its sector average, this yield is 4.9% above the average. I consider this a positive point and I think a reasonable dividend yield would be between 1.5% and 2.5% when considering the sector/industry. With that said, a yield closer to 1.75% where this stock falls is a moderately attractive one.
Cigna - div yield vs sector (Seeking Alpha)
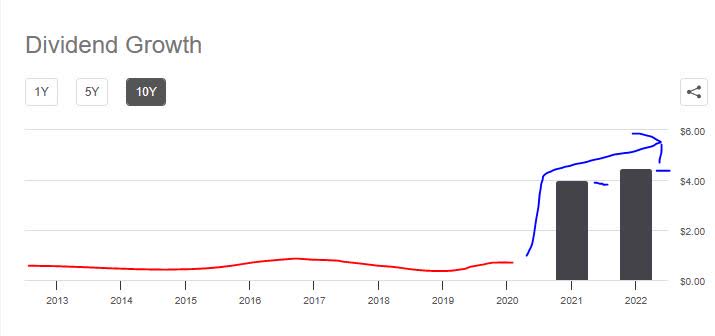
Next, I am looking at the 10-year dividend growth rate, shown in the chart below, which shows a long period when little to no dividends were paid by this company, to then starting to pay them in 2021 and growing since then. I think that is a major turnaround and I always look for a good turnaround story to tell.
Finally, I want to see dividend payout stability, especially since many of my readers rely on the stable dividend income that these types of stocks offer.
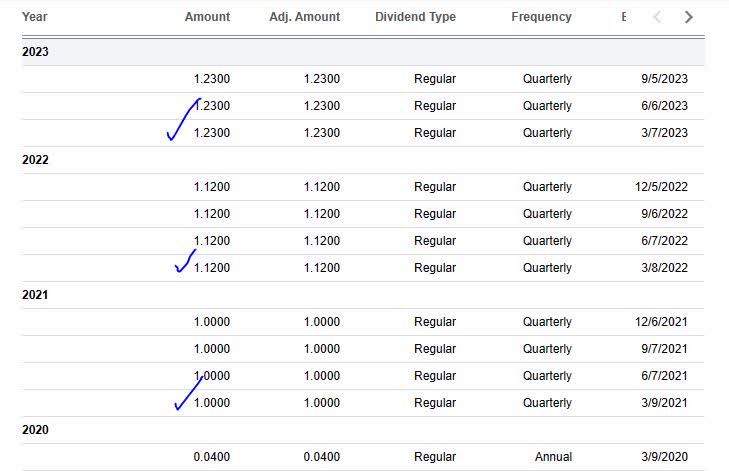
In looking at the table below, you can see stable payouts over the last few years, with 3 dividend increases in this time. For someone holding 1,000 shares, for example, they can realize just over $1,200 in quarterly cashflow from dividends on this stock. (1,000 shares x $1.23 per share).
Based on the evidence, I consider the category of dividends a strength for this stock, on the basis that the stable quarterly payouts and dividend growth shows promise as well as the dividend yield being above average for this sector.
Valuation
To analyze the valuation, to simplify things I have chosen a single metric to focus on, and that is the price-to-earnings ratio (P/E) , both the trailing and forward P/E, as it tells me what the market is pricing this stock at in relation to its earnings.
Although a lower-than-average P/E may indicate the market is having lower confidence in the forward earnings potential of this stock, it also presents a value-buying opportunity, in my opinion, if most of the other fundamentals are strong as well however.
Cigna - P/E ratio (Seeking Alpha)
Considering that the TTM P/E of 13.02 is 55% below the sector average , and the forward P/E of 14.5 is 44% below the sector average , I consider this stock greatly undervalued compared to its industry, both on a trailing and forward basis. Compared to its listed peer CVS , that firm's forward P/E is near 61% lower than the sector average.
Based on the data, I think this valuation metric is a strength for this stock and I see it as an opportunity rather than the market being pessimistic about earnings.
Revenue Growth
Now, we've come to a topic many analysts & investors look at, which is the top-line revenue growth. Because this metric essentially shows money made before expenses & taxes, it does not indicate this firm's effectiveness at managing costs, but at growing its revenue side of the house.
Growth is important, in my opinion, because companies have competition and are striving to capture market share in their space.
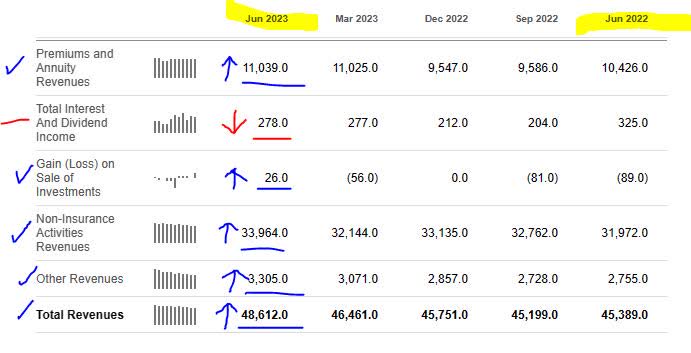
For this company, we can see from the most recent quarterly results that it achieved a YoY increase in total revenue :
Also, in looking at revenue growth by different business segments, we can see the following positive data points in the graphic: the core business of revenue from insurance premiums grew YoY, but so did gains on investments sold and "other" revenue sources.
Surprisingly, in this high interest-rate environment, their interest revenue actually dropped on a YoY basis, while other insurance firms I rated recently often times have a YoY increase in interest income. When digging further, from the company balance sheet it appears their investment holdings in debt securities (which usually generate interest) has dropped in Q2, so this could explain it.
Overall, I think the data shows that top-line revenue YoY growth is a strength for this stock's rating.
Net Income & EPS
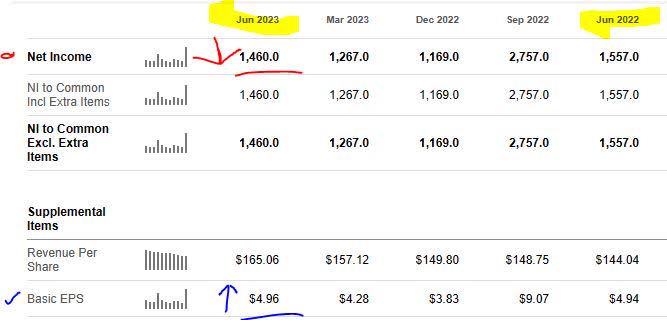
I wanted to separate the bottom-line data from top-line revenue, so net income & earnings per share get their own section here to make the analysis easier to understand.
What is interesting is that looking at the most recent quarter, this firm achieved a very slight YoY drop in net income however the basic earnings per share increased slightly YoY .
I also want to call out the following: the company in their 2023 full-year guidance has adjusted it estimate and expecting an APS of $24.70 for the full year. I think this is a sign of confidence from their Q2 presentation .
Cigna - full year EPS guidance (company quarterly presentation)
I think that although net income dropped it was such an inconsequential level that I would not consider it a major offsetting factor, so I think this category of net income & EPS is a strength for this stock's rating.
In particular, you can see that the company achieved 2 straight quarters of net income growth since Dec. 2022.
Capital & Liquidity
In this section, we want to focus on the fundamentals of whether this company is well-capitalized, has positive equity, positive cashflow, and so on. I think these are important factors to consider and are among the very basics of any serious business.
From the following, I gather that the company generated $2.5B in operating cashflow in Q2, and so far this year had the capacity to repurchase 3.8MM shares. This is another sign of the ability to return capital back to shareholders, since share repurchasing on a large scale typically helps stabilize and even increase the share price, benefitting current stockholders.
Cigna - capital deployment (company q2 presentation)
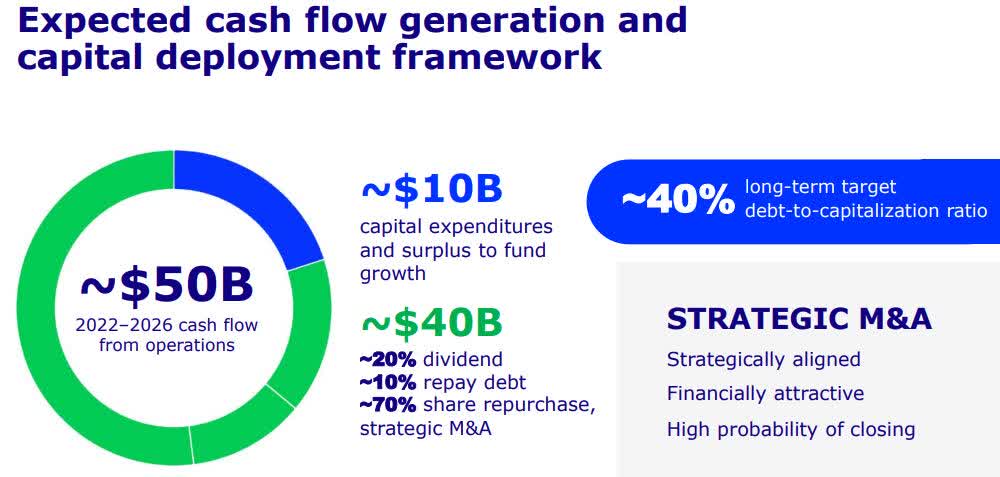
Further, I am looking at the following graphic from the Q2 presentation as well, showing a target goal of reducing long-term debt but also having the financial ability to fund business growth. I think their positive outlook on cashflow from operations also adds confidence to my sentiment about this firm.
Cigna - capital deployment framework (company q2 presentation)
Further, from its cashflow statement we can see that the firm has positive free cash flow (both levered & unlevered) as well as positive free cashflow per share.
Cigna - cashflow (Seeking Alpha)
From its balance sheet , the company ended Q2 with $9.58B in cash, $150B in total assets, $104.5B in total liabilities, leaving $45.5B in positive equity. I think that the positive equity along with the positive cashflow definitely adds confidence that this is a serious firm and worthy of investment consideration in my portfolio.
Based on the evidence found, I consider this firm's capital & liquidity situation a strength to its overall rating.
Share Price vs Moving Average
In this section, I am looking for a value-buying opportunity with this stock based on my new portfolio strategy focused on trading crossovers below the 200-day simple moving average ("SMA").
In my strategy, I consider a 5 to 10% drop below the 200-day SMA, after a period of bullishness, a buying signal . However, a price hovering around the moving average or a few points just above it may also present an opportunity.
To see if my investing idea holds water, I put it to the test and made a fictitious trading scenario.
So, let's take a look at the current price chart:
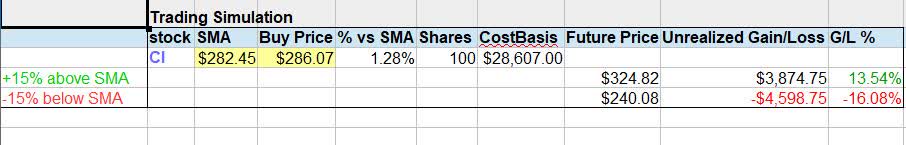
The share price as of the writing of this analysis is $286.07 , which is 1.28% above the 200-day SMA of $282.45 . At first glance, it appears that I just missed an opportunity to buy during a crossover back in August when it dipped below the average.
Because we cannot always sit around waiting for the perfect crossover to occur, I created a portfolio strategy that aims to limit exposure to unrealized capital losses (paper losses).
Using the chart above, I created the following trading simulation where I buy 100 shares at this price and hold for 1 year, with a goal of achieving an unrealized capital gain at that time within a range of 5% to 20% or better. At the same time, my maximum loss tolerance is an unrealized capital loss of 20%. *Note: this is not an actual capital loss but just a paper one, though it would impact my overall portfolio value.
In the above simulation, I am testing what gains/losses would occur if the future share price (in Oct. 2024) rises 15% above the current 200-day SMA, and if it drops 15% below that same SMA.
The outcome? I am projecting unrealized capital gains of $3,875 and potential unrealized capital losses of $4,599. Both outcomes are in line with my portfolio goals & loss tolerance, since essentially the two scenarios project either a 13.5% capital gain or a 16% capital loss scenario.
Here is a handy illustration of the above gain & loss scenarios and how they would look on the chart. As you can see it, my projected unrealized loss is just above my risk tolerance of a maximum 20% loss.
Cigna - trading simulation - loss limit (author analysis)
The importance of testing both gains & losses, in my opinion, is that both can and have occurred, which I know from experience. Actual results may vary, but think of this more like a simplistic framework to think about long-term investing and establish a risk tolerance and a profit goal.
Based on this simulation, I think the current share price is a strength in my overall rating, and still is within the zone for a buying opportunity.
Performance vs S&P 500
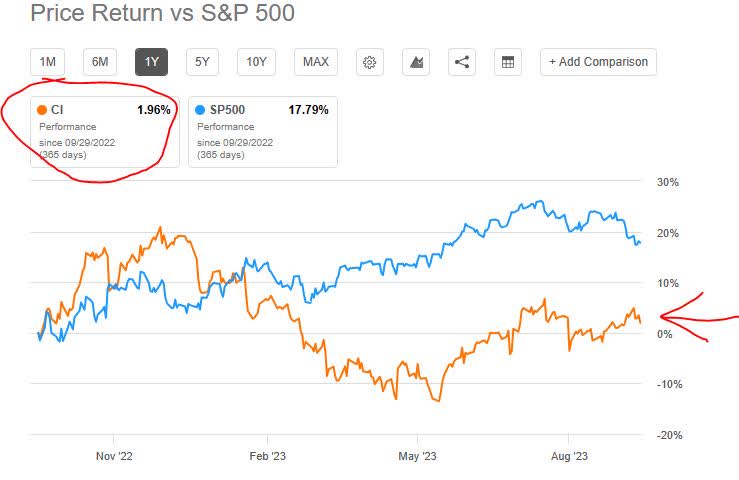
The following is a comparison of the 1-year price performance of this stock vs the S&P 500 index. I have included this metric in my updated rating methodology so as to compare this equity to a major market index that is tracked constantly.
I think that this data shows the stock underperforming vs this index , which I consider an offsetting factor to my rating.
In fact, as the chart shows it has been underperforming vs this index for quite a long time, with the S&P seeing a 17.8% price return since Sept. 2022, and this stock only seeing around 2%. That is a major difference.
I think a major factor is the downward trend that occurred this spring when the financial sector stocks took a hit in the wake of the regional bank failures, and the line chart above correlates with that it seems. Although Cigna is not a regional bank but in the insurance space, as an insurer it can still be considered in the overall "financial" space.
Risk to my Outlook
A risk to my bullish outlook would be the following downside risk :
As with many insurance companies I covered, this one has a sizeable investment portfolio. Although it does not provide any quarterly materials that break down investment exposure by categories, its balance sheet on Seeking Alpha indicates the firm holds debt securities as well as mortgage loans. In fact, its debt securities value has been decreasing:
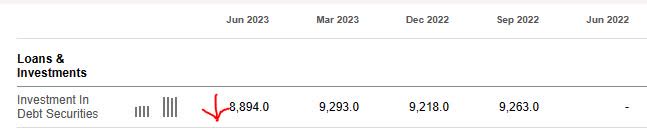
This could be due to selling off of assets, and or declining market value of bonds they may be holding. I think some investors and analysts could be bearish on stocks like this, particularly banks & insurance companies, out of concern over bond values dropping during this high interest rate environment (as bond prices & interest rates move in opposite directions). In fact, there is not indication the Fed will lower rates just yet, so we can continue to expect high rates for now.
Although this is a reality to any firm holding a sizeable bond portfolio, particularly if those were long-term bonds acquired when rates were lower, my counterargument to the market bears on this stock is that this firm can afford to take a hit on its bond portfolio as it is cash-rich and cashflow-rich as well, which I have shown. Further, unlike a bank that has to come up with depositors' money on demand, an insurance firm essentially only pays out claims after a valid claim event occurs.
So, my bullish sentiment on this stock remains and my buy rating stands.
For further details see:
Cigna: Buy Rating Driven By Undervaluation & Revenue Growth