CII - CII: Solid Fund But Narrow Discount Remains Sticky
2023-09-28 14:46:57 ET
Summary
- BlackRock Enhanced Capital and Income Fund (CII) is a solid choice for long-term income investors, offering attractive returns and a steady monthly distribution.
- However, the fund's narrow discount and even recently trading at a premium to its net asset value should put investors in a more cautious approach.
- CII's tech-concentrated portfolio has contributed to its performance, and this has helped it pay out a solid monthly distribution to investors over the years.
Written by Nick Ackerman, co-produced by Stanford Chemist.
BlackRock Enhanced Capital and Income Fund (CII) remains a solid choice for long-term income investors. The fund has produced attractive returns while paying out a solid monthly distribution. However, the downside to considering an entry into this fund at this time remains its narrow discount. In fact, the fund has more recently been flirting with trading at a premium to its net asset value.
That said, we do have a new semi-annual report that has been posted since our prior update, allowing us to dig into the new numbers and potential changes. Additionally, those who do have a long-term outlook or take a dollar-cost average approach are probably less reliant on waiting for a deep discount to open up. As we've seen over the longer term, this fund doesn't open up to deep double-digit discounts very frequently.
Since our last update , the fund has put up some decent results on a total return basis as well. Some of that is from the discount narrowing during this time, but also, the underlying portfolio has been continuing to perform well as a rather tech-concentrated fund.
CII Performance Since Prior Update (Seeking Alpha)
The Basics
- 1-Year Z-score: 1.06
- Discount: -1.19%
- Distribution Yield: 6.26%
- Expense Ratio: 0.89%
- Leverage: N/A
- Managed Assets: $844.732 million
- Structure: Perpetual
CII has a simple objective and strategy; it "seeks to provide investors with a combination of current income and capital appreciation" by "investing in a portfolio of equity securities of the U.S. and foreign issuers." They will also "employ a strategy of writing call and put options."
Since the fund doesn't utilize any borrowings for leverage, the fund hasn't had to deal with rising interest rates. Leveraged funds are having to deal with higher borrowing costs as interest rates have risen; some have hedged against this to handle it better, but others have not. Additionally, this can make the fund relatively less volatile.
In the fund's option approach, they target an overwrite of 30 to 40%. However, they are actually well above this target, with the latest percentage overwrite coming in at nearly 57%. With a heavier overwrite, it would indicate that the fund is positioned more defensively. This is because, as is the case with most covered call-writing funds, the upside movement is capped when entering into a call-writing strategy. The benefit is that investors receive a premium that can offset some potential losses.
Something else to consider in the current environment with this fund's strategy is that volatility, as measured by the VIX, was actually quite low. That can result in less option premiums being received relative to when the market is expected to be more volatile. Though it more recently has been on the rise as September has proven once again to be the worst month for equities.
Performance - Deep Discount Remains Elusive
History is never guaranteed to repeat, but it can often rhyme. We tend to see this play out with closed-end fund discounts/premiums as they have a tendency to be mean reverting. That is, going back to their historical ranges of discounts/premiums.
Over the last year, the fund has sported a positive z-score, which tells us that it is trading higher than it has averaged during this period. At 1.65, it isn't overly rich in terms of its overvaluation, but it could indicate that downside is definitely possible from discount expansion.
When looking over the longer term, we can see that a deep discount, which I'd define as a double-digit discount, has been fairly rare. This occurred during COVID-19, and it was a sharp drop that nearly touched a 20% discount. However, that quickly reversed, and it did carry around a 10% discount for a material amount of time. However, since then, the fund hasn't touched another deep discount. Prior to that, it would have been around 2017 when that occurred.
Again, that doesn't mean that it won't ever get to those deep discount levels again, but it could be one of the arguments against waiting to pick up some shares. This could be especially true if you take a dollar-cost average approach, where one intends to purchase shares in smaller chunks over time.
On the other hand, it shouldn't be ignored that we are trading near the highs in terms of where the fund's premium has topped out in the last decade. More specifically, we just reached the decade's high premium very recently.
In looking at the fund's performance, it's important to consider an appropriate benchmark. The S&P 500 Index tends to be the go-to for most equity investors, but in this case, the benchmark is the Russell 1000 Index. They also incorporate the MSCI USA Call Overwrite Index in their material to reflect their call-writing strategy. The data is from their semi-annual report, so it's a bit dated at this time, but it can still give us an idea of how the fund performed against its benchmarks.
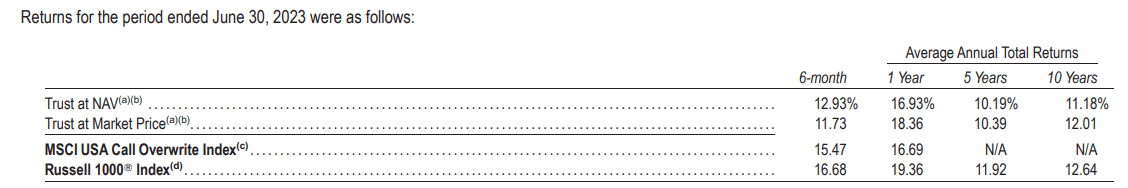
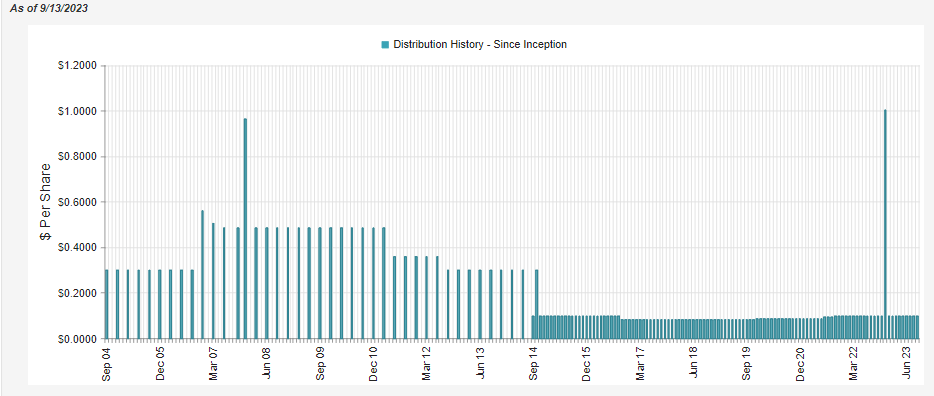
Distribution - Steady Monthly Cash Flow
What the fund's benchmarks don't offer - well, for one, is a way to invest directly - but also a steady monthly distribution. At a current distribution rate of 6.26%, it's quite appealing as the fund has been able to mostly keep a flat share price and even offer some appreciation, depending on when one bought it. On a NAV basis, the distribution rate is pretty much equal to the current share price due to only offering an immaterial discount to NAV at this time.
Of course, to produce that higher distribution rate relative to its benchmarks or other ETF peers would be the fact that they pay out primarily capital gains rather than solely relying on the fund's income-generation ability. In fact, this fund generates a fairly minimal amount of net investment income at all. This would primarily be due to its heavier emphasis on growth.
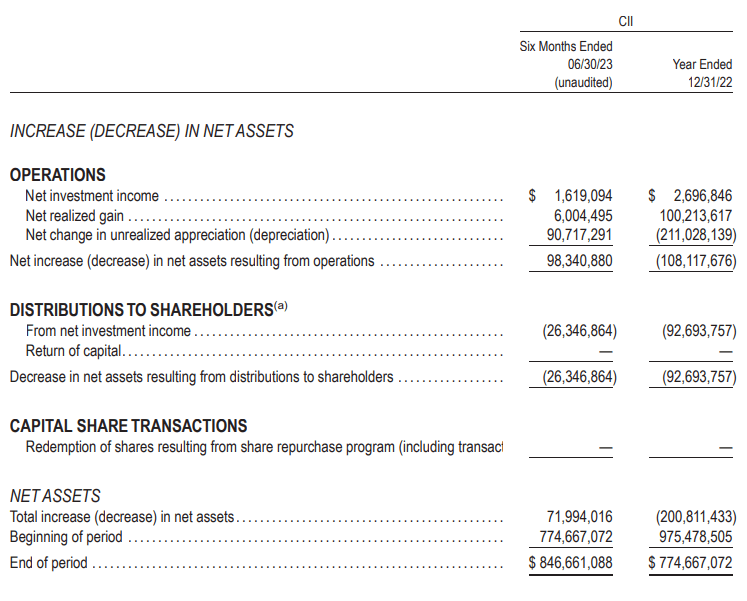
On a per share basis, NII came to $0.04 for the last 6-month period, and that's actually on track to beat out last fiscal year's $0.06 for the entire 12-month period.
Where the fund has made up the shortfall of NII is through capital gains over the years. During the first six months, the fund actually only realized a fairly shallow amount of gains. That said, that was made up by the significant rebound in equities that is reflected by unrealized appreciation rising.
Working against the fund was the fact that the fund's option writing strategy actually generated losses. Otherwise, from the portfolio, they had locked in gains of $15.67 million, reduced by the $9.665 million loss of options written, which is what brought the realized gains pool to around $6 million. That's probably the opposite of what most investors would anticipate from an options-writing fund, that they would be generating losses from covered calls. However, that can happen during years when we see equities run up significantly.
CII Realized/Unrealized Gains/Losses (BlackRock)
On the other hand, in down years, that's where we'll see the strategy generate meaningful gains. In 2022, for example , the fund brought in gains from its options strategy of $25.138 million.
We touched on the tax classifications on the fund's distribution earlier this year ; here's the recap:
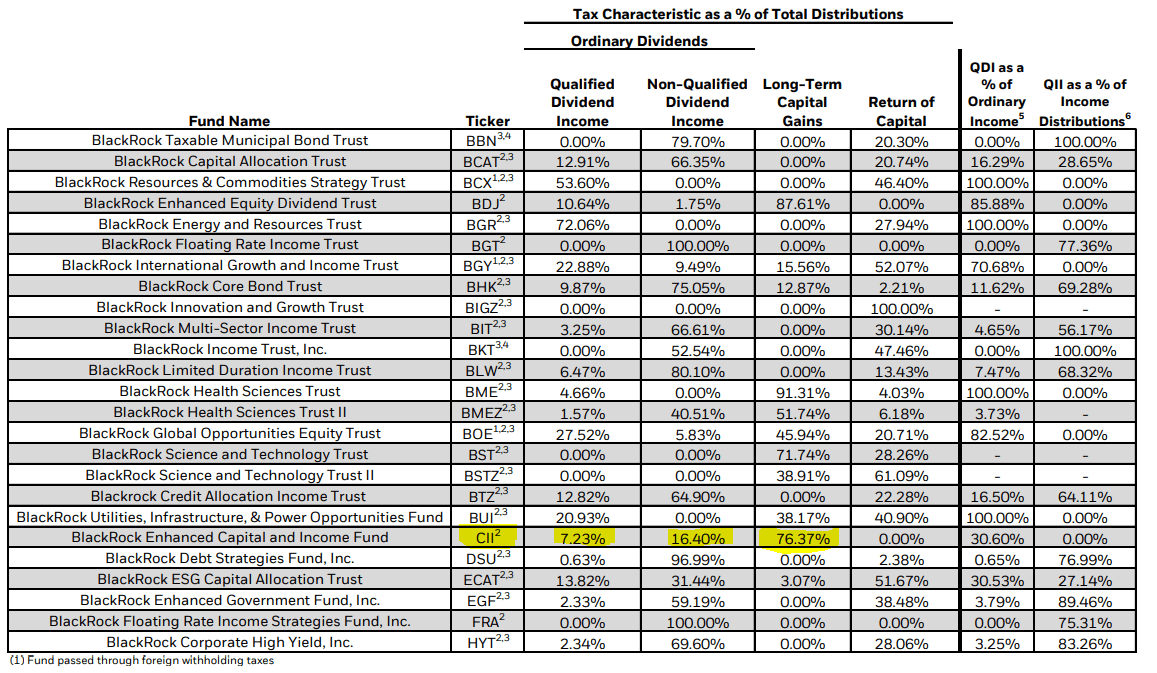
For tax purposes, in 2022 , the largest distribution characterization was assigned as long-term capital gains.
CII Distribution Tax Classification (BlackRock (highlight from author))
While that probably appears to make sense given the sizeable year-end long-term capital gain paid out, this is generally the case anyway. As we saw above, income generation in the fund is fairly minimal, and most coverage will come through capital gains. This was also reflected in 2021's tax classifications , where nearly 96% of the fund's distribution was characterized as long-term capital gains.
CII's Portfolio
CII isn't necessarily the most active fund when it comes to buying and selling positions. Their last semi-annual report reflects a turnover rate of 15%, which puts it on pace to come in similar to last year's 32% turnover. Over the last five full years, the average annual turnover came to 32.8%, making it right in line to be around the average once again.
This fund has the ability to invest outside the U.S., but the fund has predominantly been allocated to U.S. investments and remains that way at nearly 92%. Since the GFC, that's been the right place to be, so it's definitely worked for the fund.
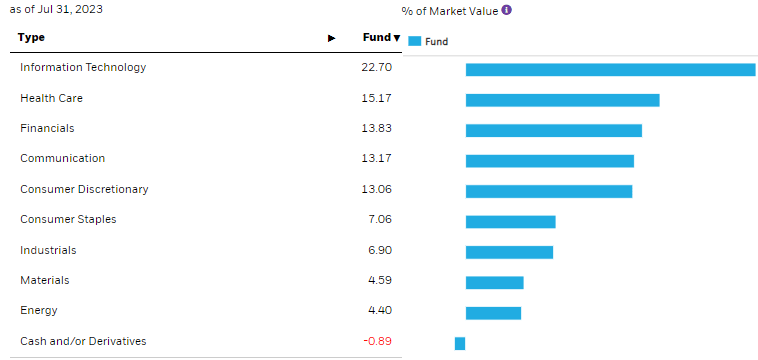
Additionally, given the fund's benchmark is more toward a growth-oriented approach, having the largest sector allocation to tech also isn't too surprising. At the same time, it still isn't as concentrated as something like the S&P 500 Index itself, with at least a bit more balance outside of tech.
The weighting to tech since our last update has inched up a bit from the 19.84% weighting it was previously. Financial exposure slid a bit from the 15.86% weighting, which actually had it as the second largest exposure previously. That's allowed healthcare exposure to become the second largest weighting in the fund, and that rose from the 14.84% level it was previously.
However, overall, there wasn't anything too materially changing in terms of sector allocations since our last update. With tech and the mega-cap growth names continuing to be the dominant performing through 2023, mostly rebounding from last year being some of the worst performing, this likely played a role in seeing tech's weighting increase.
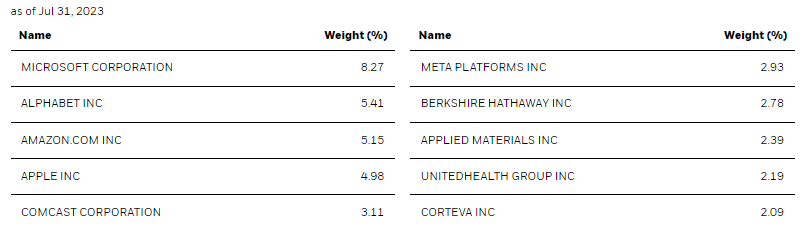
Additionally, with that being the case of limited sector weighting changes, as we'd expect, the fund's top ten also hasn't shifted too much in this time, either.
CII remains heavily invested in the Magnificent Seven, with five of the seven names represented in the top ten at a nearly 25.5% weighting. Microsoft ( MSFT ), on its own, commands an elevated 8.27% weighting in the fund. However, that is down a touch from the 8.42% it was at previously.
Alphabet (GOOG), Amazon (AMZN), Apple (AAPL) and Meta Platforms (META) - all also being previous top ten holdings - saw varying degrees of increased weighting allocations within CII. During the reporting periods between updates, META had been the outperformer by a wide margin, with MSFT the laggard. Of course, this is only a relative laggard against this small sample size of CII's most dominant positions, and it otherwise had incredible performance.
Ycharts
At the same time, META saw one of the smallest increases in its weighting in the top ten as it only rose to 2.93% weighting from 2.87%. What that would tell us is that they actually reduced their position during this period. That would be exactly what happened. At the end of March 2023 , they held 99,289 shares of META, but that had declined to 88,949 by the end of June 2023 . At the end of both periods, they had outstanding written calls against META.
That brings us back to how writing covered calls can create losses. While the fund saw a reduction in the fund's total share count for META, it is possible that they could have closed out some of these contracts prior to expiration. If the price runs sharply higher, sometimes it can make sense to close out a covered call - even at a loss - if it means holding the shares starts to make more sense. This would be especially true if they expected that momentum to carry the stock's share price even higher.
Conclusion
CII is a solid fund and has delivered a solid monthly cash flow to investors over the years. The heavier focus on a tech-oriented portfolio with most of the Magnificent Seven as top positions has helped the fund accomplish that. At the same time, the fund's shallow discount has been persistently sticky (even going to a premium recently,) which means an investor could probably be rewarded by taking a more cautious approach. Utilizing a dollar-cost average approach could be a better way to build a position.
For further details see:
CII: Solid Fund, But Narrow Discount Remains Sticky