JPM - Citi: A 7-Point Check And 10% Target Return Covered Call Strategy
2023-12-04 15:33:51 ET
Summary
- Citigroup Inc.'s dividend yield and growth trajectory make it attractive to buy below 48, while its yield exceeds that of 10-year treasuries.
- At current valuations, Citi shares are likely to deliver good returns even with little or no growth.
- More likely though, I expect its internationally recognized brand to help deliver some upside growth surprises this decade.
- Citi's low profitability ratios are the main reason I am writing covered calls and not considering this a "forever stock."
For years, I have been reducing my exposure to the shares of JPMorgan Chase & Co. ( JPM ), and by next year, it seems likely that my exposure to Citigroup Inc. ( C ) will surpass JPM as my single largest U.S. bank stock position. Given that observation, I thought it would be worthwhile to perform a quick "7-point check" on C to consider its expected rate of return and risks, and what adjustments I might want to consider for my C position over the coming months. The 7 points consider Citi's dividend, its geographic exposure, and how it scores according to the five Seeking Alpha factor grades . Based on these 7 points, I have decided a covered call strategy is what I want to do next with this position.
Citigroup's dividend
One reason I felt confident issuing buy ratings on C in my Investing Group, both in September and October, was due to the small but meaningful dividend hike from 51 to 53 cents per quarter this past August. While it sounds like a very "brain dead" strategy, I have found that simply buying stocks with positive dividend momentum tends to be a winning strategy on average over time. That this dividend hike occurred when C's dividend yield broke above 5% and was near 10-year highs made this stock look like a very attractive combination of yield and growth.
My benchmark for C's dividend yield is the US 10-year treasury yield ( US10Y ), and right now with both just below 4.5%, even a 2-3% annual dividend growth rate would have C comfortably outperform bonds over the next decade. Dividend yield is also the metric that has driven me to buy C as I've continued trimming my JPM position, since C's dividend yield is over 2 percentage points higher, and I don't expect JPM's growth to make up for that by being 2 percentage points higher than Citi's.
Citigroup's geographic exposure
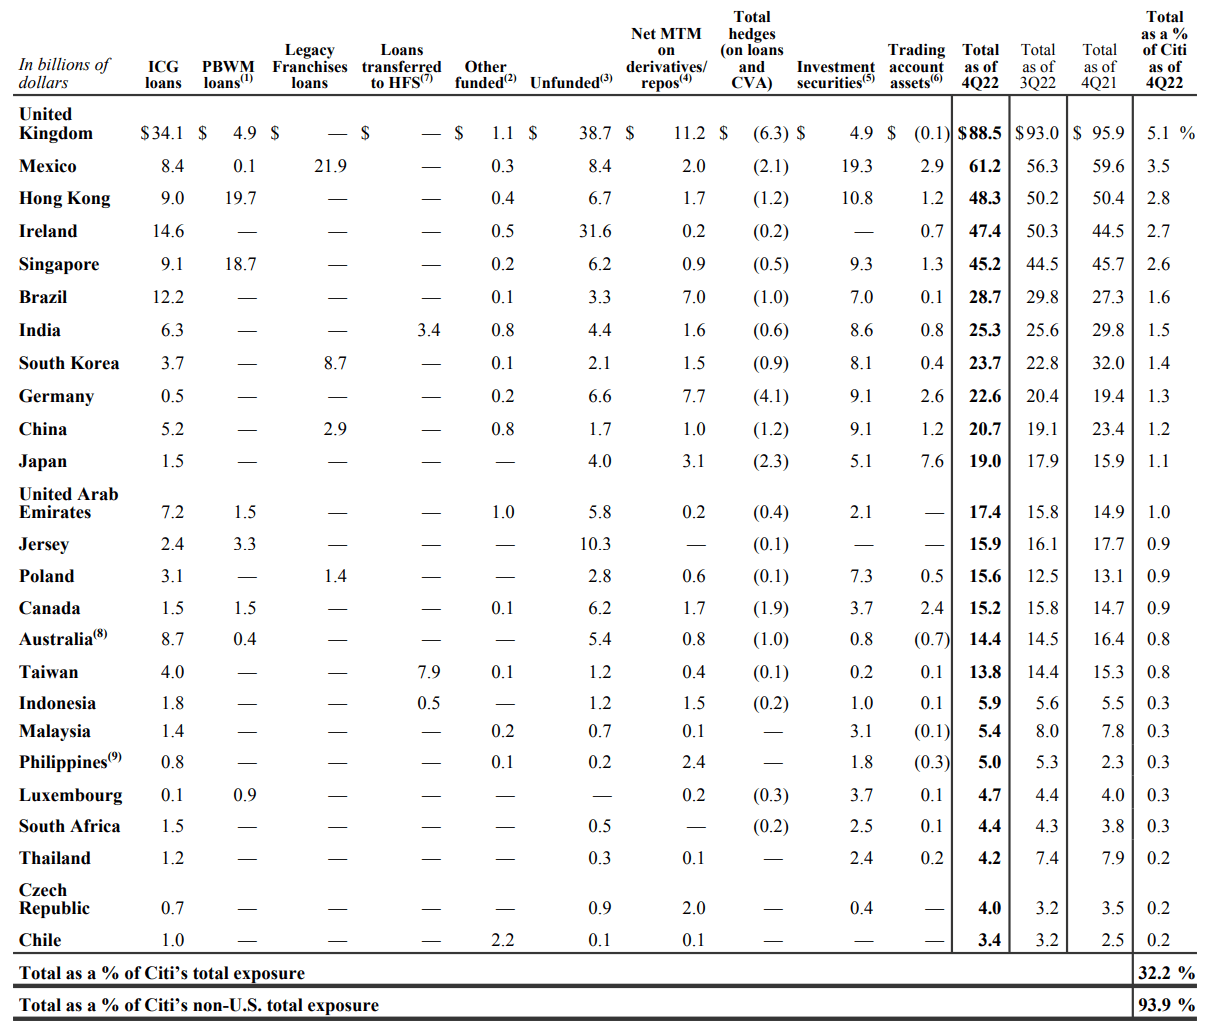
Another factor I have started always checking with every stock I look at is its geographic exposure, as I've done earlier with HSBC and BBVA . This below table from Citi's 2022 Annual Report shows that Citi is still primarily a U.S. bank, with about 2/3 of its overall exposure in its home country, while also providing some diversification to Europe, Latin America, and Asia. I don't see any of these exposures as significant enough to replace any of the more direct exposure I'd want to any of these markets, but it's not a bad mix for a primarily U.S. bank with a world-renowned brand.
Valuation: C is still cheap
The high dividend yield mentioned earlier already indicated that C looked cheap relative to its dividend, but the current "A-" valuation grade confirms this stock looks cheap across many different metrics, meaning less than 8x forward earnings (12.5% earnings yield) and 50% of book value. Multiples that cheap tends to imply that the market does not believe the reported book value and expects earnings to decline rather than grow. On the flip side, I see ratios like this as telling me that this stock can deliver good returns even with zero or slightly negative growth. As with dividend yield, these two metrics show that C is at its cheapest levels over the past 10 years.
Growth: Is Citi not growing?
Citi's current growth grade is an "F" , largely due to negative earnings growth over the past year and forecast over the next year. One or two years of earnings declines shouldn't be surprising for a big bank in the current volatile interest rate environment, and what I really care about is whether the book value and dividends will be higher 5–10 years from now. My preferred metric for looking at a bank's long term growth is growth in its book value, which for C has almost doubled over the past 10 years, and given its <50% dividend payout ratio I think it's fair to expect this growth rate can be sustained.
Profitability: Could be better
The main reason I currently rate Citi as a value trade, rather than as a long-term "buy and hold forever" investment, is its relatively low return on asset ratio ((ROA)), which has been averaging around 0.5–0.6%, and I usually like to see an ROA of 1% on a bank. The below chart shows that Citi's era of low profitability started after the 2008-2009 mortgage crisis, and is a chart I occasionally need to look at to remind myself that this is not the same bank I first opened my account with 25 years ago. Seeking Alpha's quant grade of "F" seems to look more at other metrics like margins, and is a much harsher grade than I would give to Citi based on this chart.
Momentum: Another reason to hold for now
Even after observing that momentum was the best performing factor from 2010-2020, it remains one factor I have been the most reluctant to include in my investment process, as I still instinctively prefer to buy low and sell high rather than to ride trends. If I needed a factor to justify holding on to my Citi shares into next year, rather than taking some profits already, the green "B-" momentum grade does help a bit. If I were purely trading C on momentum, I might consider a trailing stop as I've started using with my currency trades, but for now, my read on C's momentum is that a medium term target price of $50 per share, a yield of 4.2%, is a fair one to aim for.
Revisions: Fundamentally behind momentum
Citi's next and final "green B" factor grade is for earnings revisions , which seem to have been on a downtrend since 2020, but over the past 3 months has seen 9 analysts raise EPS estimates while only one has reduced them. Even more than C's price momentum, I'm most keen to follow these 10 analysts' revisions of the 2025 EPS estimates, currently centered around $6.88 per share, or just under 1/7 of the current stock price.
Conclusion: I'm writing covered calls
As mentioned earlier, my bottom line conclusion on what to do with my C shares based on these seven factors is that I plan to write covered calls on about 50% of my shares. Please be fully aware of the risks of trading options before placing any trades.
My specific option choice is to write the March 50 call for a premium of 1.37 or better, which provides me:
- An up-front premium equal to 2.9% of the value of my covered shares, plus
- An expected dividend of 53 cents per share in March, another 1.1% of my initial covered share value, plus
- 5.9% remaining upside from the current price to 50 between now and March
Together, these three components add up to a hair under a 10% target rate of return over a period of a little over 3 months, which seems like fair compensation for the risks outlined with the seven parameters in this article.
For further details see:
Citi: A 7-Point Check And 10% Target Return Covered Call Strategy