CLFD - Clearfield And Its Real Value
2023-04-11 06:50:27 ET
Summary
- Clearfield saw amazing growth in terms of revenue for the quarter that ended in December 2022.
- CLFD reported revenue of $85.94 million, or growth of around 68.2% year-over-year.
- Surprisingly, Clearfield might still be undervalued despite an increase in share price.
- This article focuses on the fundamentals, the real value versus the current share price, and if Clearfield is currently worth investing in.
Clearfield, Inc. ( CLFD ) stock has seen massive fluctuations in the last year or so. The share price almost doubled from May 2022 to August 2022, touching the $122 mark. However, the company's stock has been seeing a massive decline and is currently sitting at around the $45 mark.
Just in March 2023, the price of CLFD shares fell by 15.2% in trading in a single day. Even though the revenue increased by 68% to $85.9 million, the main reason behind the significant decline was the backlog falling 17% from just a quarter ago to $136 million.
Although management said it was mainly because of a return to normal ordering patterns, it was a concern for the investors. Nevertheless, the company has immense potential to grow as its EPS has increased massively in the last three months.
Currently, CLFD is facing some bumps as everything returns to normal after the pandemic. It is why there are some issues that the company is facing. But even then, the company has posted some strong numbers from last year, maintaining its growth.
When considering these current stories about CLFD, we need to determine which news topics will have a long-term and ongoing effect on the company and its share price. If we look at the news, Forbes declared CLFD as one of the best-performing stocks of small companies last year.
While current news stories, good or bad can sway our opinion about investing in a company, it's good to analyze the fundamentals of the company and to see where it's been in the past and in which direction it's heading.
Snapshot of the Company
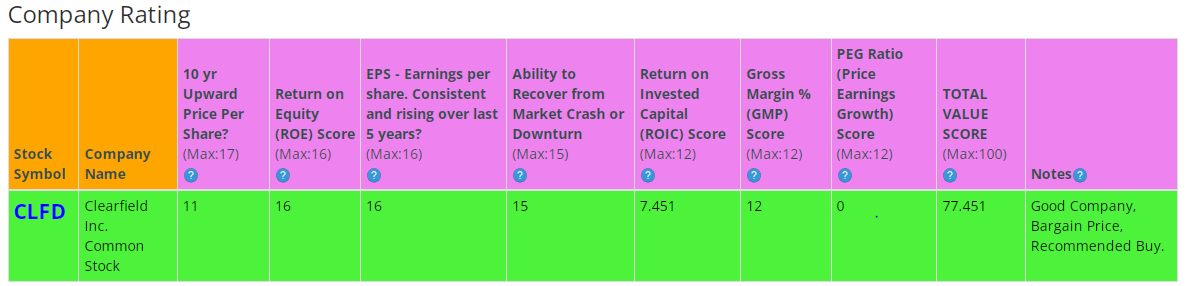
A fast way for me to get an overall understanding of the condition of the business is to use the BTMA Stock Analyzer's company rating score. CLFD has a decent company rating score of around 77.5 out of 100.
Before jumping to conclusions, we'll have to look closer into individual categories to see what's going on.
Fundamentals
First, we'll examine the long-term price per share. As you can see in the chart, the share price was mostly stagnant until 2020 when it experienced accelerated growth. Then it declined in the most recent year.
In a nutshell, the compound annual growth rate ((CAGR)) was 16.17%, while the share price increased by roughly 285% over the last 10 years.
BTMA Stock Analyzer
Earnings Per Share
If we look closely at the overall growth of the company's earnings, we will notice that there has been a massive surge in its EPS. The company's EPS catapulted from US$2.01 to US$3.50 in just 12 months. This figure represents a jump of around 74%. This is not typical for companies to experience such high year-over-year growth. Clearfield seemed to grow because of COVID for a few reasons. COVID forced companies to allow for more remote work. The US Infrastructure bill passed by Congress granted $65 billion to broadband infrastructure expansion. Finally, people and businesses were spending more time using Clearfield's products and services during COVID.
Earnings are expected to become stronger this year as the company continues to maintain its growth and progress. As the world is rapidly moving towards digitalization, there is a constant increase in the demand for the Internet. This presents a serious opportunity for CLFD as the company's fiber optics are an integral component of the networks.
However, the increasing demand for digitalization is also causing a shift toward wireless gadgets and setups. While it might not pose a significant threat for Clearfield at the moment, it can become an issue in the long term.
If we look closely at the EPS chart, the EPS was stagnant from 2013 to 2019, going as high as 0.59 in 2016 but mostly staying between 0.34 to 0.4 throughout that period. Nevertheless, the EPS saw a massive increase after 2019, reaching 3.55 in 2022.
BTMA Stock Analyzer
Return on Equity
Since earnings and price per share don't always give the whole picture, it's good to look at other factors like the gross margins, return on equity, and return on invested capital. As you can see, the return on equity has experienced accelerated growth from 2017 to 2021. While there was a slight dip in the ROE of 0.06 from 2018 to 2019, it has continued to increase since then. For return on equity (ROE), I look for a 5-year average of 16% or more. Therefore, CLFD easily meets my requirements.
Let's take a look at the ROE of this company compared to its industry. The average ROE for 10 cable TV companies is around 12.14%. The 5-year average ROE for Clearfield is 16%, while its current ROE is around 39%. Both of these figures are above industry average for ROE.
BTMA Stock Analyzer
Return on Invested Capital
The return on invested capital ((ROIC)) also shows an accelerated increase in the last couple of years. While the ROIC for 2022 is around 34%, the average for the 5 years is around 14%. For return on invested capital ((ROIC)), I also look for a 5-year average of 16% or more. So, unfortunately, CLFD doesn't meet this requirement by a slight margin.
BTMA Stock Analyzer
Gross Margin Percent
Although the gross margin percentage ((GMP)) decreased from 2018 to 2019, it maintained an upward trend in 2020 and 2021. However, it fell again in 2022. If we look at the gross profit margin percent, it did fluctuate between 38% to 44%. Nonetheless, GMP has maintained optimal levels over the last five years.
I typically look for companies with gross margin percent consistently above 30%. Since CLFD has a five-year average of around 40%, the company can maintain acceptable margins over a long period.
BTMA Stock Analyzer
Other Indicators
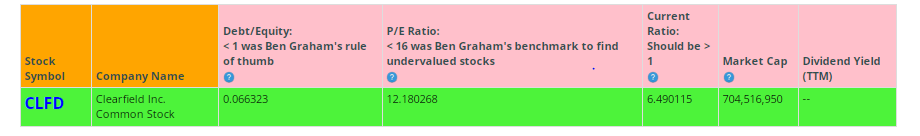
Looking at other fundamentals involving the balance sheet, we can see that the debt-to-equity is less than 1. It shows that Clearfield currently has more assets than it owes in terms of liabilities.
Furthermore, the current ratio is also a positive indicator for the company. The current ratio indicates that the company won't face liquidity issues in the short run.
CLFD does not currently pay a regular dividend.
This analysis wouldn't be complete without considering the value of the company vs. share price.
Value Vs. Price
The company's Price-Earnings Ratio of 12.18 shows that CLFD might be selling at a low price when comparing CLFD's PE Ratio to a long-term market average PE Ratio of 15.
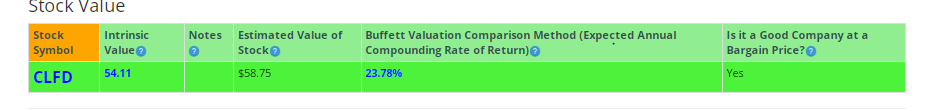
The stock's estimated value is around $58.75, whereas the current price is around $45. This indicates that CLFD is currently at a good bargain price.
For more detailed valuation purposes, I will be using the 2022 EPS of 3.55. I've used various past averages of growth rates and PE Ratios to calculate different scenarios of valuation ranges from low to average values. The valuations compare growth rates of EPS, Book Value, and Total Equity.
In the table below, you can see the different scenarios, and in the chart, you will see vertical valuation lines that correspond to the table valuation ranges. The dots on the lines represent the current stock price. If the dot is towards the bottom of the valuation range, this would indicate that the stock is undervalued. If the dot is near the top of the valuation line, this would show an overvalued stock.
BTMA Wealth Builders Club BTMA Wealth Builders Club
According to this valuation analysis, CLFD is undervalued in every scenario except for valuation derived from analysts' low forward growth, which values the stock between $38 and $41. Otherwise, the average fair price is estimated at over $100. In addition, the Estimated Value of the stock according to the BTMA Stock Analyzer is $58.
Summarizing the Fundamentals
If we look at the stats and figures, we'll see that CLFD has enjoyed decent growth in the last few years. Its price has increased from $16.28 to $64.72 in just seven years. Furthermore, the company's current ratio is at 6.4, which is impressive.
This shows that it won't be cash-strapped in the short run and should have sufficient funds to pay for its short-term debts. Additionally, the debt-to-equity ratio is at 0.66%, which is in an optimal range (less than 1).
Apart from the ROIC, which has a 5-year average slightly below my preference of 16%, the other important fundamentals are satisfactory.
If we look at the future of fiber optic technology, there are some promising signs. For instance, the rising demand for high bandwidth, and deployment of optic cables in remote places, along with the continuous growth of 5G networks, provide numerous opportunities for CLFD to capitalize on.
In terms of valuation, my analysis shows that the stock is slightly undervalued.
CLFD Vs. The S&P 500
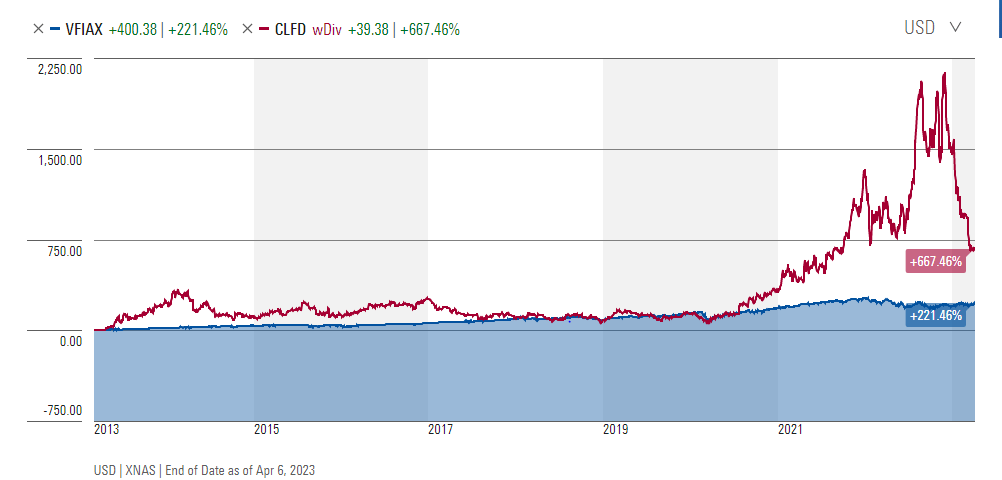
Now, let's see how CLFD compares versus the US stock market benchmark S&P 500 over the past 10 years. As we can see from the chart, the CLFD was more or less in line with the market growth from 2013 to 2020. However, since 2020, CLFD has greatly outperformed the S&P 500. The stock witnessed volatility throughout the remaining months of 2022 and has continued to experience a downward trend since 2023. This chart shows that CLFD has the potential to greatly outperform the market. However, the volatility of CLFD warns investors to buy at a bargain price to protect yourself from the volatility of this stock and its industry.
.
Forward-Looking Conclusion
There isn't much analyst coverage of this stock. However, the analysts that follow this sector predict the sector to grow earnings at an average annual rate of 13.50% over the next five years.
In addition, this stock's average one-year price target is at $95.60 , while the expected Annual Compounding Rate of Return is 23.78%.
Does CLFD Pass My Checklist?
- Company Rating 70+ out of 100? YES (77.45)
- Share Price Compound Annual Growth Rate > 12%? YES (16.17%)
- Earnings history mostly increasing? YES
- ROE (5-year average 16% or greater)? YES (16%)
- ROIC (5-year average 16% or greater)? NO (14%)
- Gross Margin % (5-year average > 30%)? YES (40%)
- Debt-to-Equity (less than 1)? YES
- Current Ratio (greater than 1)? YES
- Outperformed S&P 500 during most of the past 10 years? YES
- Do I think this company will continue successfully selling the same main product/service for the next 10 years? POSSIBLY
CLFD scored 8.5/10 or 85%. So, CLFD is definitely worth considering as a potential investment!
According to most valuation metrics, CLFD is selling at a bargain price. Furthermore, the P/E ratio of 12.18 indicates that it is selling at a low price. According to Clearfield's 2022 income statement, the company nets about 18% of its revenue. The company is small and still has lot of room to grow.
Overall, the fundamentals are good, the company and industry offer impressive growth potential, and the stock is undervalued. If you're confident in the company and its products/services, then it might be a good company to consider adding to the portfolio. I will be watching the stock and learning more about its products and competition before deciding to invest in Clearfield.
For further details see:
Clearfield And Its Real Value