CWAN - Clearwater Analytics' Growth Trajectory Slows Amid Higher Operating Losses
2023-08-03 12:20:21 ET
Summary
- Clearwater Analytics Holdings, Inc. reported Q2 2023 financial results, beating revenue and EPS consensus estimates.
- The company provides automated investment data aggregation, accounting, compliance, risk, and reporting functionalities to financial institutions.
- Due to slowing revenue growth and deteriorating operating results, my outlook on Clearwater Analytics Holdings is Neutral [Hold] for the near term.
A Quick Take On Clearwater Analytics
Clearwater Analytics Holdings, Inc. (CWAN) reported its Q2 2023 financial results on August 2, 2023, beating revenue and EPS consensus estimates.
The firm provides automated investment data aggregation, accounting, compliance, risk and reporting functionalities to financial institutions.
Given the firm’s slowing revenue growth trajectory and deteriorating operating results, I’m Neutral [Hold] on CWAN for the near term.
Clearwater Overview And Market
Boise, Idaho-based Clearwater was founded to develop a SaaS platform to simplify investment accounting and analysis for asset managers, insurance companies and large corporations.
Management is headed by Chief Executive Officer Sandeep Sahai, who has been with the firm since September 2016 and was previously CEO of Solmark, an investment partnership.
The company’s primary offerings include:
-
Data aggregation
-
Investment accounting and reporting
-
Performance measurement
-
Compliance monitoring
-
Risk analysis.
The firm pursues client relationships with asset managers, insurance companies, and large corporations via a direct sales and marketing force that is focused on the United States.
According to a 2021 market research report by Marketprimes, the global investment management software market was an estimated $3 billion in 2019 and is forecast to reach nearly $4.5 billion by 2025.
This represents a forecast CAGR of 10.2% from 2019 to 2025.
Management believes the firm’s total addressable market is as high as $11 billion globally, including adjacent markets, the market for its Prism system and the APAC region.
The main drivers for this expected growth are a desire by users to automate repetitive tasks so they can focus on maximizing portfolio performance and creating more sophisticated approaches.
Also, assessing risks and exposures and being able to efficiently report and share the information with stakeholders will drive demand for more capable solutions.
Major competitive or other industry participants include:
-
SS&C
-
State Street
-
SAP
-
BNY Mellon (Eagle)
-
Simcorp
-
BlackRock
-
FIS
-
Northern Trust
-
Others.
Clearwater’s Recent Financial Trends
-
Total revenue by quarter continues to rise; Operating income by quarter has remained materially negative in recent quarters.
Total Revenue and Operating Income (Seeking Alpha)
-
Gross profit margin by quarter has varied within a narrow range; Selling, G&A expenses as a percentage of total revenue by quarter have moved up recently.
Gross Profit Margin and Selling, G&A % Of Revenue (Seeking Alpha)
-
Earnings per share (Diluted) have worsened further into negative territory in the most recent quarter.
Earnings Per Share (Seeking Alpha)
(All data in the above charts is GAAP.)
In the past 12 months, CWAN’s stock price has risen 33.99% vs. that of much larger SS&C Technologies Holdings, Inc.’s (SSNC) fall of 8.79%, as the chart indicates below:
52-Week Stock Price Comparison (Seeking Alpha)
For the balance sheet , the firm ended the quarter with $240.1 million in cash, equivalents and short-term investments and $50.6 million in total debt, of which $2.8 million was categorized as the current portion due within 12 months.
Over the trailing twelve months, free cash flow was $51.8 million, during which capital expenditures were $7.2 million. The company paid $73.0 million in stock-based compensation in the last four quarters, the highest trailing twelve-month figure in the past eleven quarters.
Valuation And Other Metrics For Clearwater
Below is a table of relevant capitalization and valuation figures for the company:
| Measure [TTM] |
| Amount |
| Enterprise Value / Sales |
| 10.4 |
| Enterprise Value / EBITDA |
| 431.0 |
| Price / Sales |
| 10.3 |
| Revenue Growth Rate |
| 19.3% |
| Net Income Margin |
| -4.0% |
| EBITDA % |
| 2.4% |
| Net Debt To Annual EBITDA |
| -24.6 |
| Market Capitalization |
| $4,160,000,000 |
| Enterprise Value |
| $3,300,000,000 |
| Operating Cash Flow |
| $59,020,000 |
| Earnings Per Share (Fully Diluted) |
| -$0.12 |
(Source - Seeking Alpha.)
The Rule of 40 is a software industry rule of thumb that says that as long as the combined revenue growth rate and EBITDA percentage rate equal or exceed 40%, the firm is on an acceptable growth/EBITDA trajectory.
CWAN’s most recent unadjusted Rule of 40 calculation was 21.7% as of Q2 2023’s results, so the firm has produced mediocre if stable results, per the table below:
| Rule of 40 Performance (Unadjusted) |
| Q1 2023 |
| Q2 2023 |
| Revenue Growth % |
| 19.3% |
| 19.3% |
| EBITDA % |
| 2.4% |
| 2.4% |
| Total |
| 21.7% |
| 21.7% |
(Source - Seeking Alpha.)
Commentary On Clearwater
In its last earnings announcement (Source - Seeking Alpha ), covering Q2 2023’s results, management highlighted a number of marquee client additions during the quarter.
The firm also announced a strategic partnership with J.P. Morgan Asset Management to integrate with the MORGAN MONEY platform to make it easier for clients to navigate between both systems.
CWAN also launched its Clearwater-GPT AI functionality for clients.
The company’s net retention rate was 109%, an increase of 3 percentage points from Q1 2023’s 106%, indicating good product/market fit and sales & marketing efficiency.
Total revenue for Q2 2023 rose 22.5% year-over-year, while gross profit margin fell 1.6%.
Selling, G&A expenses as a percentage of revenue increased by 5.9% YoY, a negative signal indicating reduced efficiency and operating income dropped sharply to a loss of $7.13 million from a profit a year before.
The company's financial position is strong, with plenty of liquidity, minimal debt and strong free cash flow.
However, management continues to pay more via stock-based compensation, which is at an eleven-month high.
CWAN’s unadjusted Rule of 40 performance has been stable but in need of improvement.
Looking ahead, management guided full-year 2023 revenue of $365 million, or 15% YoY growth.
If achieved, this would represent a drop in revenue growth versus 2022’s growth rate of 19.29% over 2021, indicating a declining revenue growth trajectory.
Regarding valuation, the market is valuing CWAN at an EV/Sales multiple of around 10.4x on TTM revenue growth rate of 19.4% against a median Meritech SaaS Index implied ARR growth rate of 21% ( Source ).
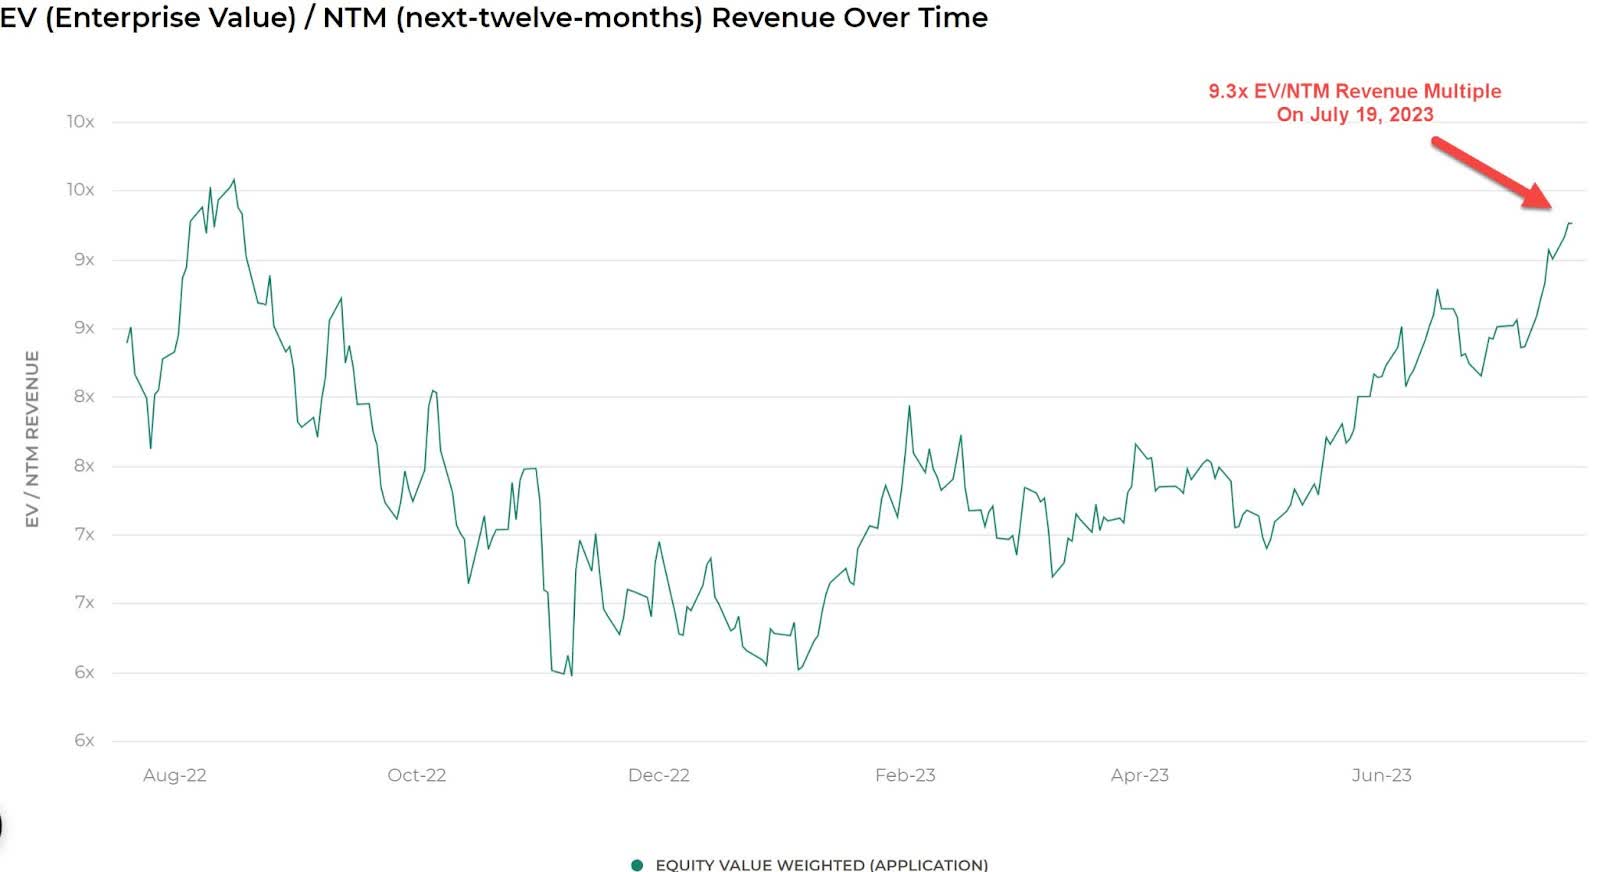
The Meritech Capital Index of publicly held SaaS application software companies showed an average forward EV/Revenue multiple of around 9.3x on July 19, 2023, as the chart shows here:
EV/Next 12 Months Revenue Multiple Index (Meritech Capital)
So, by comparison, CWAN is currently valued by the market at a slight premium to the broader Meritech Capital SaaS Index, at least as of July 19, 2023.
Risks to the company’s outlook include negative leading economic indicators suggesting an economic slowdown which may affect customer/prospect spending plans and lengthening sales cycles which may reduce its revenue growth potential in the near term.
Also, management is forecasting slow top line revenue growth in 2023 as compared to 2022, while the company has produced worsening operating losses.
Given the firm’s slowing revenue growth trajectory and deteriorating operating results, I’m Neutral [Hold] on SS&C Technologies Holdings, Inc. for the near term.
For further details see:
Clearwater Analytics' Growth Trajectory Slows Amid Higher Operating Losses