RLTY - Closed-End Funds: Midyear Check On The Real Estate Space
Summary
- Real estate hasn't been a particularly strong area to invest in through 2022.
- It hasn't provided any meaningful shelter despite being a natural inflation hedge.
- I believe higher interest rates, concern about an economic slowdown and slowing real estate demand are causing this.
- For long-term income investors, there are still opportunities to put capital to work in CEFs.
Written by Nick Ackerman, co-produced by Stanford Chemist. This article was originally posted to members of the CEF/ETF Income Laboratory on August 20th, 2022.
It's been a rather tumultuous year for investments. Real estate hasn't been able to escape the volatility. However, that's usually when opportunities arise for investments. Today, I'm looking to revisit the closed-end REIT-focused funds to see potential opportunities.
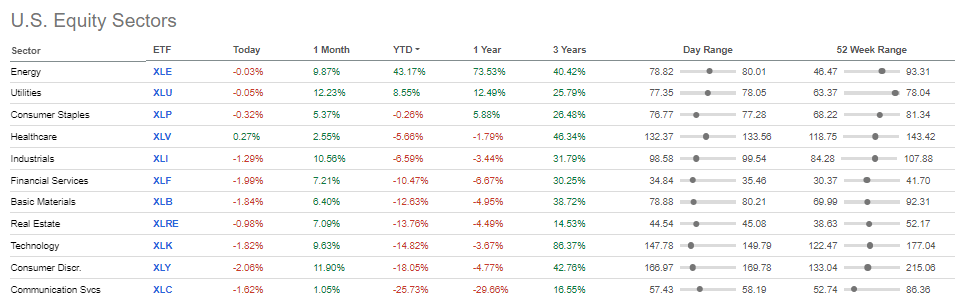
Overall, real estate is in the bottom half of sector performances and seems a bit counterintuitive. One of the main reasons for the bear market we saw this year was inflation. Inflation has been running incredibly hot. Real estate is generally considered a natural hedge against inflation as property values would generally rise.
However, with higher inflation comes higher interest rates. That can make REIT operations more expensive as they generally operate with significant borrowings to grow their operations.
Additionally, higher interest rates tend to end with an economic slowdown or recession. A recession means tenants could have difficulty paying their rent on time or could completely default.
On top of all this, we are now starting to see a real estate boom end. Home sales fell 6% in July . That has pushed the housing market into its own recession. While that's just homes, commercial properties show a similar sales decline.
I believe that these reasons are impacting the real estate/REIT sector overall, despite the natural hedge against inflation.
Some REIT Basics
Here are some basic details of CEF REITs from our previous look at the space.
REITs have been delivering a solid amount of payouts to investors since the structure was created. This goes all the way back to 1960 . Gone are the days when you have to actively manage your own real estate empire of physical buildings. Let an expert team do it for you.
Real estate investment trusts (“REITs”) have been around for more than fifty years. Congress established REITs in 1960 to allow individual investors to invest in large-scale, income-producing real estate. REITs provide a way for individual investors to earn a share of the income produced through commercial real estate ownership – without actually having to go out and buy commercial real estate.
In the closed-end fund space, we can go even more passive. Let the managers determine which REIT might be best to invest in. Though I own several real estate funds, I admit that I also enjoy picking my own REIT investments and doing some research into them.
One of the reasons that REITs have consistent and regular payouts that are often higher than other securities is their structure. The REIT structure says that at least 90% of their taxable income must be distributed to shareholders annually. This fits perfectly well with regulated investment companies ("RIC") CEFs themselves, as they too must distribute most of their earnings. That includes income and gains.
The Screening And Basic Data
In that previous piece, I had touched on Cohen & Steers's new fund that was coming to market. Since then, the Cohen & Steers Real Estate Opportunities and Income Fund ( RLTY ) was launched shortly after that posting. So with that, our little world of eight real estate CEFs grows to nine.
The data is primarily from CEFConnect as of 8/19/2022. Additional data was gathered from the sponsor website for RLTY.
| Name |
| Ticker |
| Premium/Discount |
| 52 Wk Avg |
| Distribution Rate |
| Effective Leverage |
| Baseline Expense |
| 5-Year NAV |
| 10-Year NAV |
| 5-Year Price |
| 10-Year Price |
| Aberdeen Global Premier Properties |
| ( AWP ) |
| -3.71% |
| -4.82% |
| 9.25% |
| 21.40% |
| 1.19% |
| 2.59 |
| 5.53 |
| 5.41 |
| 7.4 |
| CBRE Global Real Estate Income |
| ( IGR ) |
| -4.20% |
| -6.49% |
| 9.28% |
| 25.34% |
| 1.24% |
| 5.92 |
| 5.63 |
| 8.89 |
| 7.39 |
| Cohen & Steers Quality Income Realty |
| ( RQI ) |
| -3.38% |
| -2.98% |
| 6.34% |
| 24.21% |
| 1.28% |
| 10.18 |
| 10.95 |
| 11.44 |
| 11.83 |
| Cohen & Steers Real Estate Opp & Inc Fd |
| ( RLTY ) |
| -8.58% |
| N/A |
| 7.19% |
| 31.71% |
| 2.07%*** |
| Cohen & Steers REIT & Preferred Inc Fd |
| ( RNP ) |
| -3.52% |
| -3.69% |
| 6.77% |
| 26.34% |
| 1.04% |
| 8.42 |
| 10.29 |
| 10.21 |
| 11.32 |
| Cohen & Steers Total Return |
| ( RFI ) |
| 3.46% |
| 5.27% |
| 6.56% |
| 1.52% |
| 0.89% |
| 8.74 |
| 9.07 |
| 11.39 |
| 9.92 |
| Neuberger Real Estate Securities Income |
| ( NRO ) |
| -4.26% |
| -2.64% |
| 8.77% |
| 24.86% |
| 1.21% |
| 3.68 |
| 6.12 |
| 5.5 |
| 7.75 |
| Nuveen Real Estate Income |
| ( JRS ) |
| -4.45% |
| -5.01% |
| 8.29% |
| 32.08% |
| 1.27% |
| 6.04 |
| 8.05 |
| 5.54 |
| 7.28 |
| Principal Real Estate Income Fund |
| ( PGZ ) |
| -9.00% |
| -12.27% |
| 9.30% |
| 33.02% |
| 2.15% |
| 1.68 |
| 1.18 |
Above, we can see the nine funds that are identified as "real estate" by CEFConnect. I've included the name, ticker, premium/discount, 52-week average discount, distribution rate, effective leverage and baseline expenses. In addition to those important metrics, I've also included the 5 and 10-year total NAV and share price returns if they were available.
A few broad observations:
- The average discount of the list is 4.18%, only narrowed slightly from the 4.27% it was on 2/4/2022
- The average 1-year discount is similar at 4.08%
- The average distribution yield of these funds comes to a healthy 7.97%, that's meaningfully higher than the 6.8% previously
- Effective leverage employed comes to 24.50%, a rise from 21.01% as asset prices have come down, which is essentially why the yields have gone up
- The average expense ratio comes to 1.2% (***excluding RLTY as they report a 2.07% expense ratio, but that seems to be including leverage, we will get a better idea when they report their first annual report)
- 5-year average NAV annualized returns come to 5.90%, compared to share price annualized returns of 7.44%
- 10-year average NAV annualized returns come to 7.95%, compared to the share price annualized returns of 8.98% (PGZ and RLTY haven't been around long enough to provide figures here)
As I mentioned, I'm just looking for a quick update on each of these funds. If you want the more basic info, I've previously covered almost all of these funds for discussions of their investment policies. I'm writing this with the assumption readers have a basic baseline of understanding of these funds already.
RLTY And PGZ
These two real estate funds are quite different from each other but are showing the deepest discounts. RLTY focuses on equity REITs and preferred holdings. PGZ is the more unique fund here that focuses heavily on CMBS exposure. It's also the fund with the highest distribution rate at this time.
RLTY being a new fund is a bit expected because investors tend to sell off the funds until there's a longer track record. For PGZ, though, the fund's discount might be the widest, but based on the last year's average, it might not be a screaming buy.
Going back even further, over the last five years, we can see that PGZ is still elevated. That's generally what we've seen over the entire CEF space lately, valuations narrowing once again. That was after the broader market had made new lows but has subsequently been recovering since June.
Ycharts
I believe that RLTY is definitely interesting at these levels. It could be worth considering if an investor is looking for more retail exposure. As we will discuss below, its sister funds, RQI, RNP and RFI, have provided the best returns of the space.
RQI, RNP And RFI
These are the top performing three funds over the long run. RQI comes out as the strongest on every performance metric shown above; the 5-year NAV and share price, as well as the 10-year NAV and share price. This is then followed by either RNP or RFI in each category. For the longer 10-year period, it has been RNP. Naturally, real estate has provided relatively attractive long-term results, and RQI and RNP are both leveraged. RFI is quite similar to RQI but doesn't operate with leverage.
That being said, all three of these funds are relatively expensive based on their historical valuation. RFI typically commands a premium out of the group, but even that premium is slightly elevated at this time. Here's a look at the discount/premiums and the averages of those over the last five years.
Ycharts
Based on these valuations, RLTY could be of interest at this time. If they can produce their real estate magic prowess once again, RLTY has the best chance of being the top performing in the space going forward.
On a total NAV return basis, RLTY's performance is right between RQI and RNP.
Ycharts
This is consistent with what I viewed as RLTY being an in-between fund of RQI and RNP. RQI holds mostly equity REITs with only a small exposure to preferreds. RNP is a fund that's generally split around 50/50 between the two assets. RLTY is the middle ground of around a 70/30 split of equity and preferred.
IGR And AWP
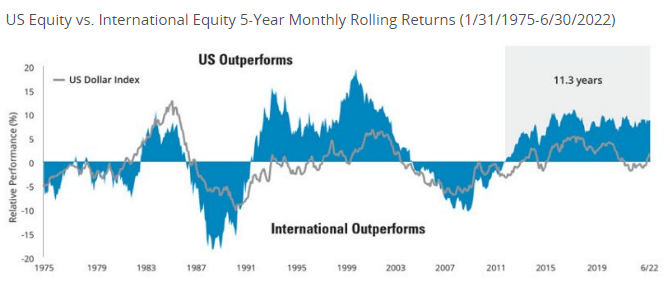
These are the global-oriented funds of the space. They've generally done the poorest of the group. On a total NAV return basis, it goes AWP as the worst and IGR as the second worst. For the five-year total NAV return basis, it has AWP as the worst, then NRO and then IGR.
The reason for this seems fairly simple, U.S. investments have been outperforming their international counterparts for most of the last decade. That isn't to say that this happens all the time, so trying to avoid recency bias is important. There have been several periods where the reverse has been true.
Based on valuations being even more depressed than U.S. investments, it could help lead to international being the top performing once again.
That being said, IGR and AWP are pushing against their historical valuations. It would appear other investors have the same idea in mind, that international investments are cheaper and could outperform. Therefore, they seem to be crowding into these funds much more than usual.
Other CEFs as a whole went to historically elevated valuations in 2021, then widened out in 2022. IGR and AWP seemed to have bucked that trend and just kept going higher. AWP did dip slightly first, then head higher, though.
Ycharts
NRO
NRO has the distinction of being one of the more performing real estate funds. Since they have a sizeable allocation to preferreds, we could expect the results to be more tempered. Still, RNP has a similarly weighted portfolio, and they've been one of the top performing in the space.
One thing that has hurt NRO over the years has been deleveraging. In 2017, they had $124.9 million in borrowings. This then went to $100 million in 2018 and 2019. With the severe sell-off due to COVID in 2020, they were forced to slash their borrowings to just $45 million. That caused permanent damage as everything rebounded sharply off those lows.
Ycharts
Today, they sit at $70 million in borrowings, never recouping the levels previously attained. It appears that being more moderately leveraged, around 25% these days, would leave them in a more flexible position of not being forced to deleverage. When a fund deleverages, it often damages the fund permanently. I don't suspect NRO will ever recover to those prior highs.
That being said, I wouldn't mind owning NRO again for short periods. It would have to be at a much deeper discount. I'd feel comfortable around 10%+. When you can invest with the best, why mess with the rest? In this case, RLTY is an even better deal with a fund sponsor with a much better track record. Of course, past results don't guarantee future returns.
JRS
JRS has suffered a similar fate to NRO, having to deleverage during rough patches. At this time, CEFConnect reports higher leverage than their website. The difference here appears to be that they took down some of their leverage since they last reported. I suspect we once again saw that with the June lows, their leverage increased too much, and they had to sell off some of their portfolio. That's what I highlighted in my recent JRS update.
Unfortunately, it doesn't appear that the management team with JRS has learned any lessons with their elevated leverage use. I say unfortunately because this is one that I continue to hold myself. Since my update, the discount has narrowed a bit, making it less appealing to buy now.
I continue to hold this position because I like that it brings different real estate exposure to the table. It, too, has a flexible strategy of investing in equity REITs and preferred stock. In this case, they bring sizeable allocations to residential and office REITs. I'm not much of a fan of office REITs, but some exposure isn't necessarily terrible.
If we look at RQI and RNP, we see less exposure to these areas. Instead, they seem to focus on more growth-focused REITs.
Conclusion
Real estate hasn't been a place to take shelter in 2022. However, no place besides energy and utilities has been a particularly strong area to invest in either. For the CEF space, I believe that RLTY brings up a compelling opportunity for those looking to put some capital to work in the REIT space. As a newer fund, I wouldn't anticipate the discount closing soon. It is a potential bonus if or when it does, though. If we get a further pullback from the latest rally and discounts widen, I think RQI, RNP and RFI would provide attractive long-term opportunities too.
For further details see:
Closed-End Funds: Midyear Check On The Real Estate Space