SAFE - Closing The Loop On REIT Prices And Discount Rates
2023-09-12 06:30:00 ET
Summary
- Requiring that the value of discounted cash earnings is near the Net Asset Value (NAV) explains why REITs are generally priced near NAV.
- It makes sense for the market to assign less value to future growth than to base cash earnings.
- Modeling these aspects provides some insight into which REIT sectors are opportunistic today.
Discount rates matter centrally for nearly all investments, and have been a focus for me. My ongoing work on Safehold ( SAFE ) has directed my attention their way even more strongly.
Setting those rates is key to the valuation of SAFE. But this article is not on Safehold; I ended up compelled to do the present article first.
My thinking led me back around to discount rates for the broad classes of equity REITs. And that in turn led again to the conundrum of growth.
Observationally, REITs are generally priced near their Net Asset Value per share, or NAV. Prices rarely get more than 20% above NAV.
This is at least using the median analyst estimate of NAV as truth. I like NAV as a theoretical construct, but do not believe that it can be accurately measured.
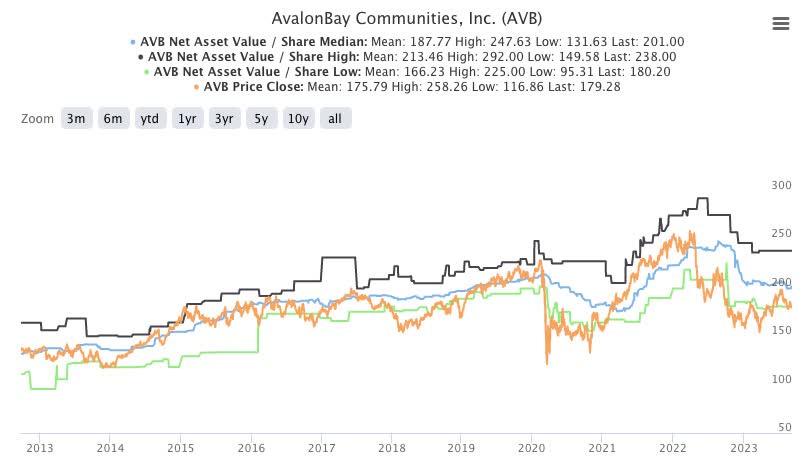
NAV is essentially a liquidation value, and one never really knows what any specific property will sell for. This graphic compares the range of analyst NAV estimates for AvalonBay ( AVB ), a REIT that should be steady if anything is:
The stock price is in orange. We see that at times (mid 2020, early 2023), AVB has been priced 30% below median analyst NAV. We also see that the full range of values sometimes reaches 50% of the median.
Median NAV pretty clearly is not a precision metric. Still, seeing a REIT priced 30% above or below median analyst NAV tells you something. Usually.
The problem with this observation that prices are near NAV is that the market is assigning very little value to future growth. It does not take much growth to double the net present value (“NPV”) of the cash flows a REIT will generate.
For example, if the discount rate is 10% and the growth rate will be 5% indefinitely, the NPV will double compared to the no-growth case. Quite a few REITs have 20-year growth rates of Net Operating Income, or NOI, in the ballpark of 5%. (Even comparing 5% to 2% — see below — gives a 60% increase in value.)
A question that has bothered me for quite some time is why the markets seem to give so little credit for growth. Perhaps I now understand. Let me share that understanding with you and tell me what you think in the comments.
Part of the point is that the NOI and its slow growth from existing buildings represents highly secure income in the long run. Yes, rents fluctuate and sometimes even crash.
But this is nearly always local geographically and always limited in duration. Over the long run a good building, if well maintained, will deliver, except in the rare case that its entire asset class becomes uneconomic
In contrast, the growth of the total NOI for a REIT carries more risks. These include geographical, inflationary, economic, execution, and other risks. It may make sense to consider the value of the likely growth through a different lens than the value of ongoing, slowly increasing rents.
Balancing NAV and the NPV of the Cash Earnings
We begin with asking, for a generic REIT, how the cash earnings must be valued for the stock price to be at NAV. Consistent with the observation above, we will assume that these earnings grow with inflation at about 2%. We take up the implications of stronger growth below.
The cash earnings is NOT Funds From Operations, or FFO, and also is not Adjusted FFO. See this article for why.
Let’s refer to the cash earnings as FDR, for “Funds available for Distribution and Reinvestment.” We could call this FAD, but that might trigger unwanted associations with somebody else’s semantic view of a definition.
A. Discount Rates
Now FDR is in the ballpark of half of NOI. So the NPV of an indefinite string of cash earnings growing at a 2%, with future earnings discounted, is
NPV = 0.5 NOI / (Discount Rate - 2%) .
For a 7% discount rate the NPV is 10 NOI. On the property side the Loan to Value is usually about 40%. So the NAV is
NAV = 0.6 x Property Value = 0.6 NOI / Cap Rate .
For a 6% cap rate the NAV is 10 NOI. We can set the NAV equal to the NPV and do a bit of algebra to find
Discount Rate = 2% + Cap Rate / 1.2 .
So for a 6% cap rate we get a 7% discount rate. And for cap rates from 4% to 8% we get discount rates from 5% to 10%. These discount rates are lower than common wisdom might lead one to expect, a topic we return to later.
A bigger picture point that matters greatly is this. If one is to value the REIT cash flows near NAV, then as cap rates increase discount rates also must increase. The implication discussed next is that earnings multiples must also decrease.
B. Net Present Values
Continuing our view of a generic REIT, we can plot the earnings multiple, NPV to earnings, for this range of discount rates. Here it is:
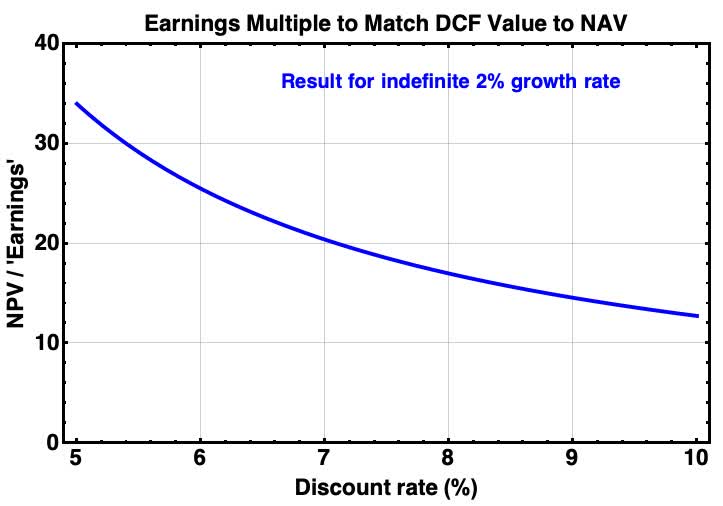
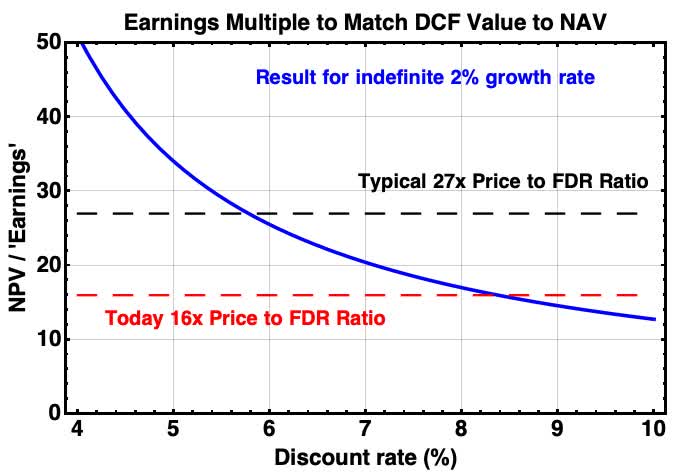
Now if we wrongly imagine that FFO is earnings, as much of the world seems to, we would display this overlay.
RP Drake
This would make us think that the discount rate has moved from near 7% to around 10% as the ratio of Price to FFO has dropped from 20x to 12x for many excellent REITs. But as we discussed, the earnings that matter are FDR not FFO. We show this in a next overlay:
Now we see that the discount rate has moved from near 6% in early 2022 to about 8% today. The increase of 200 bps is sensible, considering the change in the 10-year Treasury Rate from 2019 to now.
Balancing NAV and the NPV by REIT Sector
Next we apply the framework above to several REIT sectors. This makes for more complex plots and a chance to learn some new things.
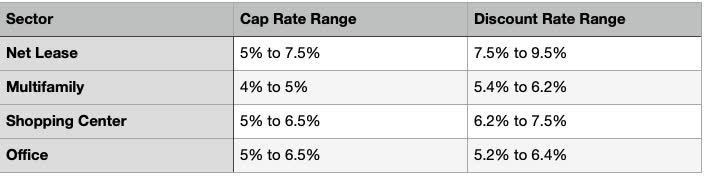
The ratio of FDR to NOI varies as does Loan to Value. That factor of 1.2 above now should be replaced by the values shown in the column shaded blue as typical for the stronger REITs in each sector:
RP Drake
Note that while the Loan to Value is typically 40%, for the big and highly-rated REITs in the Multifamily sector it is more like 30%. Also note that the rightmost column shows what one must multiply the P/FFO ratio by to get an actual multiple on cash earnings.
This lets us plot the relation of Discount Rate and Cap Rate for these REIT sectors, as follows.
Now we see the connections. For each sector, we can take cap rates from the lows of the recent boom times to the highs we have seen lately (based on sampling earnings calls). We are not seeking extremes, but rather reasonably typical values. That gets us a range of discount rates for each sector, shown here.
The range is wider for the Net Lease sector. This reflects the diversity of target properties pursued by different REITs within it.
Now, recognizing that ‘earnings’ should be taken to be FDR we can do earnings-multiple curves. These show NPV/FDR for these sectors and ranges of discount rates. The discount rates span from 2019 (left end of curve) to 2023 (right end of the curve), except for Net Lease.
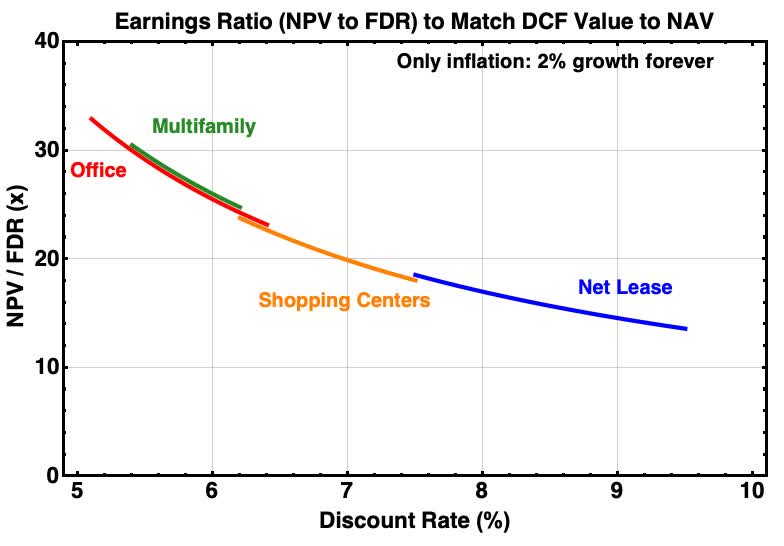
Generating this plot was quite exciting for me. It explains the relative pricing of the different REIT sectors. Office may seem high but that reflects the higher ratio of FDR to FFO for that sector, which in turn reflects its higher ongoing capex.
With a little work, one can see aspects of market pricing here too. The end of 2019 was a period of market skepticism about strip-centers. Shopping Center REITs were priced near a P/FFO of 14, corresponding to a P/FDR of 21. The market was giving them no credit for future growth.
In contrast, the during 2019 the market became increasingly enthused about Net Lease REITs. They were priced near a P/FFO of 20. This would imply P/FDR of 22. The market was pricing in a few turns of value for future growth.
What is not included in the above is any explicit discount for default rates. At the moment, some observers seem to believe that the office sector is about to completely implode and suffer massive defaults.
Consider me skeptical on that. It seems relevant to me, for example, that the expiring loans on Class B properties per year for the next three years are less than 4% of the entire office market in Manhattan.
Any building that can be viable at any value is more likely to end up with a capital structure that matches that value than to be abandoned. Some buildings will be abandoned and replaced, of course, but one needs to keep the story in context.
In addition, the Office REITs primarily own the better buildings. For nearly 20 years, through the Great Recession, very few REITs have produced large permanent losses for investors. By my count, the annual rate of such losses has been in the ballpark of 0.1% per year.
That looks like BBB to BBB+ bonds. It supports discount rates of ongoing earnings well below 10% and is consistent with the above estimates.
Quantifying the Value of Growth
This leads us to the topic of growth and how to think about it. The future (per share) cash flows produced by the addition of new properties to the portfolio has value. Benefiting from such growth is part of the point of owning a REIT.
BUT such growth is far more uncertain than continuing rents are. Threats to growth of earnings include
- Increasing interest rates, a big factor lately
- Difficult capital markets or real-estate markets, also a recent issue
- Tenant difficulties
- Oversupplied local markets
- Impacts of recessions
- For those that develop new properties, impacts of inflation
- …. and others
Some of these threats may lead to reduced revenues for a time, but revenues come back. The fluctuations seen in the history of FFO/sh for AvalonBay ( AVB ) are illustrative here. See this article for more detail.
RP Drake
There is an implication for the value of earnings growth beyond some low level produced by long-term inflation. Such growth should not be valued at the same low discount rates as are the base earnings from the buildings.
To account for this, I split the DCF calculation into two parts, with the first matching the calculation above and the second accounting for additional growth. The next plot will show the increment to the FDR multiple produced by portfolio growth.
[For math geeks: to get there extract a factor of (1+(total growth rate less 2%)/1.02) from the expression (1 + total growth rate). Then Taylor expand the factor and keep only the first term, since the expansion variable is quite small. Then split the DCF formula into two parts.]
One also must consider the duration of this growth. If one lets it be indefinite, then a very large fraction of the value comes from very distant years.
Here, following the thinking in this article , I limited the period of stronger growth to 15 years. That gives the following plot for the incremental value produced by growth:
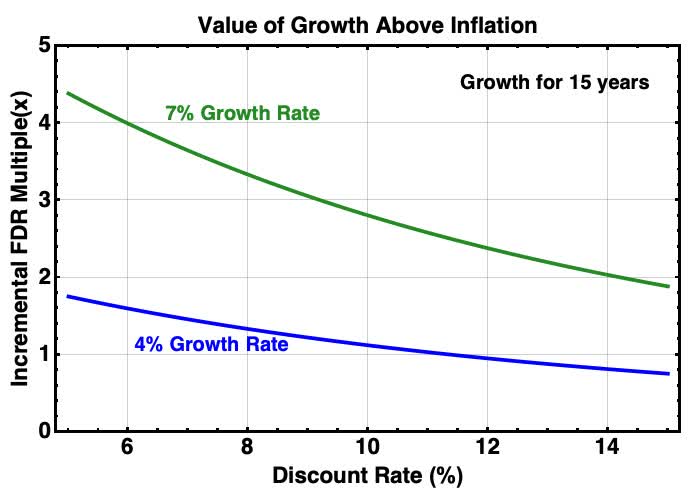
For context, a 4% total growth rate is decent for a REIT and some have done less than that long-term. And 7% is high. No REIT has sustained that high a growth rate of per share NOI, FFO, or FDR over 20 years.
So what we find is that the incremental value of growth is around 1 turn on Price/FDR for decent earnings grown. It can be less, and might reach 3 or 4 turns for special cases.
In other words, the ballpark incremental value from growth often contributes 5% to the total value, and perhaps in some cases as much as 20%. The market might price some REITs at 20% above NAV it perceives strong growth to be likely and secure. This for example, was true of some Net Lease REITs including Realty Income ( O ) at the end of 2021.
In contrast, enthusiasm for Realty Income and other Net Lease REITs was extremely high at the end of 2019. I remember well the arguments on SA about whether, at a 54% premium to NAV , O was overpriced. We find here that such high valuations are hard to justify, even if one thought their per share growth rates would persist at more than 5% for more than 15 years.
In contrast, AVB and other big Multifamily REITs were priced at 20% above NAV in late 2019 but much closer to NAV in late 2021.
Revisions to My Views
Three fundamental adjustments to easy calculations of REIT value now make sense to me. The easy calculation is to take FFO/share and divide it by [discount rate less growth rate] to find a value.
First, one must realize that FFO and even AFFO may not represent the cash earnings an investor should care about, here labeled FDR. At this point I’ve been writing about that for a few years.
Second, it does not make sense to assume that growth continues forever at anything above a low rate, as the easy calculation implicitly does. That has entered my calculations much of the time for some years and I explored it more thoroughly here . But sometimes it has been too easy to give in to laziness.
Third, the discount rate applied to the continuing earnings should differ from that applied to anticipated future growth (beyond inflation). If you do not do this, then you have to apply too large a discount rate to all the earnings in order to make any sense of REIT pricing.
Failing to think about different categories of earnings independently has long led me to the view that REIT discount rates were near 10%, as detailed here . The problem is that this does not really make sense.
The modern blue-chip REITs are large, robust cash-generation machines. They might grow slowly but they face no risk of bankruptcy and dividend cuts will be rare and recoverable. It just makes little sense to discount their base cash flows at rates of 10% or more. [Note: This whole article applies only to equity REITs.]
REIT pricing today
All the above gives us context for a look at REIT pricing trends today. Let’s look at how the curves found above compare to current ratios of Price to FDR for big, solid REITs.
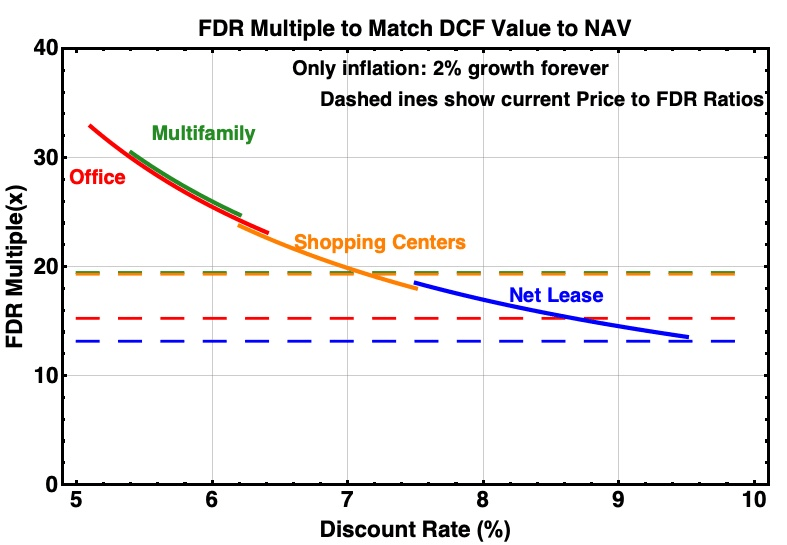
For the Net Lease sector, current pricing corresponds to the right end of the blue curve. The 9.5% discount rate connects to a 7.5% cap rate.
It appears that much of the Net Lease sector may be reasonably priced today, with the decrease reflecting current cap rates. One can expect near- or intermediate-term upside if one believes that cap rates will decrease on those timescales.
Owning these for dividends makes sense to me, and I now own NNN REIT ( NNN ), W.P. Carey ( WPC ), and Spirit Realty Capital ( SRC ), with my recent articles on each in the links. But I would not own them for upside.
I do appreciate quite a bit the argument made recently by Dane Bowler that these REITs have seen price drops in part because a lot of investors have moved to bonds this year. But the question remains whether the departure of TINA has led to underpricing or reasonable pricing. The analysis here suggests the latter, until cap rates come back down.
The Shopping Center sector seems to be priced today for some growth, because the price point is to the left of the right end of the orange curve. That sector has seen stellar results, which have been rewarded in the markets. I would not object to owning it for dividends, but not really for upside. I own none of these at the moment, and have recently looked at Federal Realty Trust ( FRT ) and decided not to invest.
The Multifamily sector is more intriguing. The green dashed curve intersects the pricing curve at a discount rate near 7%, almost 100 bps above the right end of the green curve for current multifamily cap rates.
This comparison leads to a view that Multifamily REITs may be underpriced by perhaps 25% even for current cap rates . If cap rates were to return to their 2019 values, the upside would go to 50%. (The highs in 2021 still look unreasonable, though.)
For AVB in particular, this view is somewhat more optimistic than where my deep dive from earlier this year ended up. Even so, the upside is not high enough for me to move into AVB as an upside play.
The Office sector is the one that looks underpriced relative to current cap rates by 50%. This should surprise no one.
Of course there is more risk beyond factors considered by the modeling here, as was touched on above. Risk and reward, eh?
I just missed getting into BXP REIT ( BXP ) this year, as was discussed here . The other main office REITs have levels or structure of debt that makes me too uneasy.
One of my investments for upside is in a related sector. It is Alexandria Real Estate ( ARE ), the only REIT in the Life Science sector. Reading their annual reports is a unique and worthwhile experience.
Takeaways
Connecting discount rates for base cash flows to cap rates is possible by asking that total NAV balance the discounted value of those base cash flows. Doing this naturally explains the relative pricing of the REIT sectors.
My current view is that cap rates are more likely to go halfway back to where they were in the era of TINA and ZIRP than all the way. This would make a return to 2021 highs unlikely for the REIT sectors discussed above.
The increase of cash flows that will come from future growth should be discounted more strongly to reflect the larger uncertainties associated with such growth. The incremental value produced by growth will often lie in the range of 5% to 20%, a small fraction compared to typical cyclic market fluctuations.
This is why REIT prices tend to be near the estimated NAV. And when they are a lot higher the reason is very likely over-enthusiasm in the markets. Those are good times to sell.
At the moment we have the reverse situation. All REITs should see increases in earnings multiples if and when cap rates decrease. But the opportunities for upside at current cap rates appear to me to be concentrated in the Multifamily and Office (and Life Science) sectors.
For further details see:
Closing The Loop On REIT Prices And Discount Rates