XLK - CME Group: Valuation Issues Persist
Summary
- Financial data exchanges like CME Group Inc. have ballooned in value over the past 20 years.
- Future regulation may prove costly to the financial derivatives industry.
- CME Group implied value: $100.
Investors should hold shares of CME Group Inc. ( CME ). Competitive pressures from Intercontinental Exchange, Inc. ( ICE ), coupled with potential regulatory issues, have combined to hurt CME Group's valuation.
The stock has had a great run. $10,000 invested on January 1, 2003 would be worth over $198,000 today. Furthermore, it has dramatically outperformed the S&P 500 (SPY), S&P Financial Select Sector (XLF), and S&P Technology Select Sector (XLK) over the past 20 years.
CME Group Background
CME Group has almost 200 years of expertise in the financial derivatives industry. Innovation has been at the heart of its business, and the firm continues to be a global leader in derivatives trading. As a holding company, CME Group encompasses a number of global exchanges. The most notable are the Chicago Mercantile Exchange, New York Mercantile Exchange, and Chicago Board of Trade. The consolidation of the firm took place through M&A activity in 2006 and 2008 .
87% of CME Group's outstanding stock is held by institutional shareholders. Vanguard and Capital Group Companies are the biggest of these shareholders, with each firm holding an 8% stake in CME Group. While CME's management doesn't hold many shares, their sentiment has been decisively negative throughout 2022. The first large scale selloff, in February and March 2022, saw 6 different insiders sell at least 4% of their holdings at prices between $227 and $244. In August and September, multiple insiders made more open market sales with prices ranging from $190 to $203. Strategic buyers have paid similar prices as, according to the firm's most recent 10Q , CME Group repurchased its own stock at an average price of $191 between September 1 and September 30, 2022.
Business Description
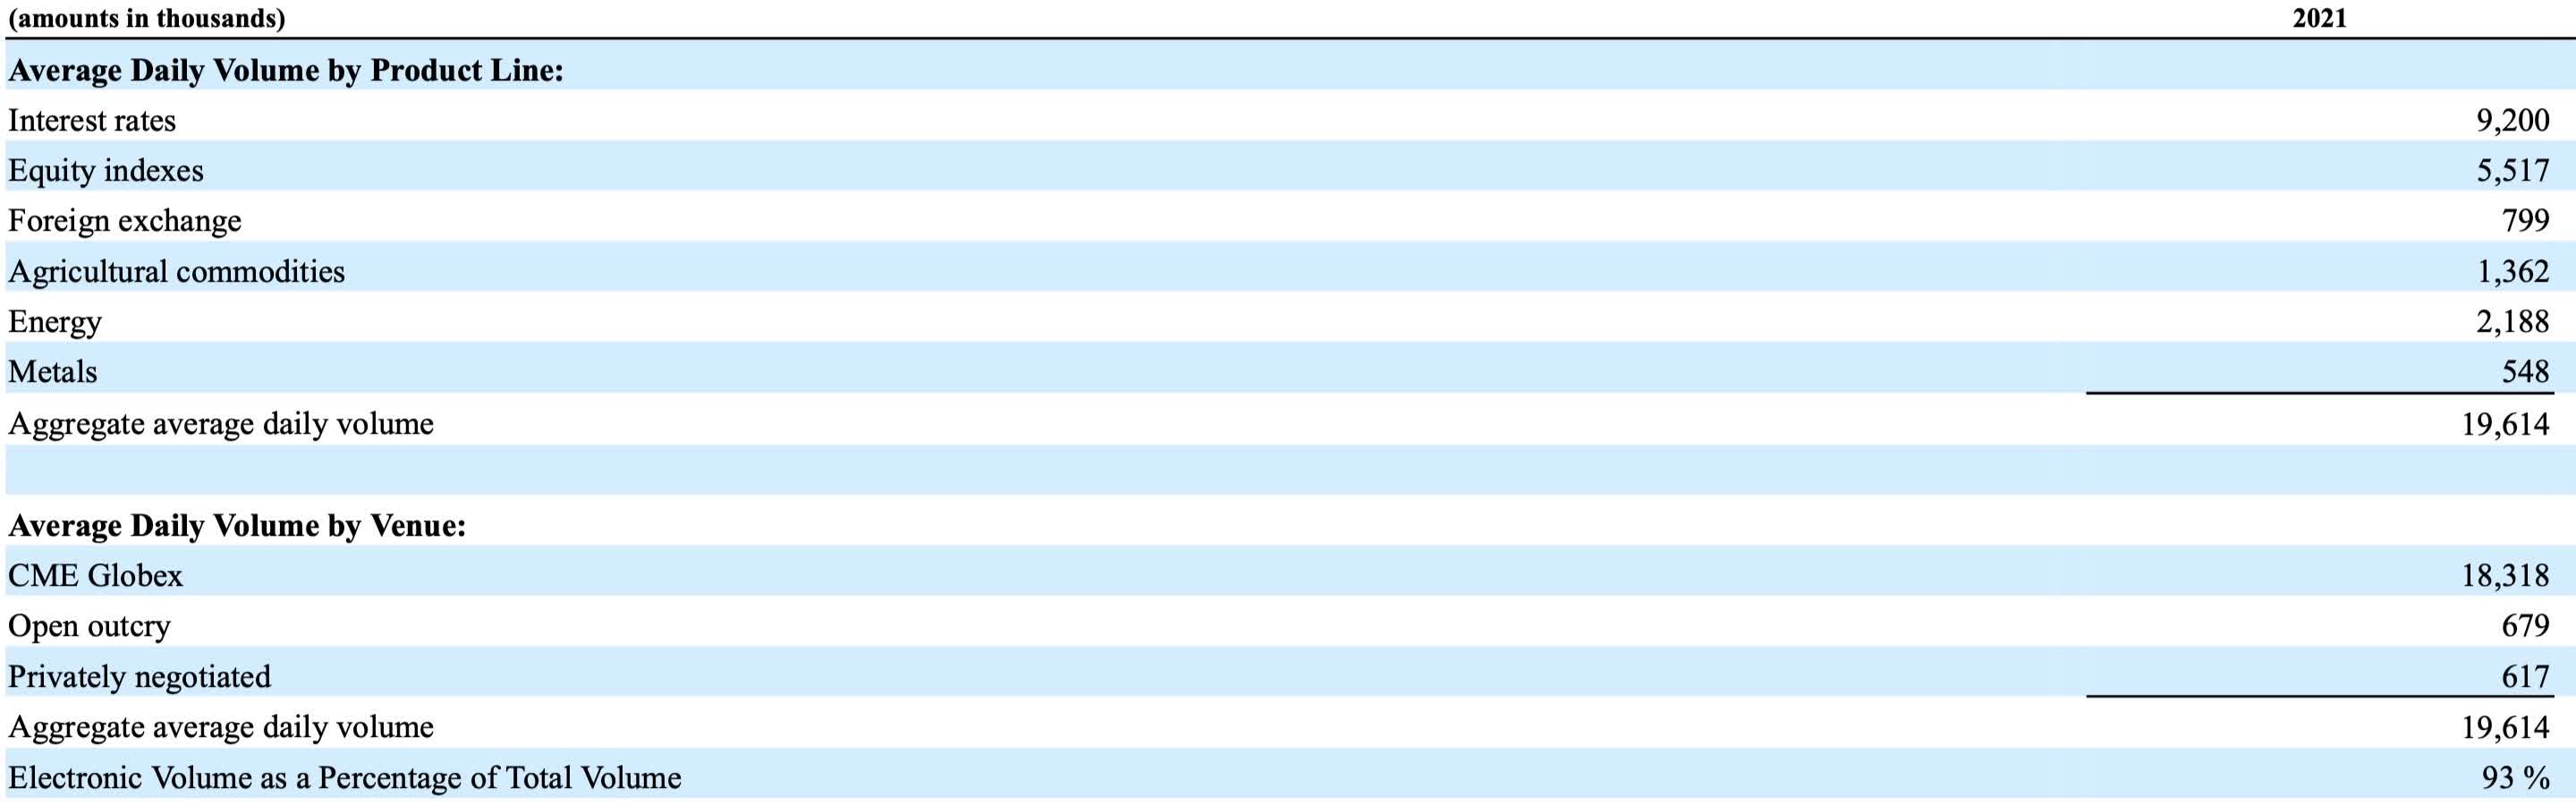
CME Group Inc. provides a place of exchange as well as clearing services. The firm's value lies in its continued ability to provide entities who want to trade financial derivatives with a place to do so. Its primary products are options and futures related to interest rates, equity indexes, foreign exchange, agricultural commodities, energy, and metals. These financial instruments can be used by investors to hedge or speculate.
Firm revenues by product line and venue. (CME Group 2021 10K)
Industry Leaders
When constructing a peer group for CME Group Inc., I was most concerned with market cap and geographical distribution. There are a multitude of worldwide futures exchanges, but not all of them match up against the overall market presence of CME Group. CBOE Global Markets, Inc. ( CBOE ) presents a great example of this dilemma. CBOE encompasses the Chicago Board Options Exchange and engages in many of the same business activities that CME does. However, CBOE has a market cap of $13.05B compared to CME's $62.97B market cap.
| CME |
| Chicago, US |
| $62.97B |
| 3,480 |
| Ticker |
| Headquarters |
| Market Cap |
| Employees |
| ICE |
| Atlanta, US |
| $60.59B |
| 8,935 |
| LNSTY |
| London, UK |
| $51.34B |
| 23,261 |
| DBOEY |
| Frankfurt, DE |
| $32.73B |
| 10,620 |
| NDAQ |
| New York, US |
| $30.49B |
| 6,300 |
Relative Valuation
Valuing a company relative to its peers is a slippery slope. I want to underscore that the choice of which companies to compare with which metrics is subjective. Different people do it different ways and I have tried to keep it as simple as possible. The purpose of this step is to understand whether the market has viewed CME and its peers as growth or value stocks over the past decade.
I think that price/earnings and price/book multiples are good places to begin analyzing CME Group's performance. The firm is currently trading at 24 times earnings. This seems to be reasonably fair relative to its competitors. The average P/E for its peer group has been between 20 and 30 since 2013. With respect to their tangible price/book ratios, CME Group and its peers all have negative values. This means that each firm's tangible assets are lower than liabilities . The accounting equation of assets = liabilities + shareholder's equity still holds true because these firms carry many intangible assets on their balance sheets. As a disclaimer, I have chosen to compare American companies using U.S. GAAP with international companies using IFRS. These differing accounting standards can make true comparisons difficult. However, I feel that the essence of each company's financial condition is captured here.
Earnings appear to be a key driver in stock appreciation amongst CME Group and its peers. Each company at least doubled its earnings over the past decade, with ICE tripling its earnings. Growth in free cash flow has been another bright spot for CME and its peers. I think that it is apparent that growth metrics have been emphasized over value metrics over the past decade. It is nice that CME has shown more consistency in these areas than its competitors, but I believe that this alone does not yet make it a good value pick.
CME Group and its peers have shown tremendous growth since 2013. Unfortunately, earnings growth comes with expense growth too. Interest expense is a good area to measure this phenomenon since it provides a good picture of a company's risk tolerance. I used log scale on the below graph to smooth the data a bit. If I had not done this, the dramatic difference between ICE's rising interest expense and the other peer group members would be more evident. CME Group has been thoughtful in minimizing its interest expense.
Profitability ratios are useful for evaluating how effectively a firm is utilizing its economic resources. Assets are not to be taken lightly. They are a firm's ability to generate "natural" returns for shareholders. I think that this is an ironic point to make in an article about CME Group. After all, CME aids in derivatives transactions that allow firms everywhere to generate all kinds of "unnatural" returns for shareholders. Interestingly enough, CME does utilize its assets more efficiently than most of its competitors utilize theirs. CME has sadly not been as successful when putting its equity financing to good use. Its nearly 10% return is not bad, but lags that of domestic competitors ICE and Nasdaq.
DDM Valuation
In my past two articles, I have used discounted dividend models as opposed to discounted cash flow ("DCF") models to illustrate each firm's implied value. DDM models are effective because they compensate for the earnings volatility of many financial services firms. CME Group is considered to be a financial services firm, but its earnings are much more stable. The firm's earnings stability is enough to justify a traditional DCF model. However, I think that focusing solely on dividends underscores the importance that investors place on the firm's cash flow growth.
The crucial assumption underlying CME Group's valuation is conservative five year economic growth. I estimated GDP growth to be 1.25% per year, and assumed that the firm's dividends would grow at a slower rate than they have over the past decade. This is all about establishing a margin of safety .
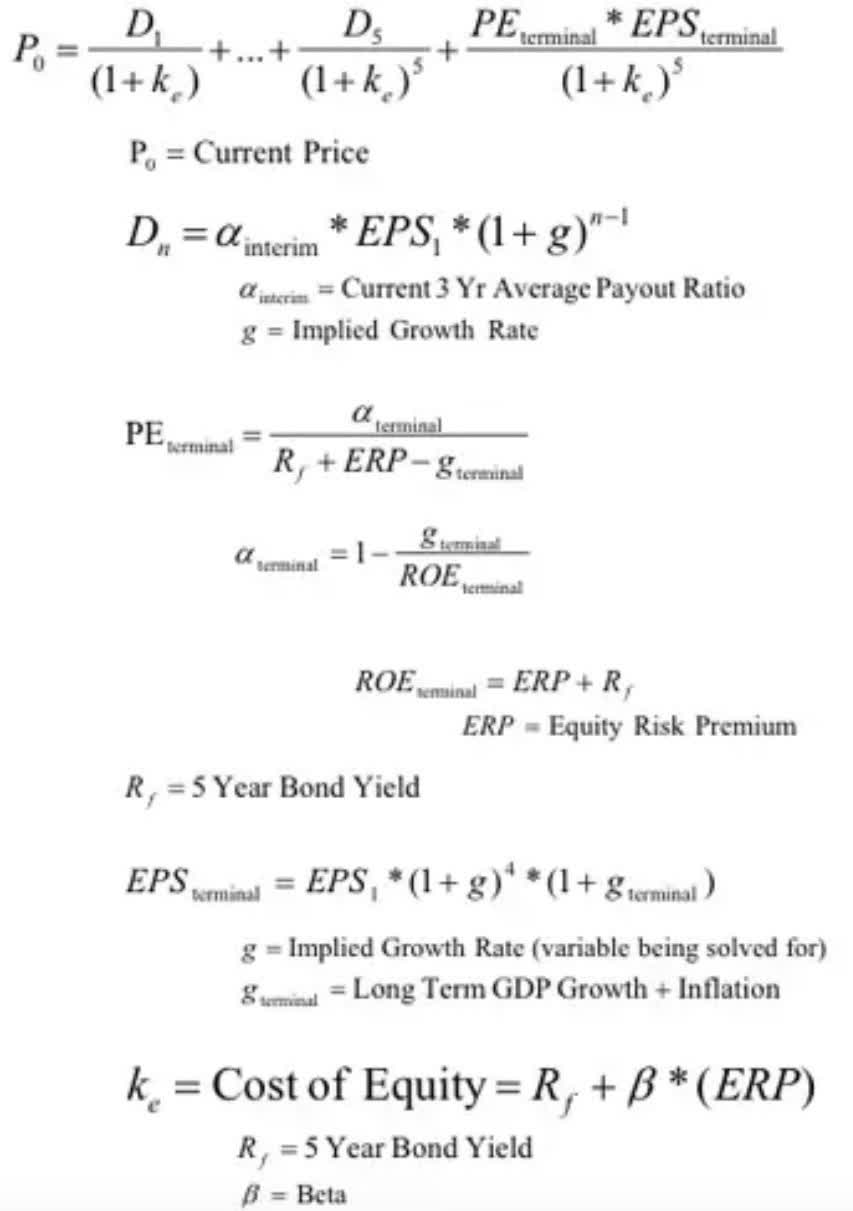
For the physical calculations, I relied on a DDM formula from an old Goldman Sachs pitch deck available online . Here are the formulas:
Goldman Sachs Global Economics, Commodities, and Strategy Research
For the terminal P/E value, I chose 15 instead of the mathematically derived 12.5. CME Group's average PE since its 2002 IPO sits around 27. The past certainly doesn't predict the future, but 15 times earnings seems to be a more reasonable equilibrium estimate.
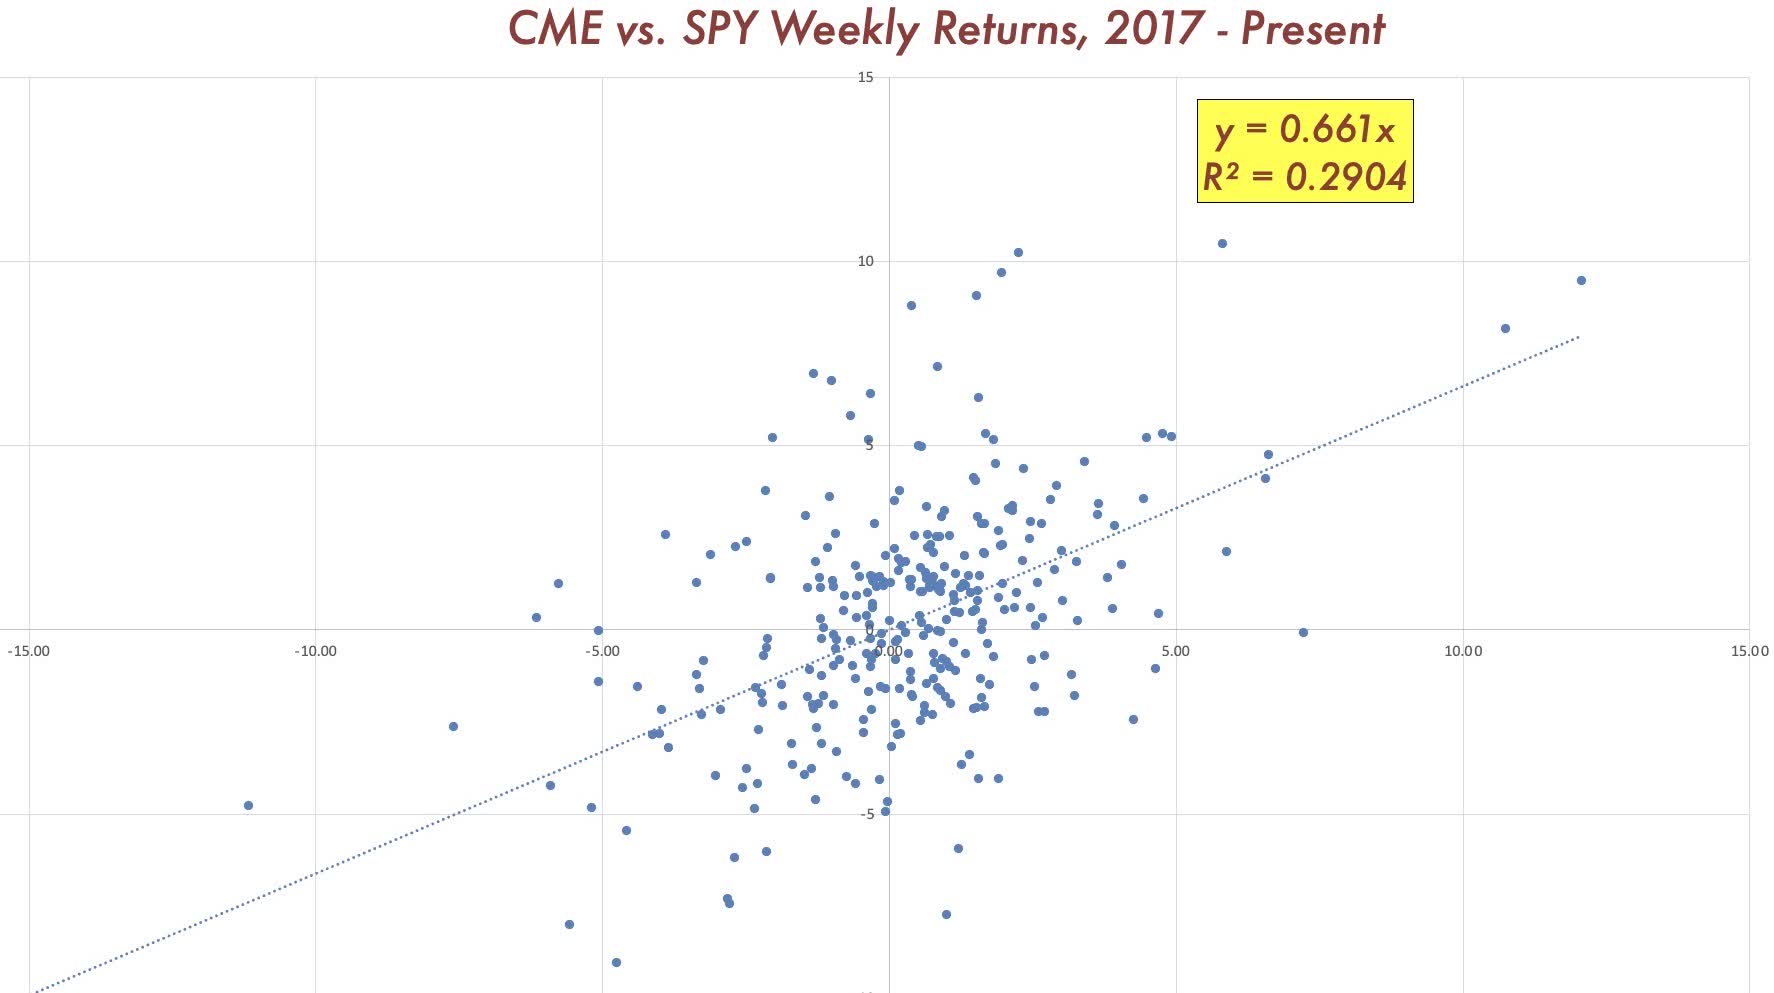
I calculated CME's equity beta by regressing the firm's weekly historical returns since 2017 against those of the S&P 500 (SP500) as represented by the SPDR S&P 500 ETF Trust.
Finally, these inputs were combined to arrive at an implied value of roughly $100. This is considerably lower than the firm's current share price and I want to discuss a few key points in more detail. First, I believe that the inherent structure of a conservatively-priced DCF or DDM will make CME Group look overvalued. A dramatic slowdown in historic growth rates will inevitably hurt the firm's valuation. In addition, while CME Group may be mathematically overvalued, the calculations alone do not tell the whole story. An investor should look holistically at many different factors instead of simply considering a theoretical model.
| Inputs |
| Values |
| D1 (2023) |
| 1.05 |
| D2 (2024) |
| 1.10 |
| D3 (2025) |
| 1.13 |
| D4 (2026) |
| 1.16 |
| D5 (2027) |
| 1.22 |
| k |
| 7.15% |
| g |
| 1.25% |
| ? |
| 0.66 |
| PE (Terminal) |
| 15 |
| EPS (Terminal) |
| 8.73 |
| Implied Value |
| $100.28 |
Risk Factors
The chief risk for CME Group is regulatory. Investors must consider whether or not there be another financial crisis (i.e. 2008) that is partially blamed on the excessive usage of derivative products? The Commodity Futures Modernization Act of 2000, which substantially de-regulated the derivatives industry, played a crucial role in CME Group's success over the past two decades. Writer James Grant, of Grant's Interest Rate Observer , has posed the question "what will future lawmakers seek to regulate?" I strongly feel that this notion applies here, especially in consideration of the fact that CME Group goes into great detail about the implications of activist regulatory proceedings under risk factors in its 2021 10K .
The firm is also reliant on its ability to maintain exclusive licensing to continue creating new financial products that are in demand. For example, the firm must pay for the ability to sell futures products of indices like the Dow Jones. CME Group has effectively managed the risk of purchasing these licenses in the past, but rising expenses and competition may hinder its ability to do so in the future.
CME Group has effectively managed its credit rating over the past few years. It currently maintains a long term AA- rating from S&P and Aa3 from Moody's. Investors should always be mindful of a firm's ability to borrow and maintain a stable credit rating.
Investment Conclusion
I really want to like CME Group Inc. Financial exchanges are great businesses, but the market is still viewing them as growth stocks (~25 PE ratios). Should CME Group be considered a part of the financial sector? Is it really more akin to Mastercard ( MA ) as an info tech company? In that case 25x earnings isn't so bad. I wish I could have gotten on the CME train a few years ago. As it stands, I feel that the risk is not being appropriately priced. Even if equity investors require a mere 5% return on CME group, it still isn't a bargain.
Value is about being patient. It probably won't be found in large-cap stocks. However, firms like CME Group have caught my eye because they are " the biggest " at something and many people haven't heard of them.
I am fine with missing the potential upside in CME Group Inc. Hold to me means that I want to buy, but I just feel that the risk is not priced correctly. Should regulatory risks come to pass or new M&A activity come to bear, I think CME Group Inc.'s valuation will improve.
For further details see:
CME Group: Valuation Issues Persist