FVI:CC - Coeur Mining: Rochester Expansion Near Completion But Costs On The Rise
2023-08-29 05:17:44 ET
Summary
- Coeur Mining's second-quarter revenue decreased by 13.2% YoY, with gold and silver sales accounting for the majority of revenue.
- The company reported a net loss of $32.41 million for the quarter, compared to a loss of $77.43 million in the previous year.
- Gold and silver production was strong at Rochester and Wharf mines, but weaker at Kensington mine due to water flow and paste backfill issues.
- I recommend buying CDE between $2.35 and $2.15 with lower support at $2.
Part I - Introduction
Chicago-based Coeur Mining, Inc. (CDE) released its second-quarter results on August 9, 2023.
Note: I have followed CDE quarterly since April 2019. This new article is a quarterly update of my article published on May 17, 2023.
1 - Q2'23 results snapshot
Coeur Mining's quarterly revenue was $177.24 million , representing a decrease of 13.2% year-over-year. Gold and silver sales represented 68.5% and 31.5% of quarterly revenue.
Net income was a loss of $32.41 million , or $0.10 per diluted share, compared to a loss of $77.43 million, or $0.28 per share last year.
Gold and silver production for the quarter totaled 68,406 Au ounces and 2.388 million Ag ounces . Stronger production at Rochester and Wharf compensated for a weaker quarter at Kensington mine in Alaska due to excessive water flows and paste backfill issues, which delayed production timing from certain stopes.
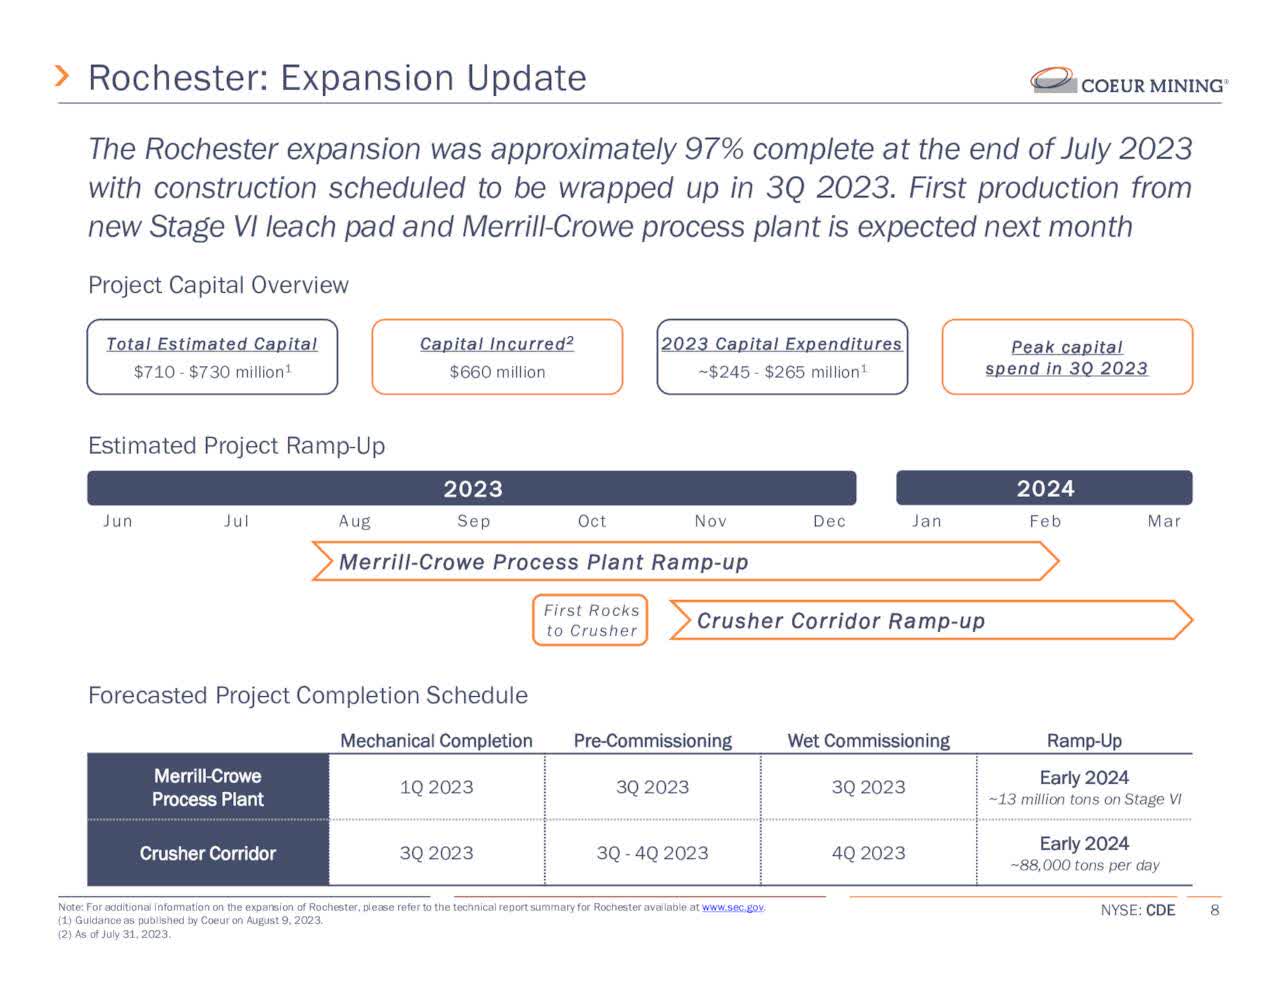
One important positive topic this quarter is the near completion of the Rochester expansion , which was 97% as of July 31, 2023.
However, on the negative side, Mitch Krebs indicated that the bad weather experienced in Northern Nevada and the shortage of skilled labor impacted costs.
With the Ongoing inflationary pressures and skilled labor availability and productivity challenges, the company indicated that the total CapEX went up to between $710 million and $730 million , or about 6% to 9% above the previously estimated $607 million discussed in last quarter's call.
CEO Mitch Krebs said in the conference call :
[W]e're very pleased to report that the expansion was approximately 97% complete as of July 31, and is moving quickly toward completion. However, downtime from lightning and rain in Northern Nevada combined with an ongoing shortage of skilled labor and related productivity challenges is driving an increase in the number of contractor hours required to finish up the project this quarter.
Finally, the company announced that the State of Dakota approved the Boston expansion at the Wharf mine.
Coeur has received a state mine permit from the South Dakota Board of Minerals and Environment allowing for a fifty-acre expansion of mining operations at Wharf which is expected to add significant certainty to Wharf's current eightyear mine life. (Press release)
2 - Stock Performance - CDE underperforming its peers
Coeur Mining, Inc. performs poorly in my portfolio's gold and silver miners. CDE sank significantly on a one-year basis and has underperformed the iShares Silver Trust ETF (SLV), the VanEck Vectors Gold Miners ETF (GDX), and Fortuna Silver Mines (FSM), and Pan American Silver (PAAS). The stock is down 14% YoY.
3 - Gold And Silver Production in Q2'23
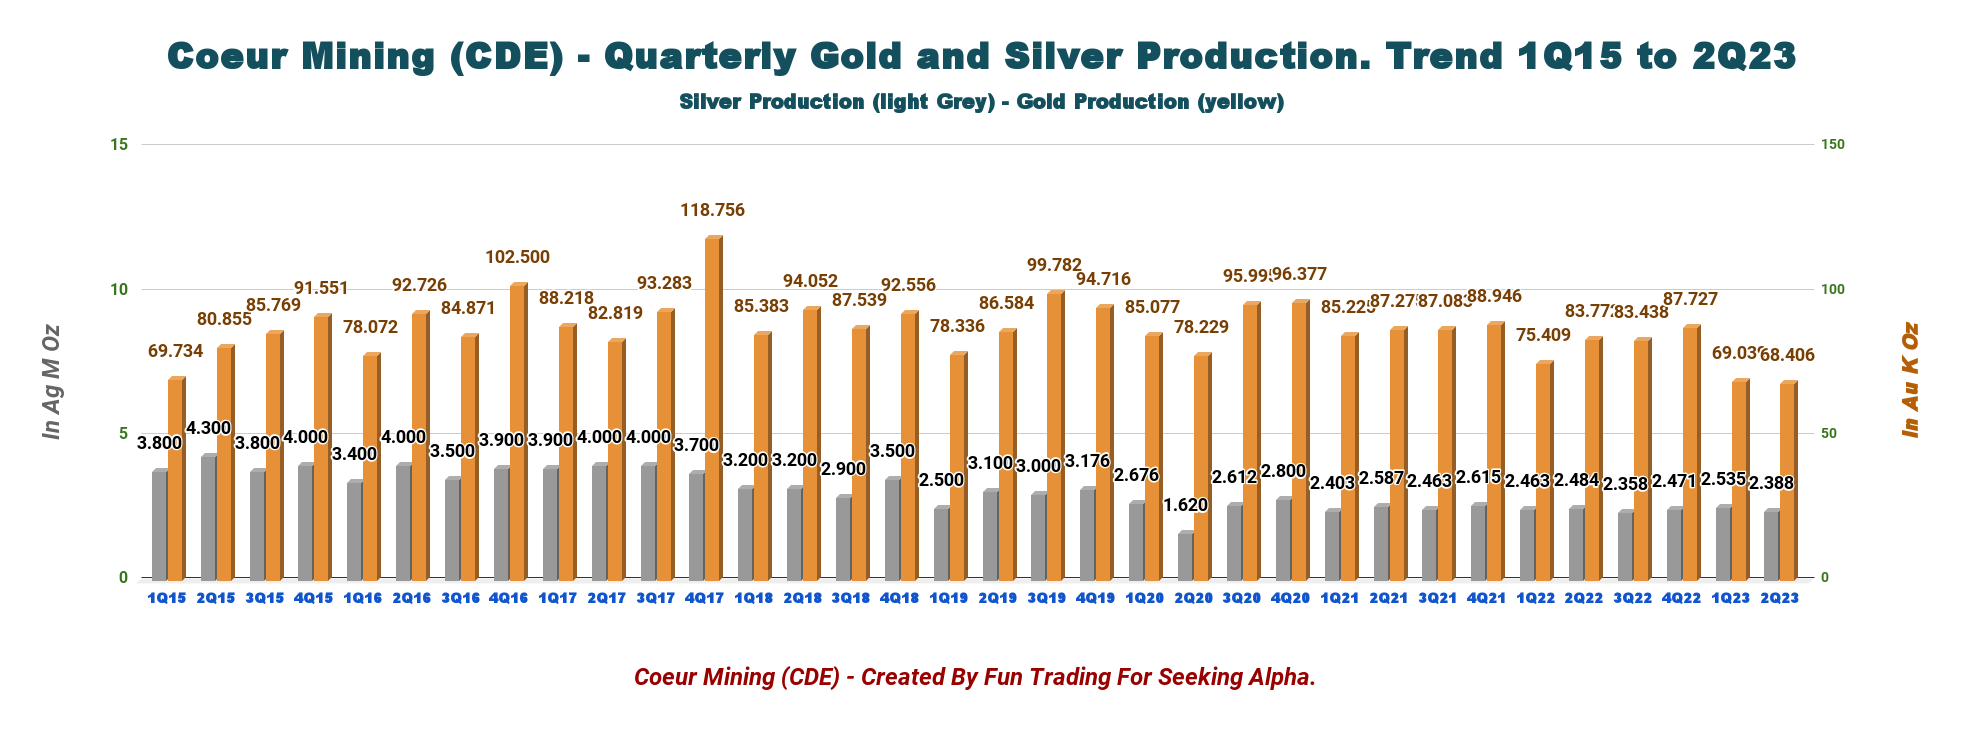
Gold and silver production for the quarter totaled 68,406 Au Oz and 2.388 million Ag Oz . The company sold 67,090 Au Oz and 2.3 Ag Moz in Q2'23.
Stronger production at Rochester and Wharf compensated for a weaker quarter at Kensington due to excessive water flows and paste backfill issues, which delayed production timing from certain stopes.
However, as we can see below, production in gold and silver has been significantly down in the past two quarters.
CDE Quarterly Gold and Silver Production History (Fun Trading)
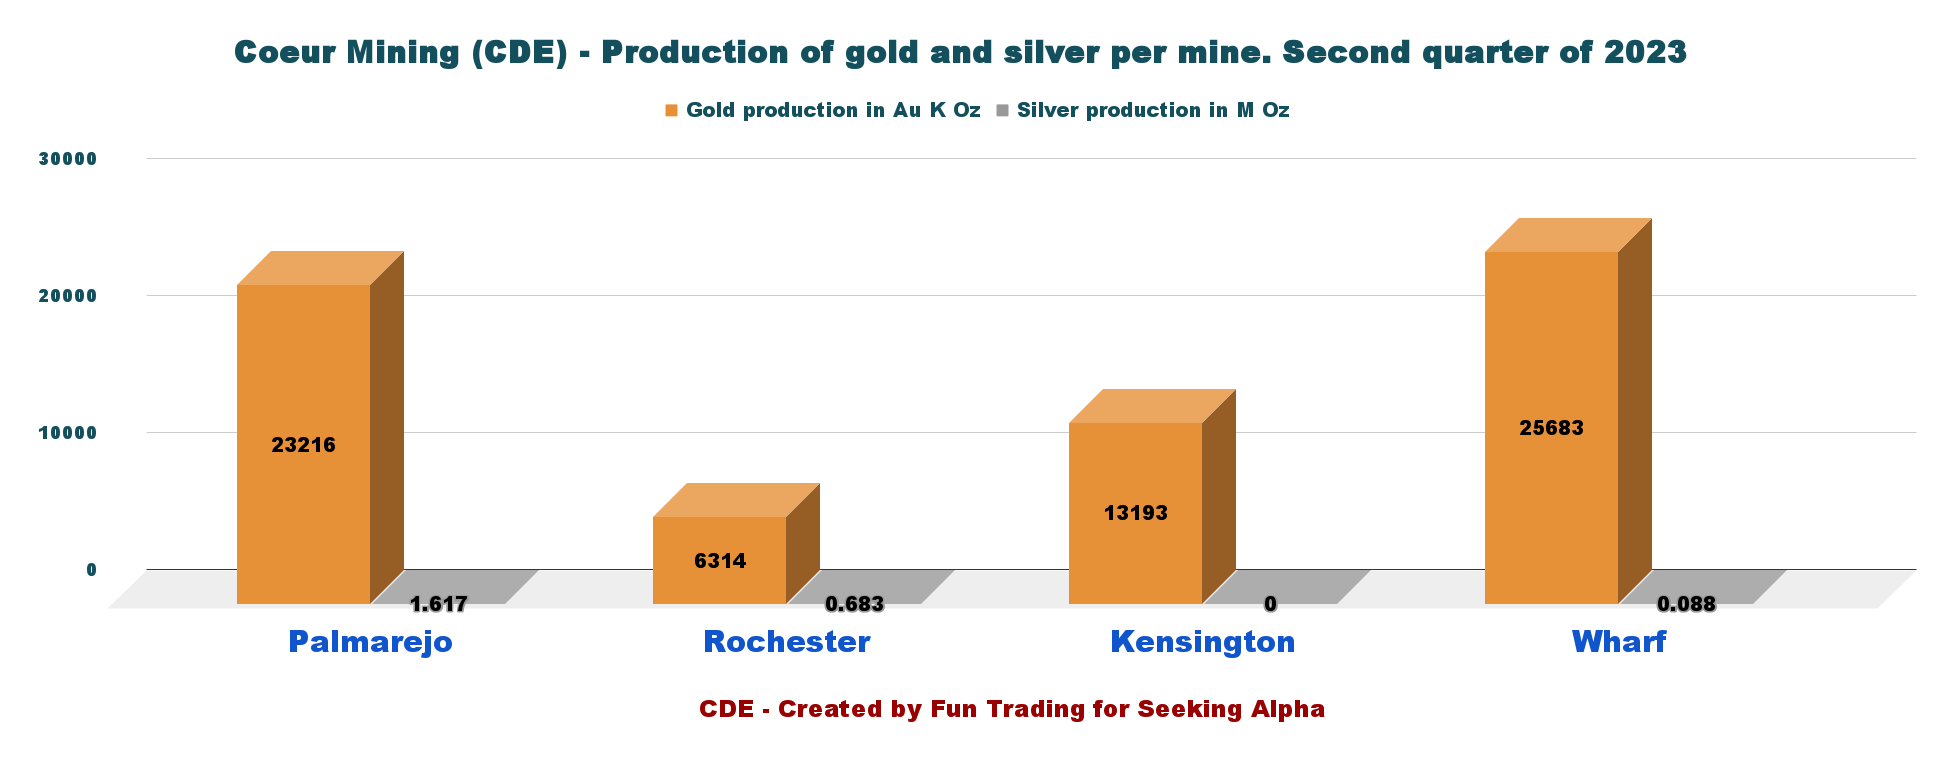
Q2'23 Production per Mine.
CDE Q2'23 Gold and Silver Production per Mine (Fun Trading)
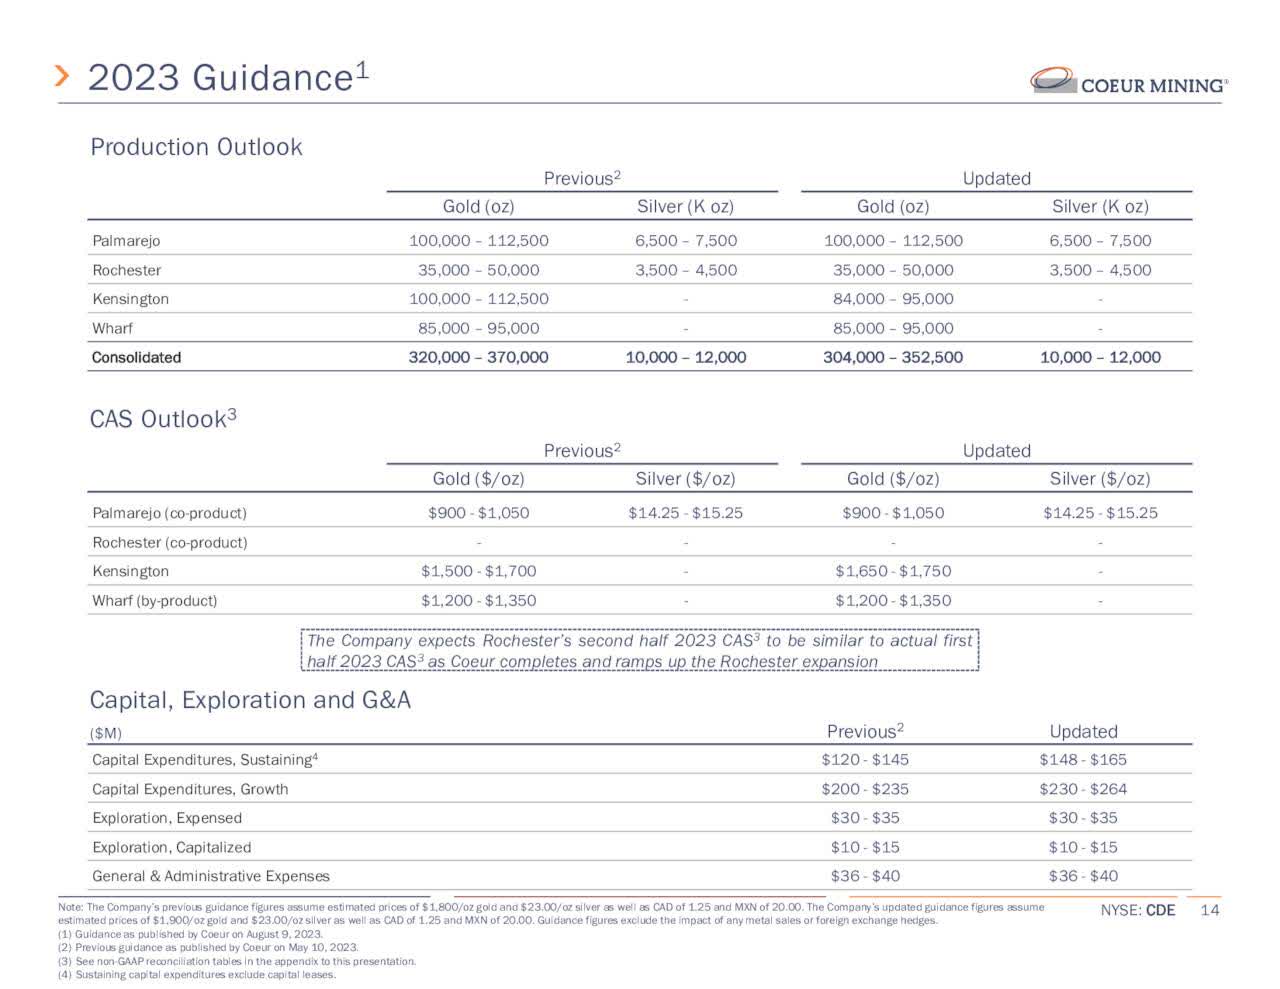
The Full-year Silver production guidance is maintained. However, the Gold production guidance was revised to reflect a lower outlook at Kensington.
2023 silver production is expected to be 10 - 12 million ounces , and 2023 gold production is expected to be 304K - 352.5K ounces , approximately 5% lower than prior full-year gold production guidance, after taking Kensington's lower-than-anticipated second quarter production into account.
CDE Guidance 2023 (CDE Presentation)
Detailed Presentation per mine:
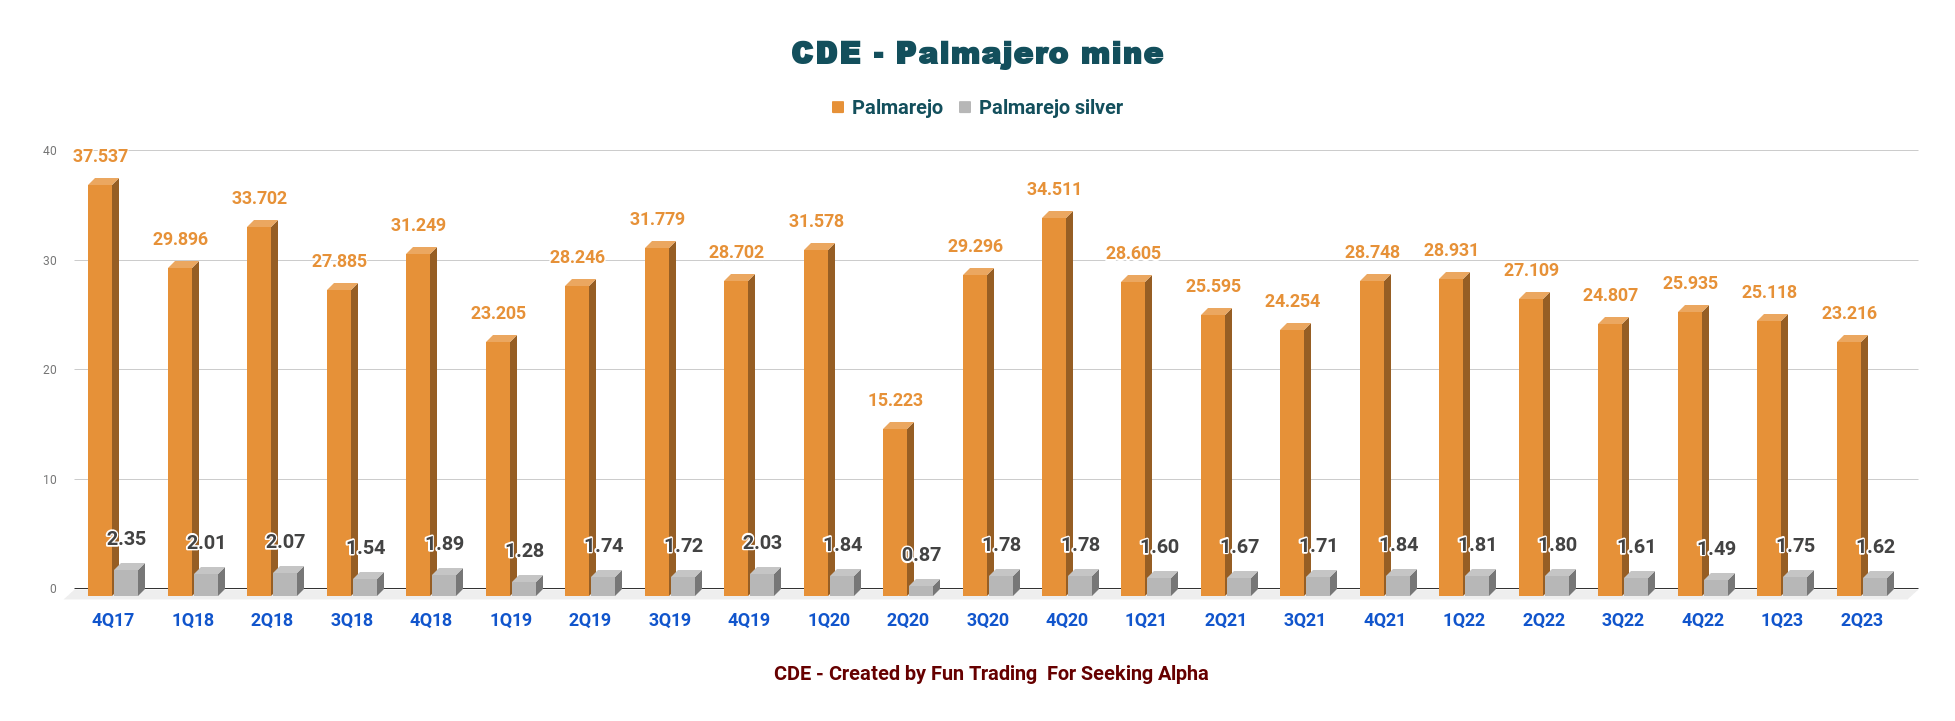
3.1 - Palmarejo mine has slightly lower production QoQ.
CDE Palmarejo Production History (Fun Trading)
During Q2'23, gold and silver production totaled 23,216 Au oz and 1.617 Moz , compared to 25,118 Au oz and 1.752 Moz in the prior period.
3.2 - Kensington Mine. Sharp decline due to water flow problems.
CDE Q2'23 Kensington Production History (Fun Trading)
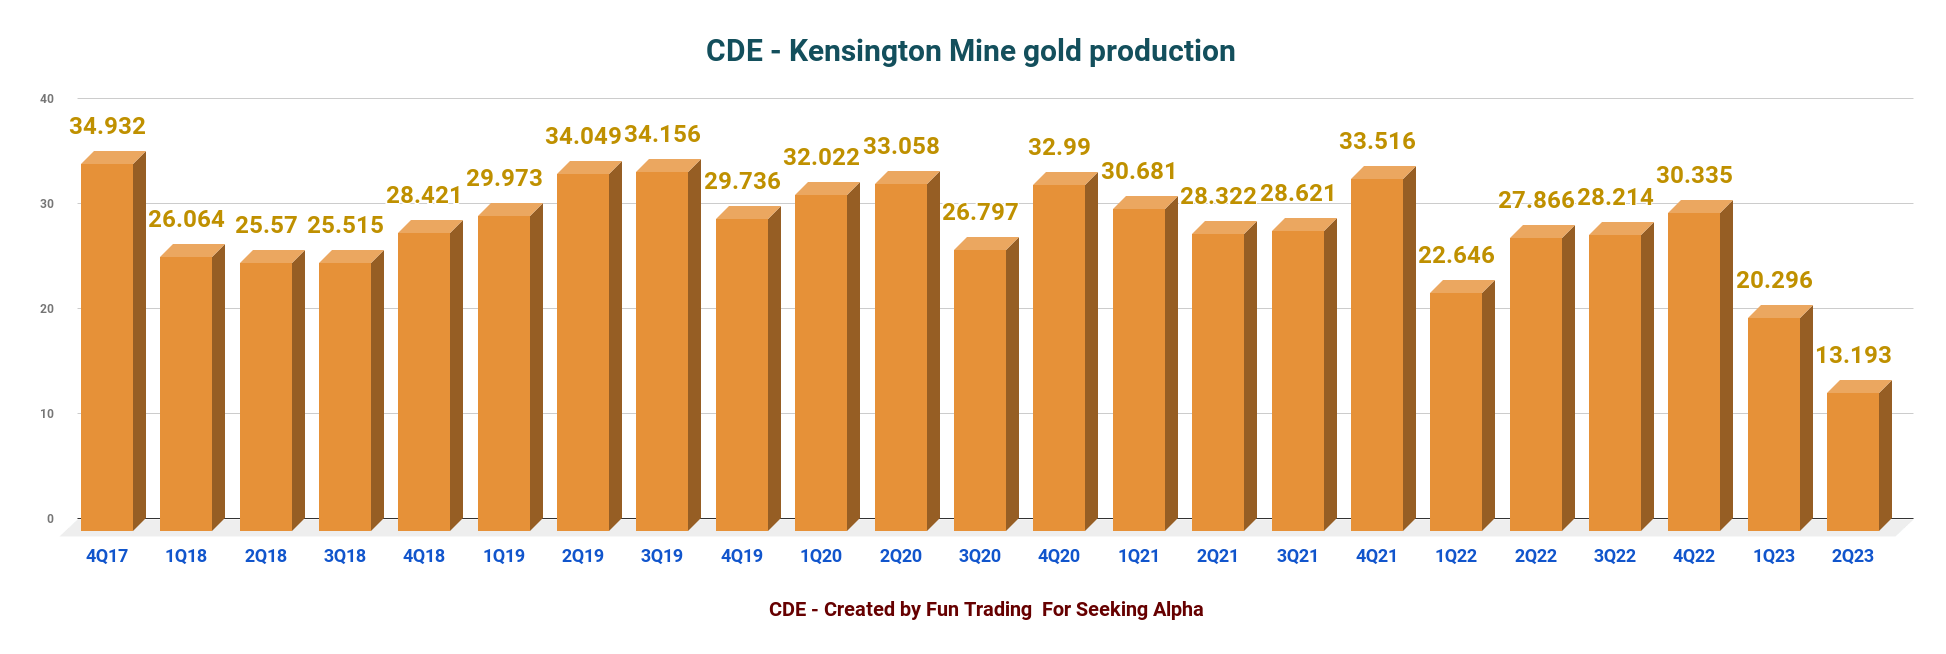
Gold production decreased in the second quarter to 13,193 Au ounces compared to 27,866 ounces in the prior year period.
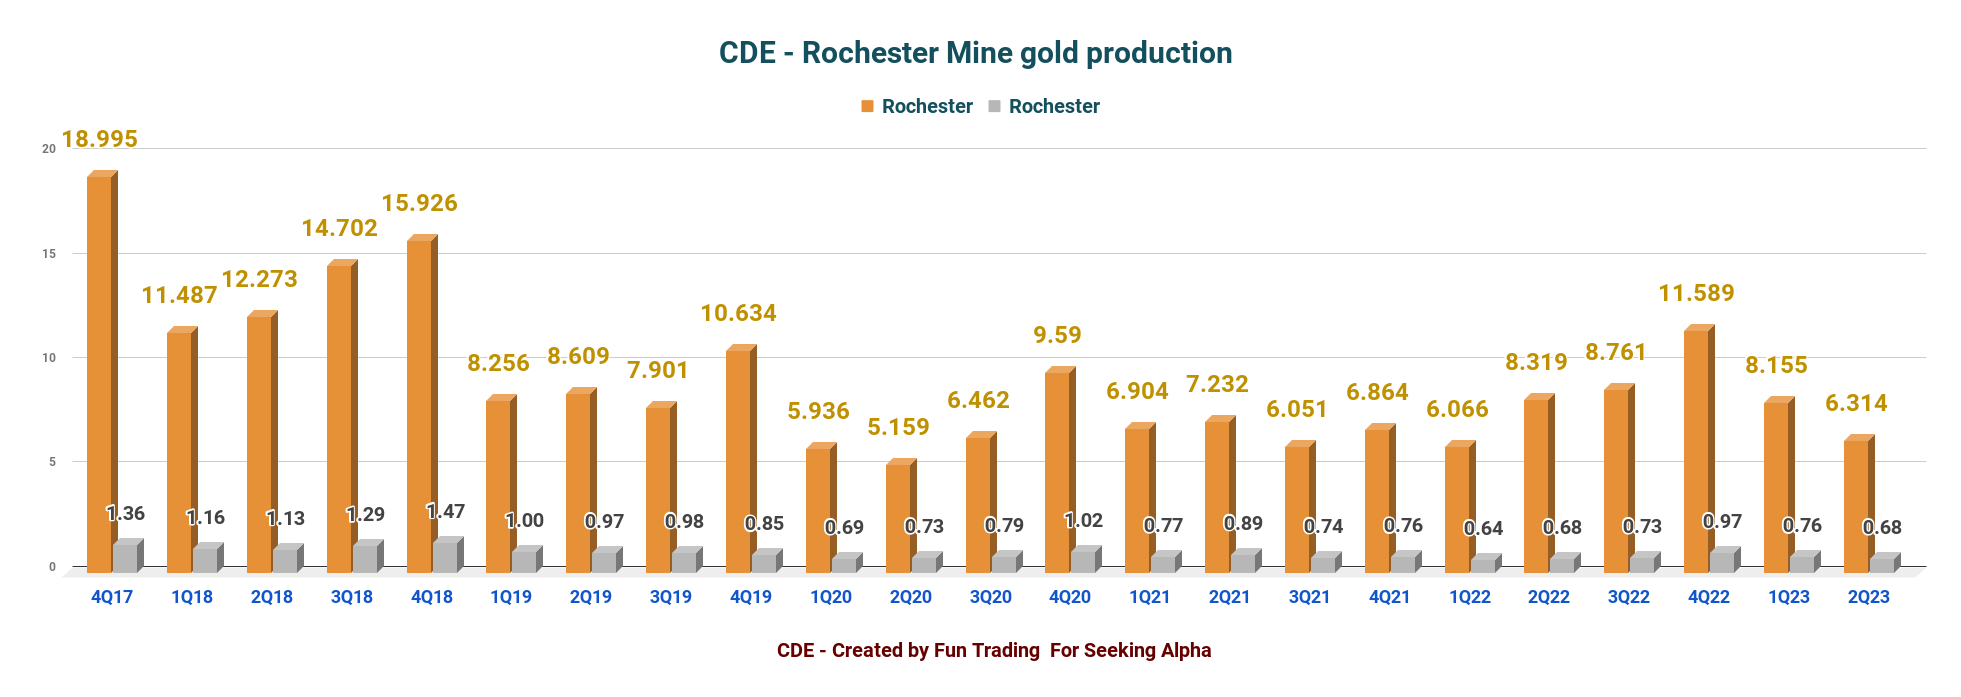
3.3 Rochester mine - A decent Production
CDE Quarterly Production at Rochester (Fun Trading)
COO Michael Routledge said in the conference call:
[M]ining rates are scheduled to increase from 65,000 tonnes per day to 155,000 tonnes per day . Capacity for drilling and loading is already in place and no additional equipment is needed. The whole truck fleet will go from 14 trucks to 29 trucks. And we are currently right on plan to be 22 trucks by the end of 2023 and the full complement by the end of 2024.
Headcount for the expansion is less than a 20% increase, and all additional people for the processing plant are already on board.
Rochester Expansion. Schedule (CDE Presentation)
The first production should have started now.
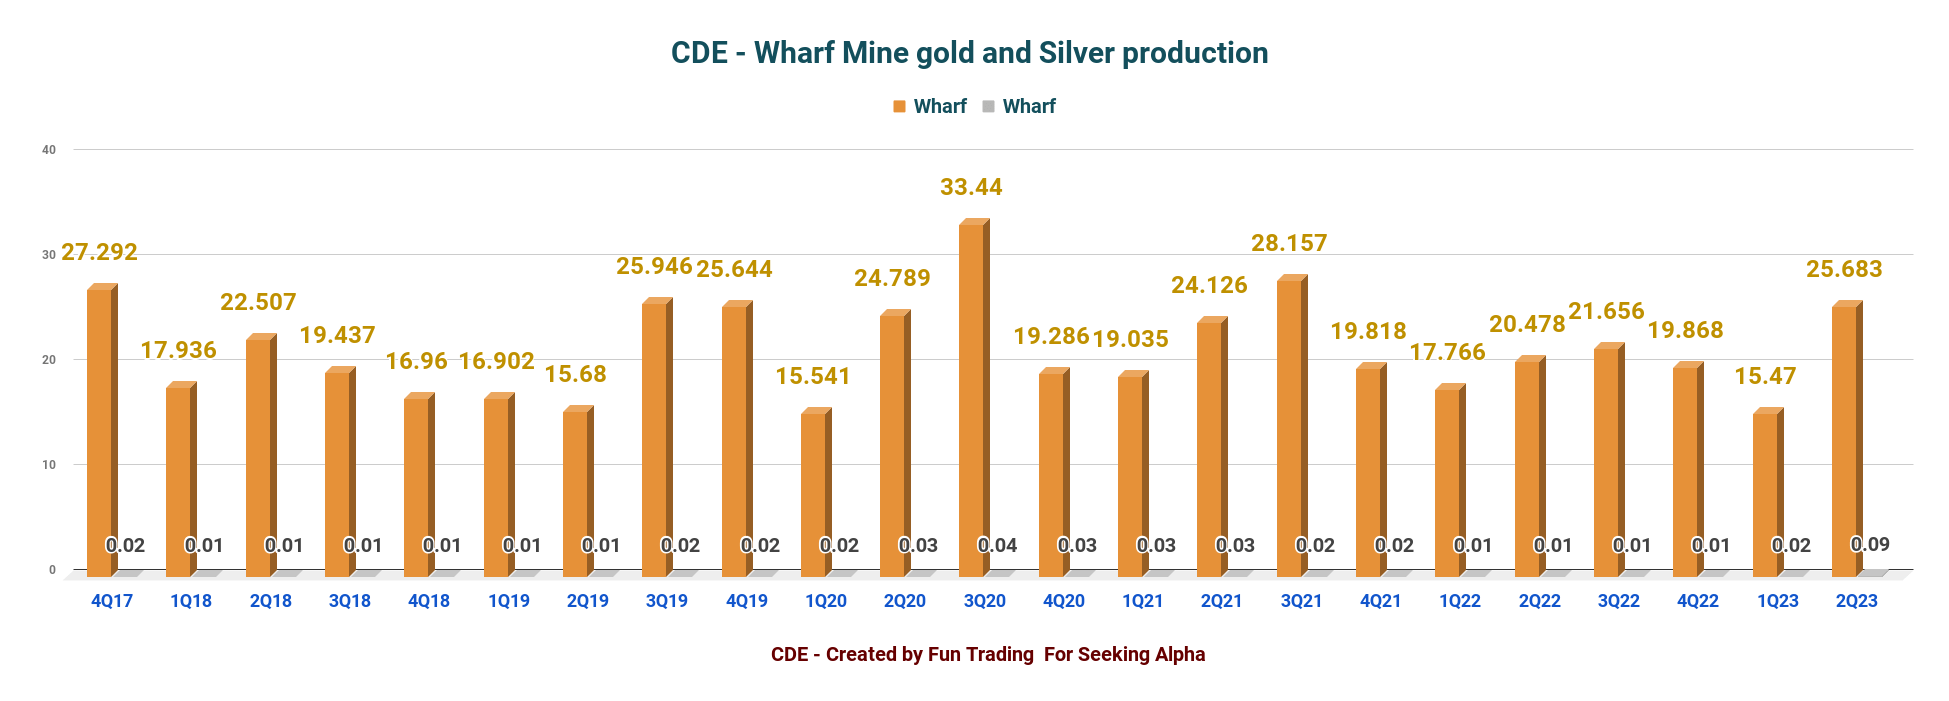
3.4 - Wharf Mine had a good production
CDE Wharf Mine Quarterly Production (Fun Trading)
This quarter delivered a solid production with 25,683 Au Oz and 0.088 Ag Moz .
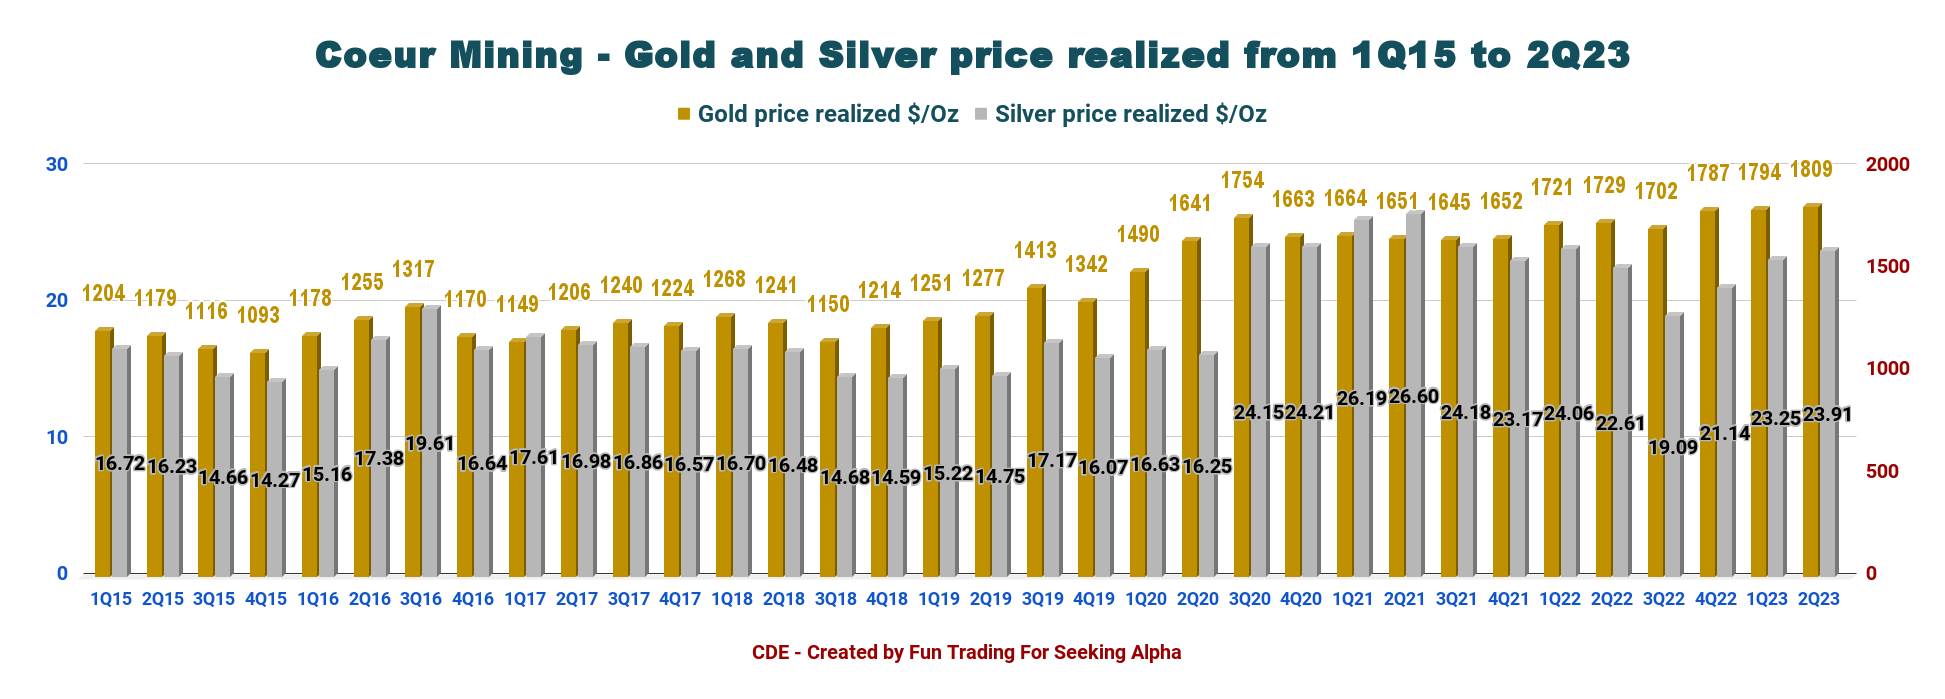
3.5 - Gold and Silver Prices History
Average realized gold and silver prices for the quarter were $1,809 and $23.91 per ounce compared to $1,729 and $22.61 per ounce in the prior year period.
CDE Quarterly Gold and Silver Prices History (Fun Trading)
Part II - Coeur Mining: Financials in Q2'23 - The Raw Numbers
| Coeur Mining |
| Q2' 22 |
| Q3'22 |
| Q4' 22 |
| Q1'23 |
| Q2'23 |
| Total Revenues in $ Million |
| 204.12 |
| 182.99 |
| 210.12 |
| 187.30 |
| 177.24 |
| Net income in $ Million |
| -77.43 |
| -57.44 |
| 49.09 |
| -24.59 |
| -32.41 |
| EBITDA $ Million |
| -33.29 |
| -21.01 |
| 84.33 |
| 15.58 |
| 3.34 |
| EPS diluted in $/share |
| -0.28 |
| -0.21 |
| 0.19 |
| -0.08 |
| -0.10 |
| Cash from operating activities in $ Million |
| 22.64 |
| -19.12 |
| 28.52 |
| -35.00 |
| 39.40 |
| Capital Expenditure in $ Million |
| 73.16 |
| 96.60 |
| 113.09 |
| 74.05 |
| 85.58 |
| Free Cash Flow in $ Million |
| -50.51 |
| -115.72 |
| -84.58 |
| -109.05 |
| -46.18 |
| Total cash $ Million |
| 161.70 |
| 111.64 |
| 93.50 |
| 81.92 |
| 66.09 |
| Total Debt (including lease obligation) In $ Million |
| 547.5 |
| 635.7 |
| 515.9 |
| 485.5 |
| 469.4 |
| Shares outstanding in Million |
| 278.04 |
| 278.11 |
| 282.92 |
| 300.95 |
| 333.08 |
Data Source: Company press release.
Analysis: Revenues, Free Cash Flow, Debt, And Production Details
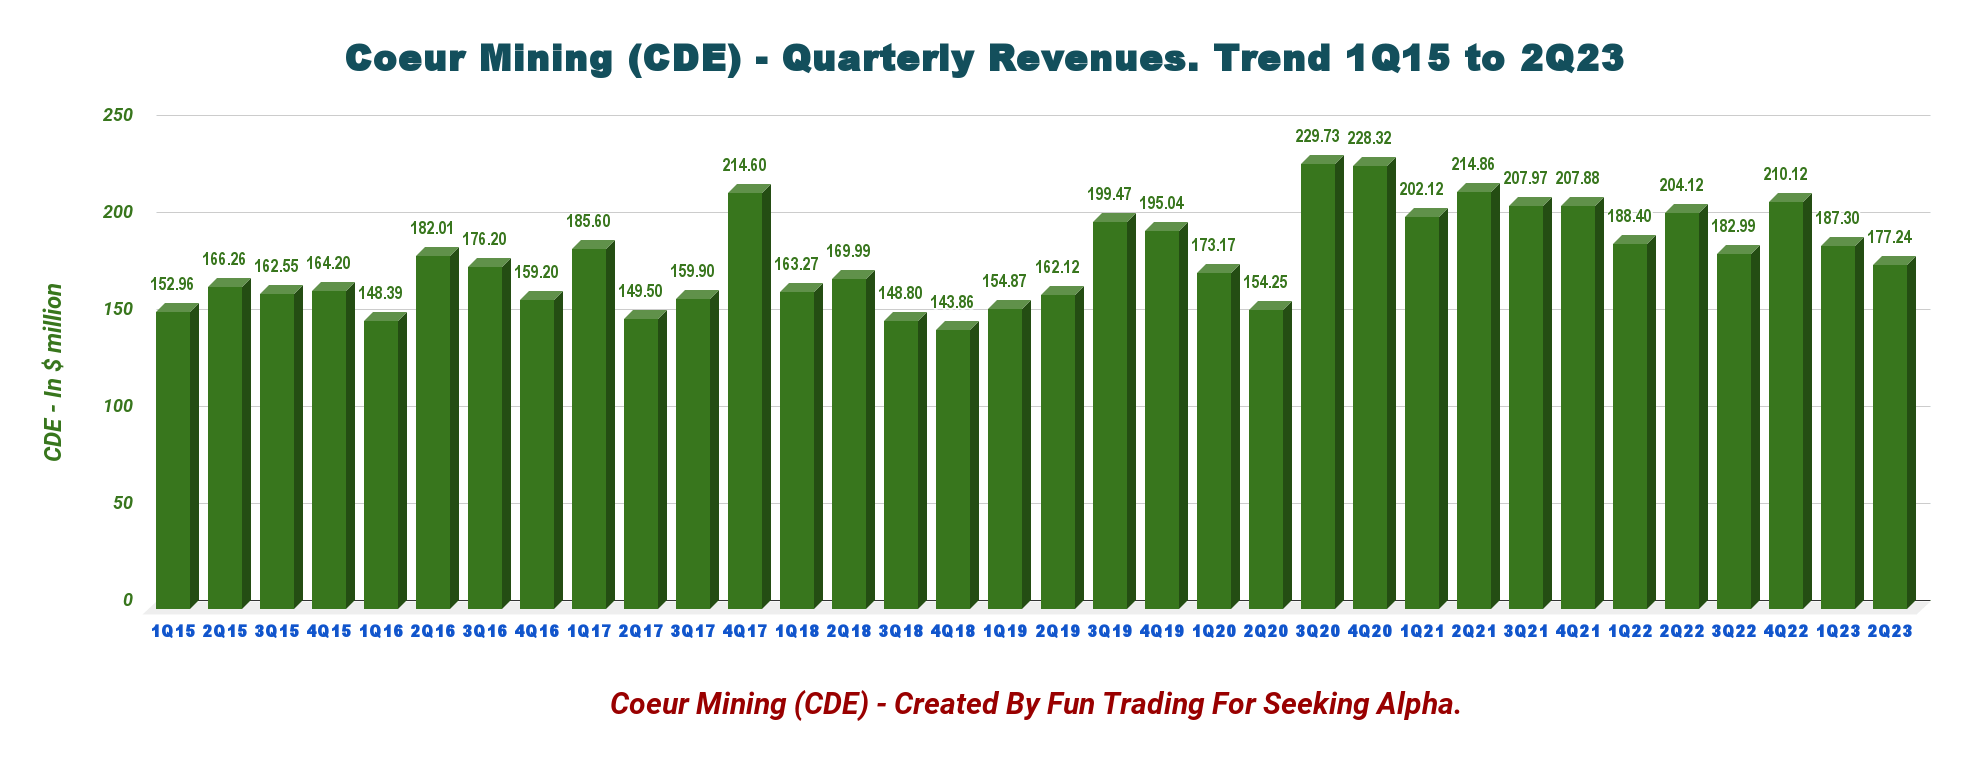
1 - Revenues and trends - Revenues were $177.24 million in Q2'23
CDE Quarterly Revenue History (Fun Trading) Coeur Mining posted $177.24 million in revenues, with an EBITDA of $3.34 million and a cash flow loss from operating activities of $39.40 million . The adjusted net income was a loss of $33.1 million, or $0.11 per share. The company reported a net loss of $32.41 million, or $0.10 per diluted share, compared with a loss of $0.28 a year ago.
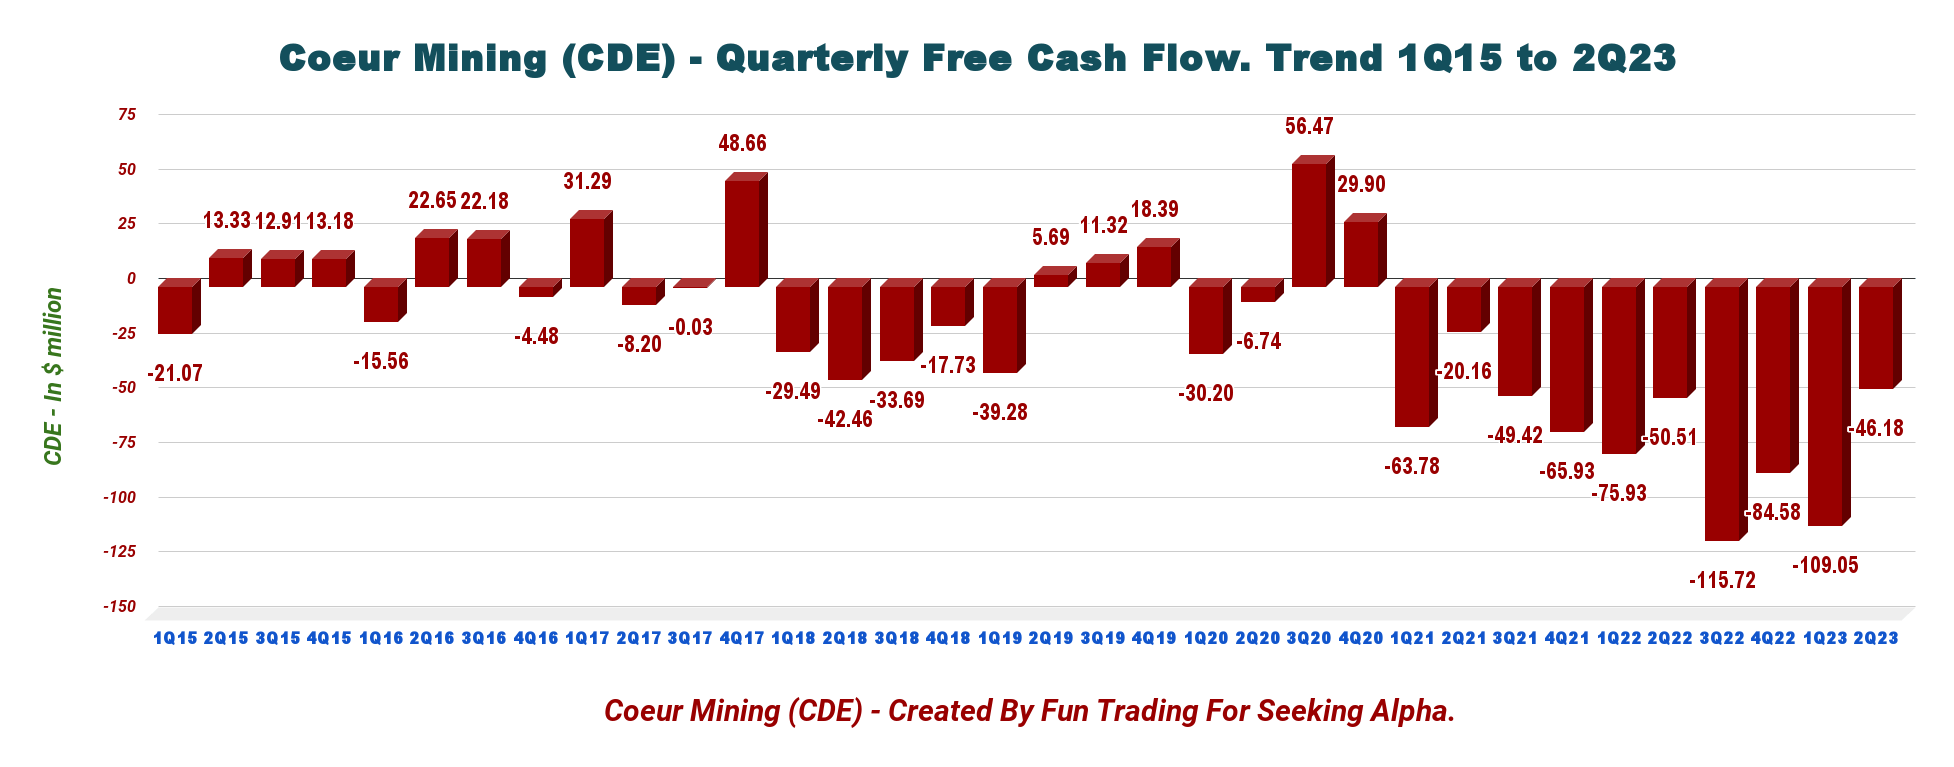
2 - Free cash flow was negative $46.18 million in Q2'23
CDE Quarterly Free Cash Flow History (Fun Trading)
Note: Generic free cash flow is cash from operations minus CapEx.
Coeur Mining's free cash flow for the second quarter of 2023 was negative $46.18 million , and the trailing 12-month free cash flow was a loss of $355.53 million .
The company's CapEx in Q2'23 was $85.58 million , and cash flow from operations was $39.40 million .
The Rochester Expansion explains why CDE is deeply FCF negative. Total CapEX is expected to be between $710 million and $730 million , about 6% to 9% above the previously estimated $607 million discussed in last quarter's call. The CapEx incurred is estimated at $660 million.
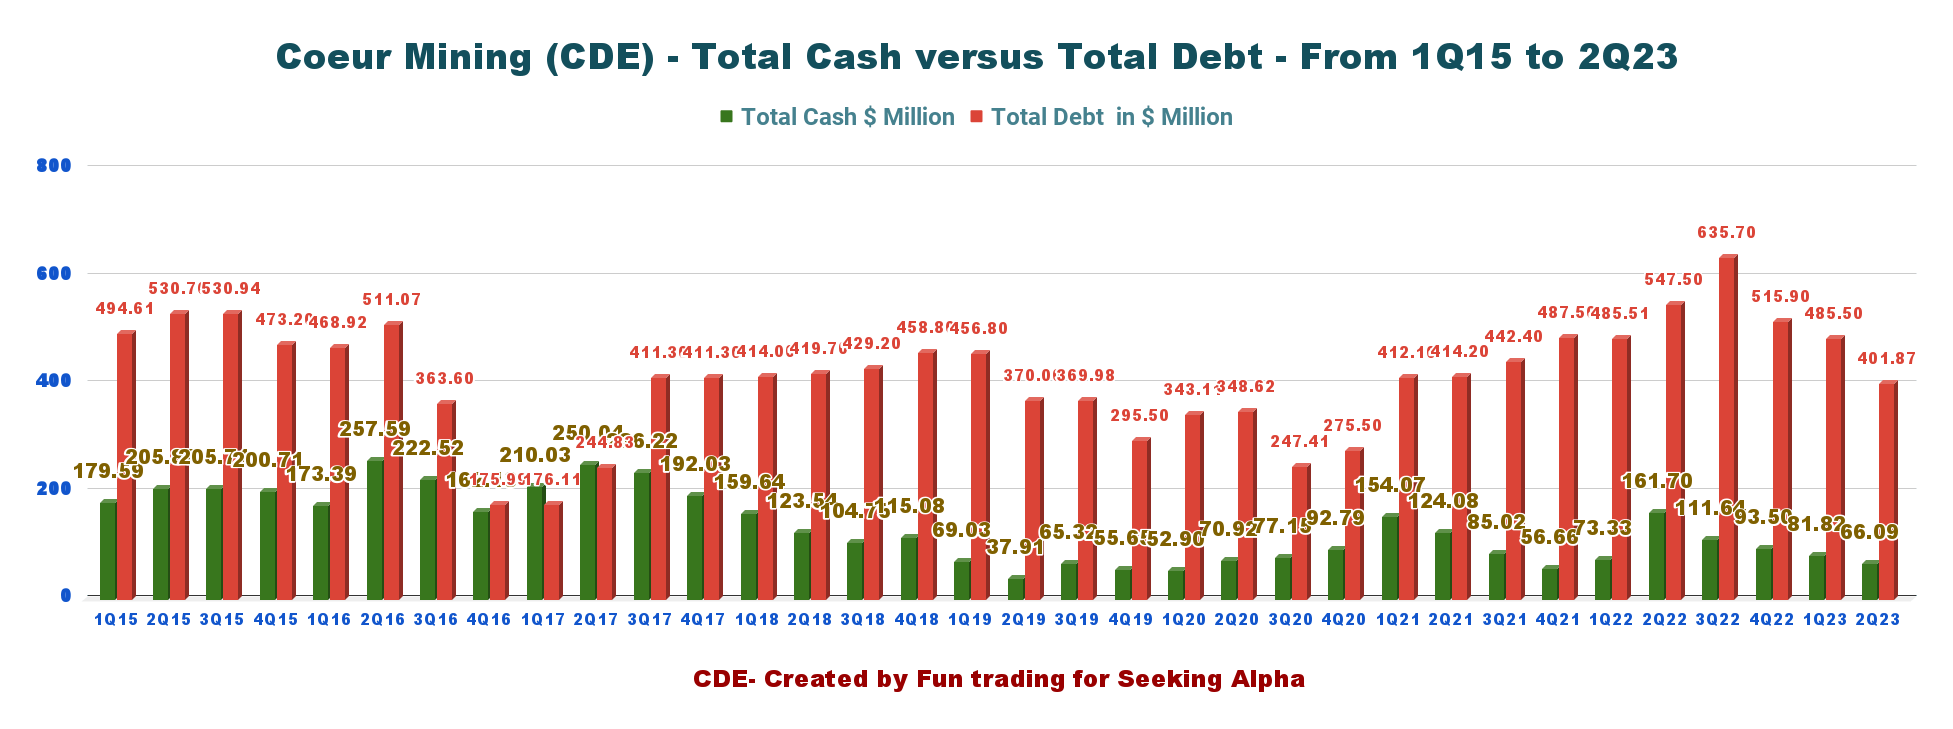
3 - Available capital, net debt, liquidity, and hedges
CDE Quarterly Cash versus Debt History (Fun Trading)
The Total debt was $469.4 million in Q2'23, and net debt was $403.31 million . Cash, cash on hand, and marketable securities were down to $66.09 million .
Total potential liquidity is now $415 million (including $100 million ATM).
For financial ratios and Metal sales hedges, please see below:
Technical Analysis And Commentary
CDE TA Chart (Fun Trading StockCharts)
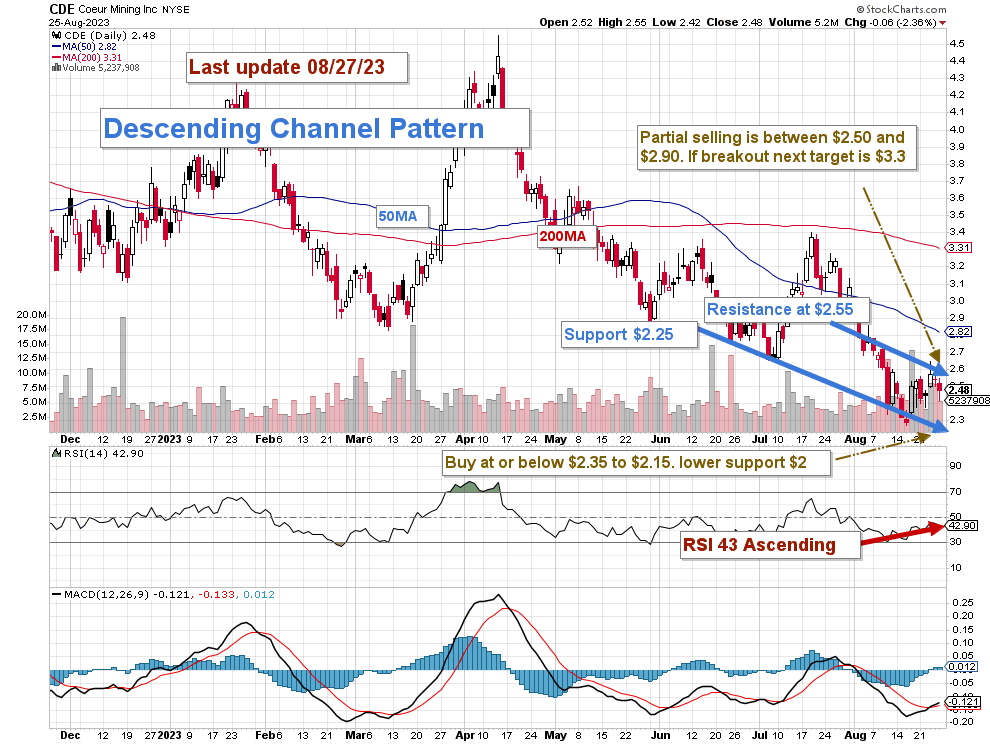
CDE forms a descending channel pattern, with resistance at $2.55 and support at $2.25 .
Descending channel patterns are short-term bearish in that a stock moves lower within a descending channel, but they often form within longer-term uptrends as continuation patterns. The descending channel pattern is often followed by higher prices, but only after an upside penetration of the upper trend line.
The trading strategy is to sell about 40%-50% of your position LIFO and keep a core long-term position for a higher target of around $4 to $5 .
Coeur Mining has been struggling with technical and financial issues for a long time, and I believe the stock has reached rock bottom recently.
I suggest taking profits LIFO between $2.50 and $2.90 with possible higher resistance at $3.30 and waiting patiently for a retracement between $2.35 and $2.15 with lower support at $2 .
However, for those who are patient, the best strategy here is to accumulate below $2.30 and wait patiently for a retest of $3.50 to start taking profit off.
Warning: The TA chart must be updated frequently to be relevant. It is what I am doing in my stock tracker. The chart above has a possible validity of about a week. Remember, the TA chart is a tool only to help you adopt the right strategy. It is not a way to foresee the future. No one and nothing can.
For further details see:
Coeur Mining: Rochester Expansion Near Completion But Costs On The Rise