SLV - Coeur Mining: Rochester Expansion Nearing Completion
2023-03-28 05:06:53 ET
Summary
- Coeur Mining's quarterly revenue was $210.12 million, representing an increase of 1.1% year-over-year. Gold and silver sales represented 75.0% and 25.0% of quarterly revenue.
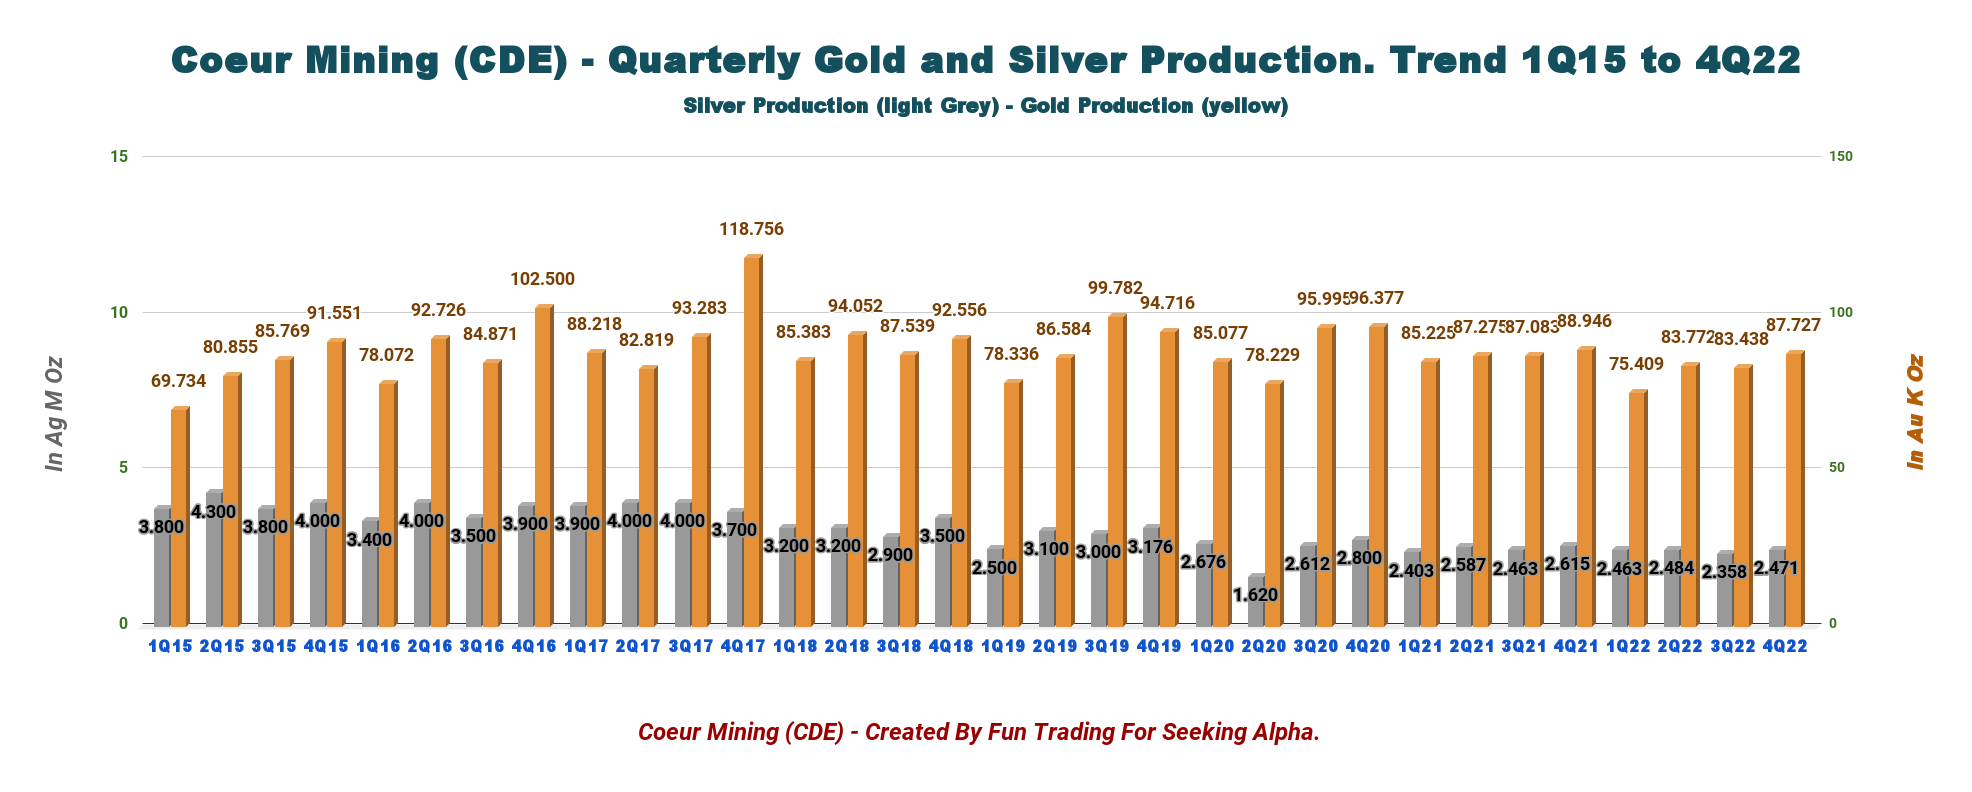
- Total production was 87,727 Au ounces and 2,471K Ag ounces. Metal sales for the quarter totaled 88,189 Au ounces and 2.5 million ounces of silver.
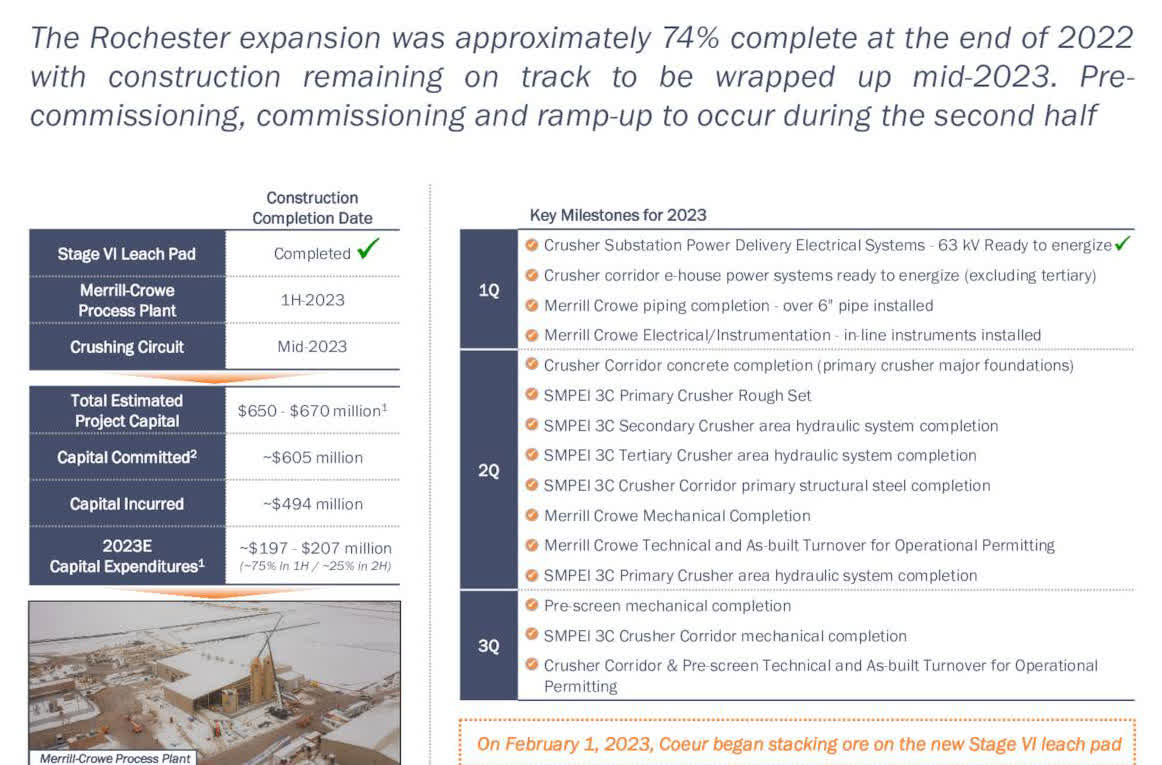
- Rochester expansion was 73% completed at the end of 2022.
- I recommend buying CDE between $3.10 and $2.90 with lower support at $2.75 to accumulate again.
Part I - Introduction
Chicago-based Coeur Mining ( CDE ) released its fourth-quarter and full-year 2022 results on February 22, 2023.
Note: I have followed CDE quarterly since April 2019. This new article is a quarterly update of my article published on December 13, 2022.
1 - 4Q22 and Full-year results snapshot
Coeur Mining's quarterly revenue was $210.12 million, representing an increase of 1.1% year-over-year. Gold and silver sales represented 75.0% and 25.0% of quarterly revenue. Net income was $49.09 million, or $0.19 per diluted share, compared to a loss of $10.76 million, or $0.05 per share, last year.
Gold production increased at Palmarejo, Kensington, and Rochester this quarter. Total production was 87,727 Au ounces and 2,471K Ag ounces. Metal sales for the quarter totaled 88,189 Au ounces and 2.5 million ounces of silver.
For the full-year 2022, the company said in the press release :
Coeur generated $786 million in revenue during 2022, compared to $833 million in 2021. Full-year gold and silver production totaled 330,346 and 9.8 million ounces, respectively, compared to 348,529 ounces of gold and 10.1 million ounces of silver in 2021. Metal sales in 2022 included 329,968 and 9.8 million ounces of gold and silver, respectively. Average realized gold and silver prices for the year were $1,736 and $21.77 per ounce, respectively, compared to $1,652 and $25.06 per ounce in 2021.
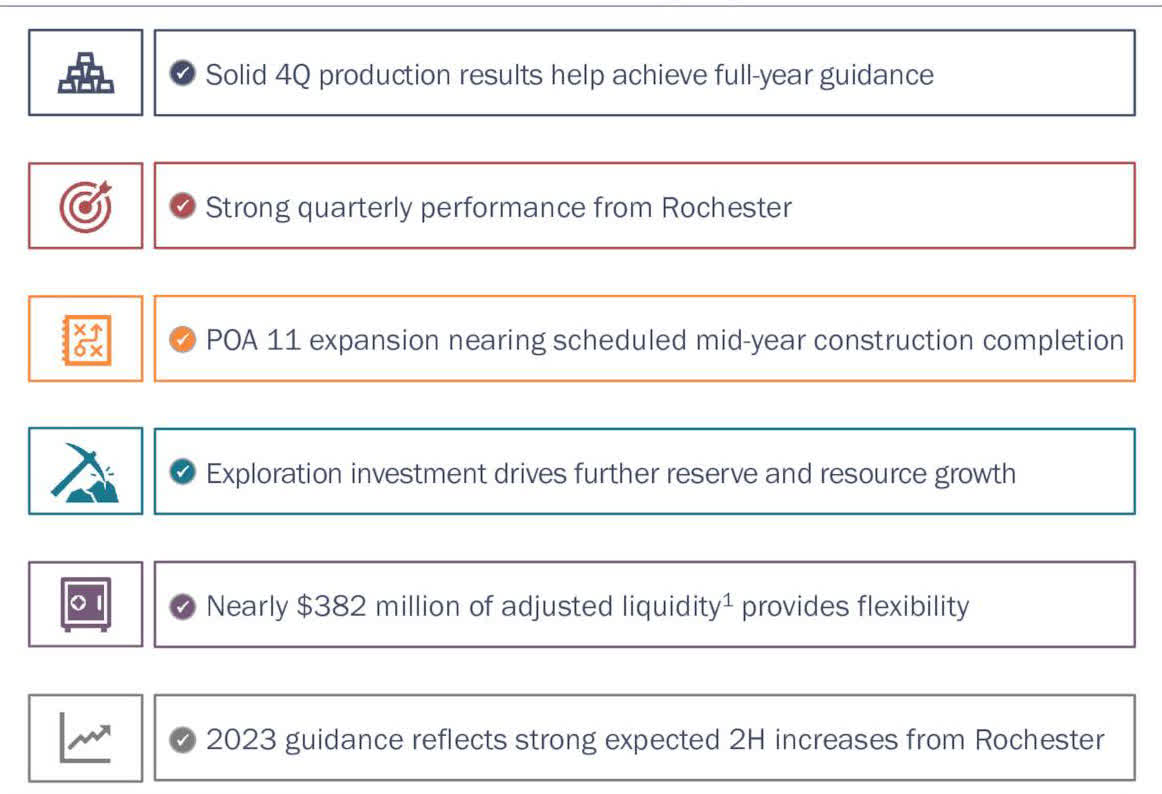
Below indicated are the 4Q22 and FY22 highlights from the company's presentation:
CDE 4Q22 and FY22 Highlights (CDE Presentation)
CEO Mitch Krebs said in the conference call:
The fourth quarter was Coeur's strongest quarter of the year, which helped to achieve our overall full year production guidance for the third consecutive year, definitely not an easy task last year with such unprecedented volatility. Rochester was the main driver to our solid finish last year.
2 - Stock Performance
CDE sank significantly on a one-year basis and has underperformed the iShares Silver Trust ETF ( SLV ), the VanEck Vectors Gold Miners ETF ( GDX ), and Fortuna Silver Mines ( FSM ) while doing better than Pan American Silver ( PAAS ). It has been a poor performer in my portfolio's gold and silver miners. The stock is down 28%.
3 - Gold And Silver Production In 4Q22
Strong performances at Rochester, Kensington, and Wharf mines this quarter.
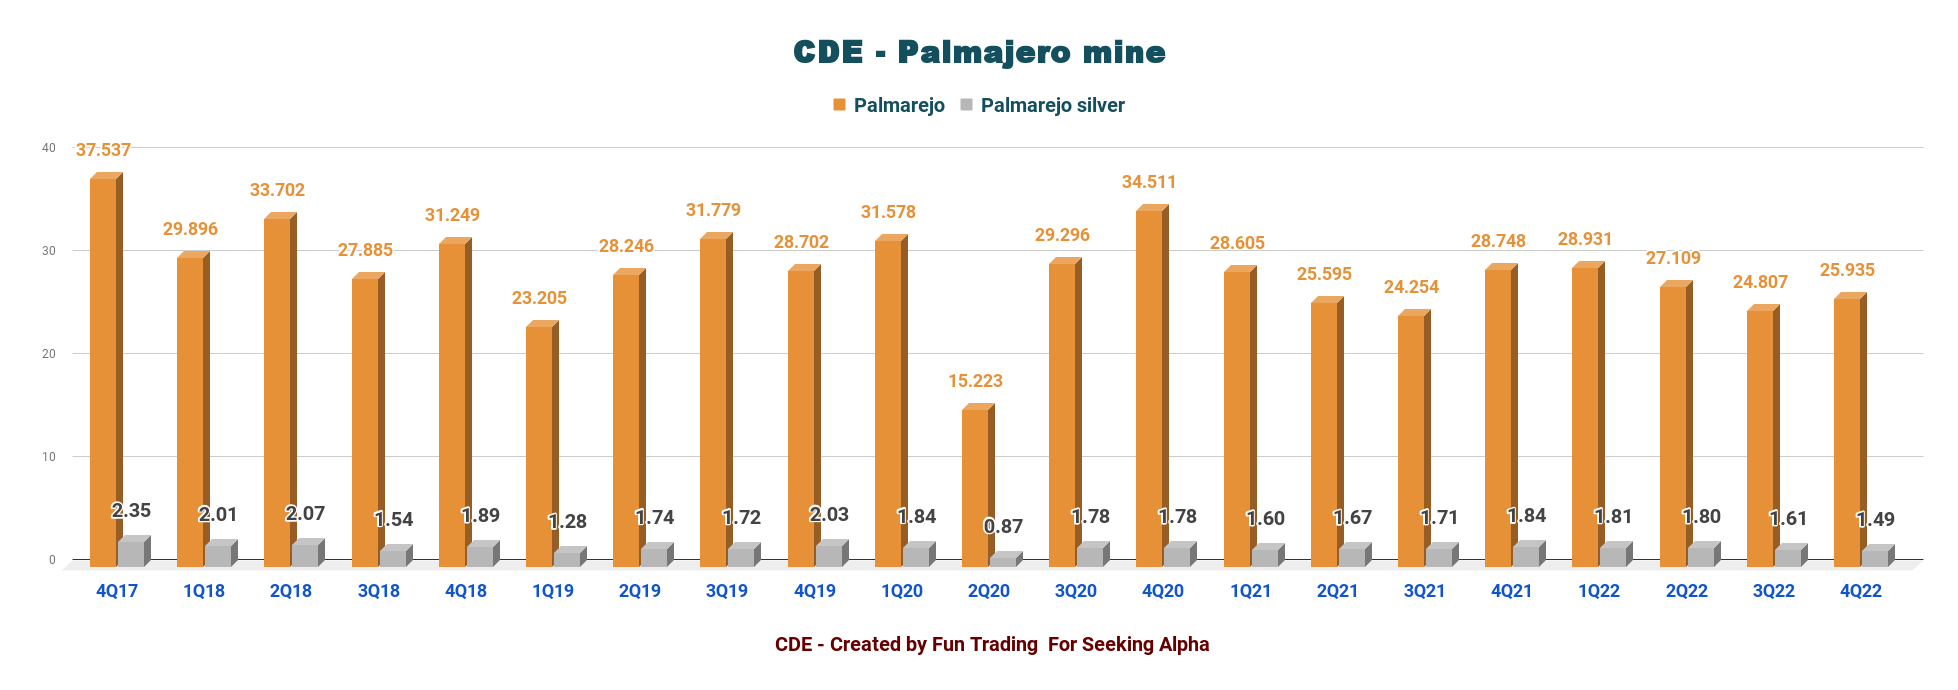
3.1 - Palmarejo mine. Solid quarter
CDE Palmarejo Quarterly production history (Fun Trading)
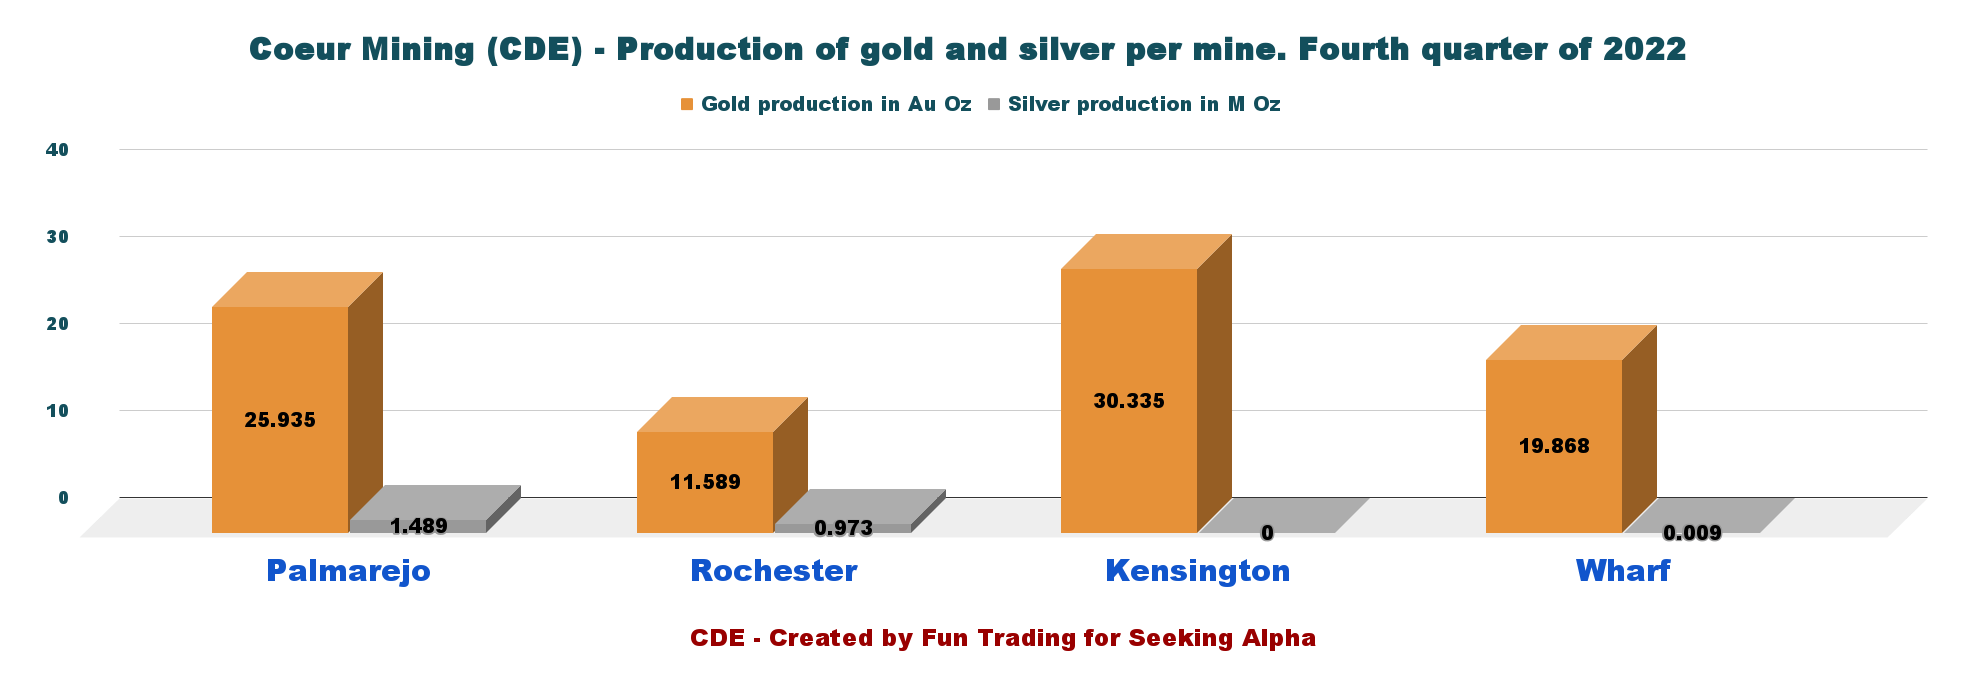
Production during 4Q22 profited from increased mill throughput and a higher average gold grade, offset partially by a lower average silver grade. The fourth quarter's gold and silver production totaled 25,935 Au oz and 1.489 Moz, respectively, compared to 24,807 Au Oz and 1.612 Ag Moz in the prior period.
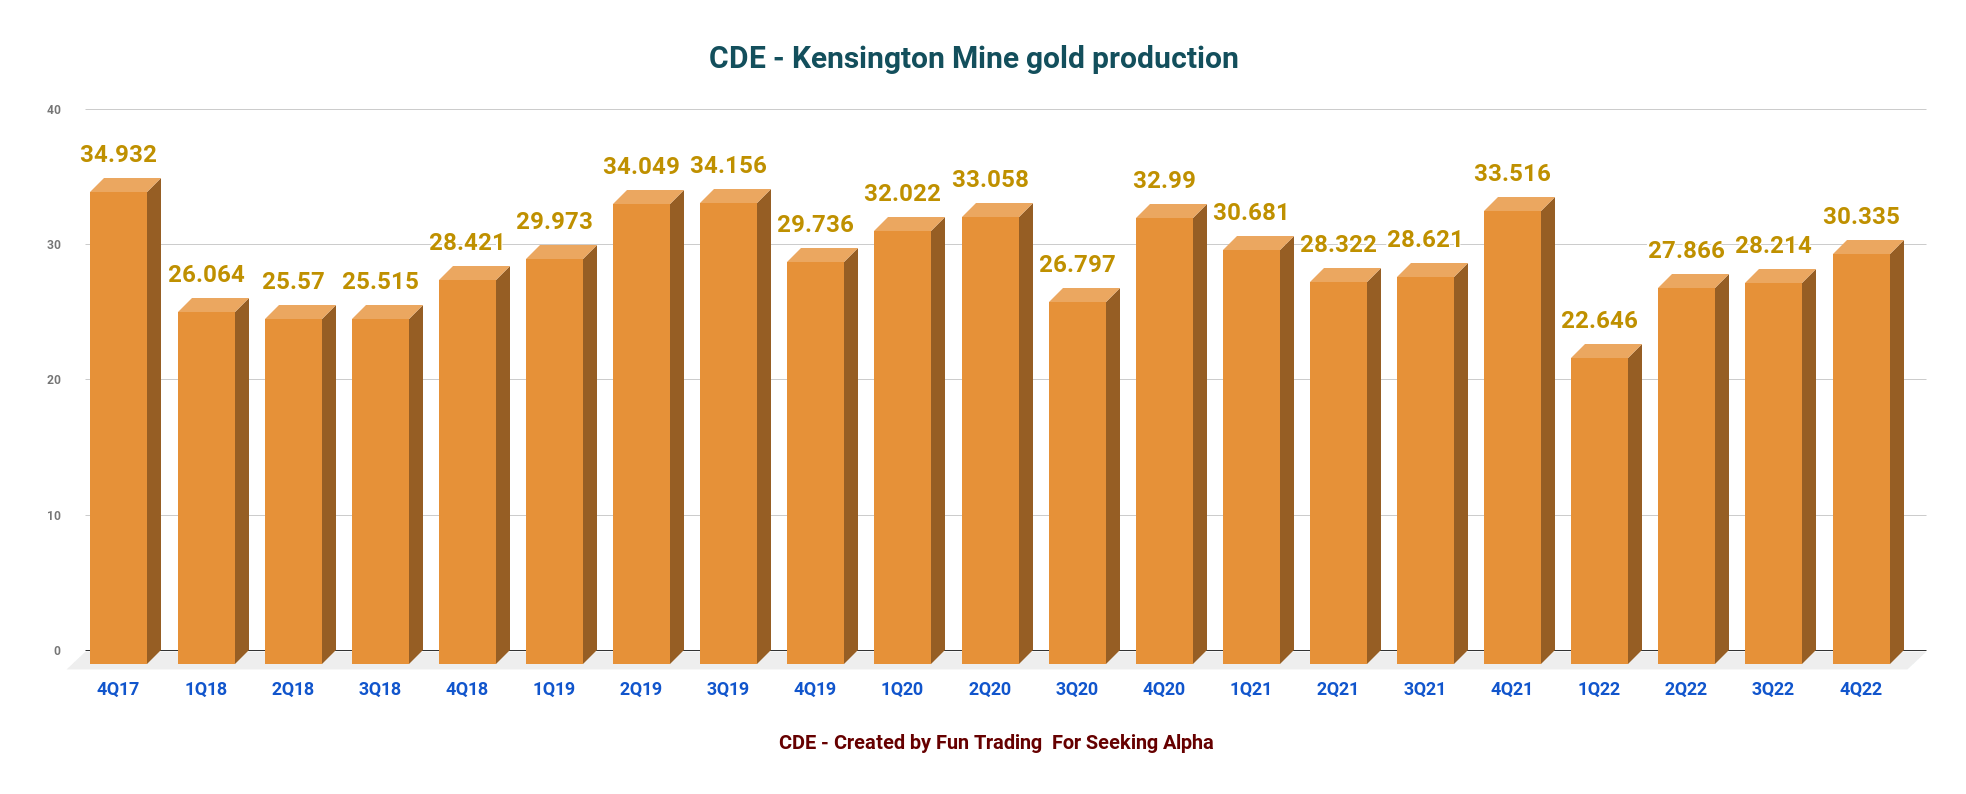
3.2 - Kensington mine. A better production this quarter
CDE Kensington Quarterly Production history (Fun Trading)
Gold production increased in the fourth quarter to 30,335 ounces compared to 28,214 ounces in the prior period and 33,516 ounces in the fourth quarter of 2021. The company said:
Higher production during the fourth quarter was driven by an increase in mill throughput - a record high quarter - due to efficiencies at the mill, as well as improved average gold recoveries compared to the prior period
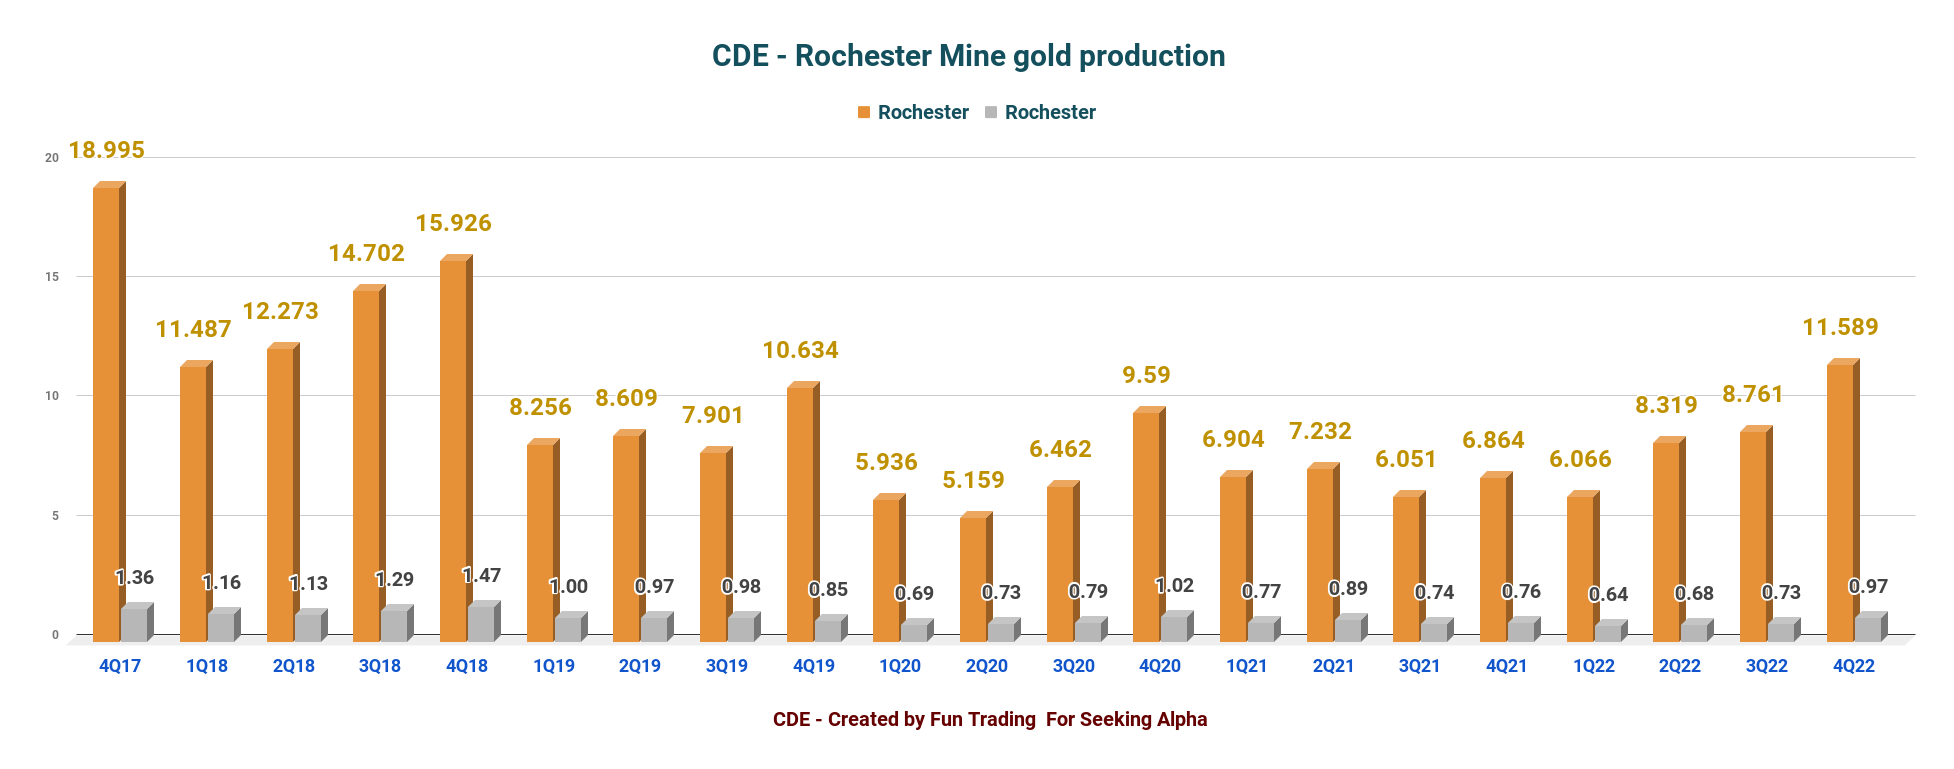
3.3 Rochester mine. Good performance
CDE Rochester Quarterly Production (Fun Trading)
The company said:
Silver and gold production increased 31% and 32% in the fourth quarter, respectively, to 973,000 Ag Oz and 11,589 Au Oz compared to 744,880 and 8,761 ounces in the prior period and 757,000 and 6,864 ounces in the fourth quarter of 2021... Increased production during the quarter was primarily driven by timing of higher-grade material placed on the leach pad during the prior period as a result of planned mine sequencing.
CDE Rochester Expansion Presentation (CDE Presentation)
3.4 - Coeur Mining metal production
Gold and silver sales were 75% and 25% of quarterly revenue. Coeur Mining produced 87,727 Au ounces of gold (but sold 88,189 Au Oz) and 2.471 million Ag ounces (sold 2.5 Ag Moz) during the fourth quarter.
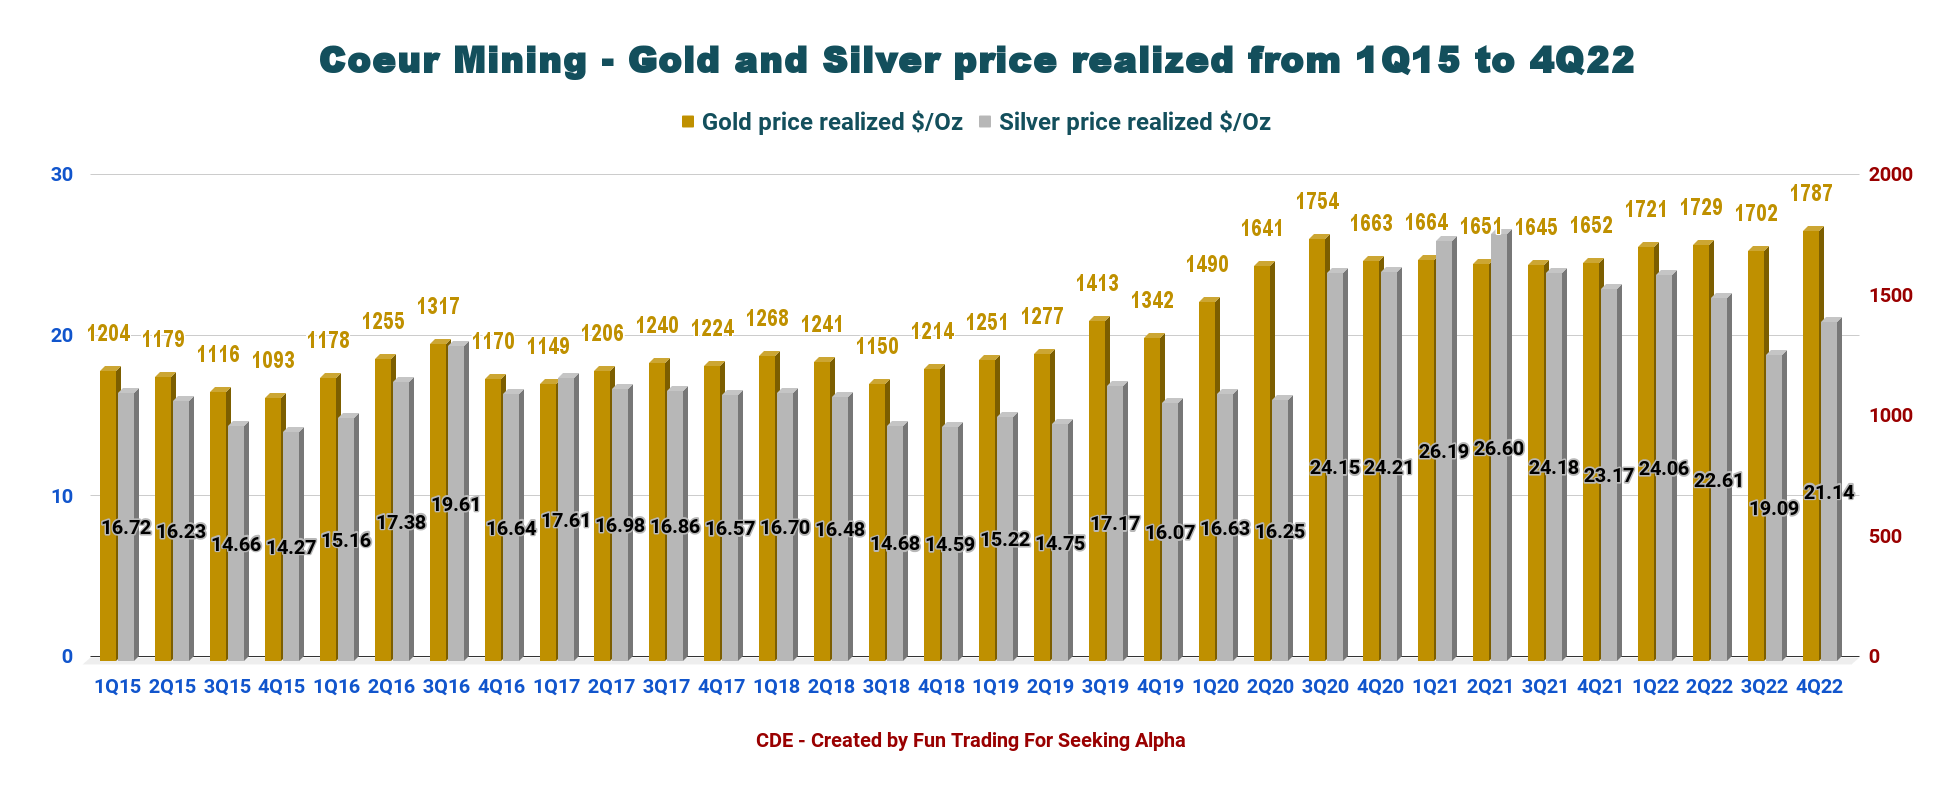
CDE Quarterly gold and silver prices history (Fun Trading)
Average realized gold and silver prices for the quarter were $1,787 and $21.14 per ounce, respectively, compared to $1,652 and $23.17 per ounce in the prior year period.
CDE Quarterly gold and silver price history (Fun Trading)
Below is the production per mine:
CDE 4Q22 Production gold and silver per mine (Fun Trading)
Part II - Coeur Mining: Financials in 4Q22 - The Raw Numbers
| Coeur Mining |
| 4Q21 |
| 1Q22 |
| 2Q22 |
| 3Q22 |
| 4Q22 |
| Total Revenues in $ Million |
| 207.88 |
| 188.40 |
| 204.12 |
| 182.99 |
| 210.12 |
| Net income in $ Million |
| -10.76 |
| 7.68 |
| -77.43 |
| -57.44 |
| 49.09 |
| EBITDA $ Million |
| 27.91 |
| 39.96 |
| -33.29 |
| -21.01 |
| 84.33 |
| EPS diluted in $/share |
| -0.05 |
| 0.03 |
| -0.28 |
| -0.21 |
| 0.19 |
| Cash from operating activities in $ Million |
| 34.94 |
| -6.43 |
| 22.64 |
| -19.12 |
| 28.52 |
| Capital Expenditure in $ Million |
| 100.87 |
| 69.50 |
| 73.16 |
| 96.60 |
| 113.09 |
| Free Cash Flow in $ Million |
| -65.93 |
| -75.93 |
| -50.51 |
| -115.72 |
| -84.58 |
| Total cash $ Million |
| 56.66 |
| 73.33 |
| 161.70 |
| 111.64 |
| 93.50 |
| Total Debt (including lease obligation) In $ Million |
| 487.50 |
| 485.51 |
| 547.5 |
| 635.7 |
| 515.9 |
| Shares outstanding in Million |
| 257.15 |
| 263.56 |
| 278.04 |
| 278.11 |
| 282.92 |
Data Source: Company release
Analysis: Revenues, Free Cash Flow, Debt, And Production Details
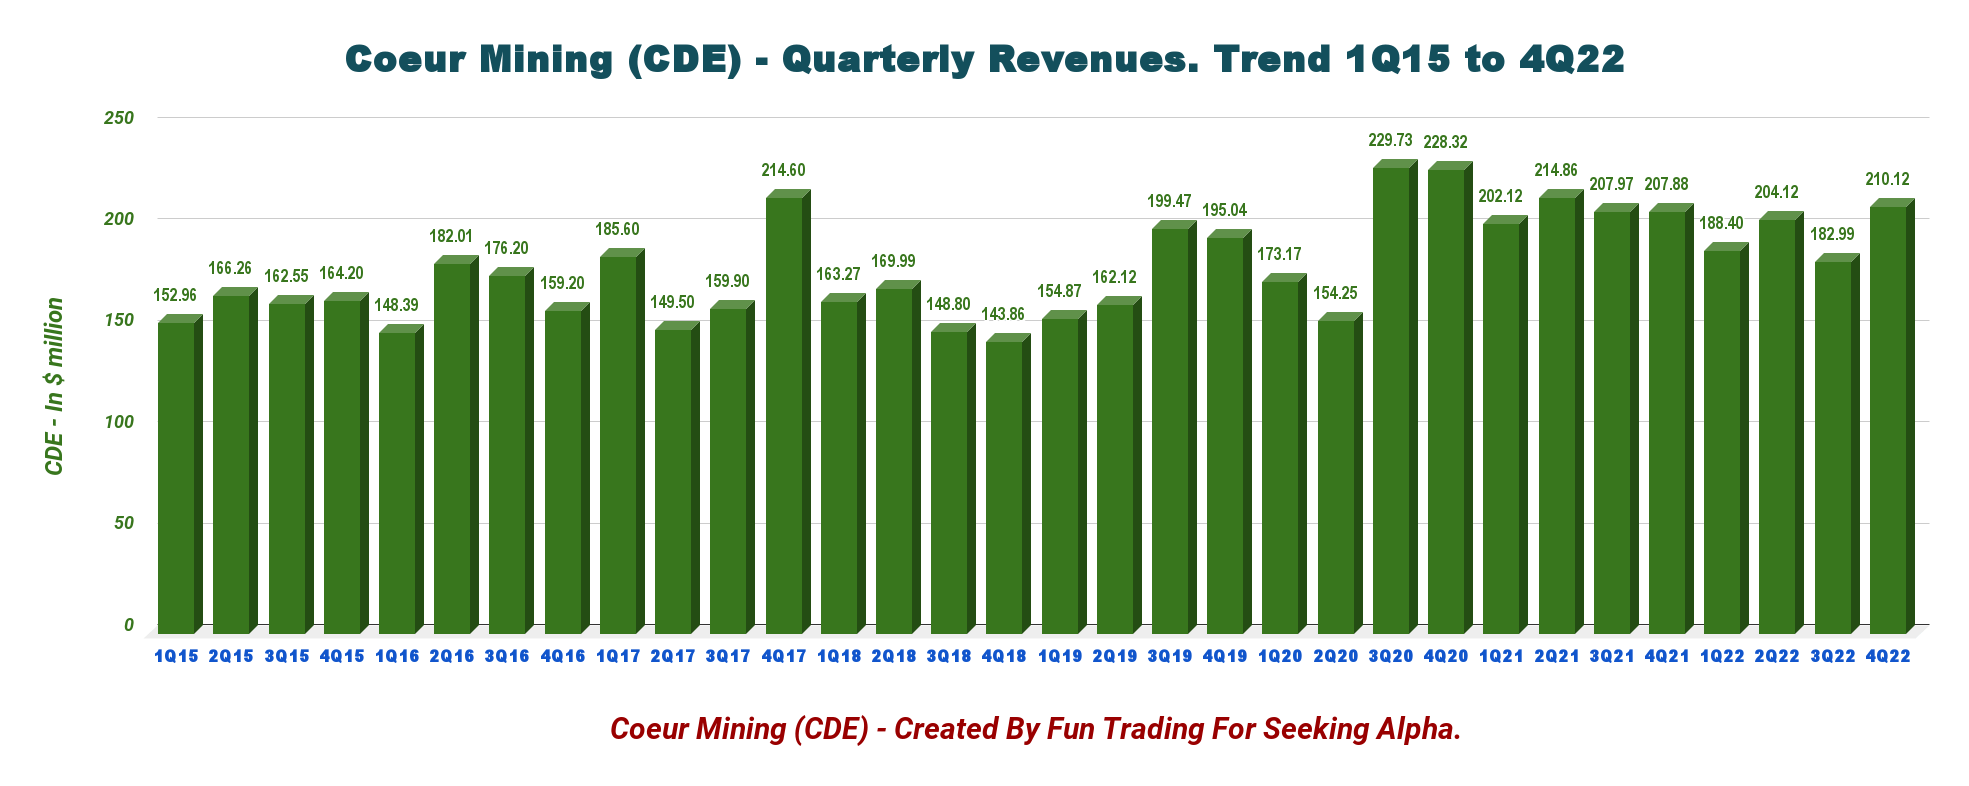
1 - Revenues and trends - Revenues were $210.12 million in 4Q22
CDE Quarterly Revenues history (Fun Trading) Coeur Mining posted $210.12 million in revenues, with an EBITDA of $84.33 million and a cash flow loss from operating activities of $28.52 million. The adjusted net income was a loss of $17.5 million, or $0.06 per share.
The company reported a net income of $49.09 million, or $0.19 per diluted share, compared with a loss of $0.05 per share a year ago.
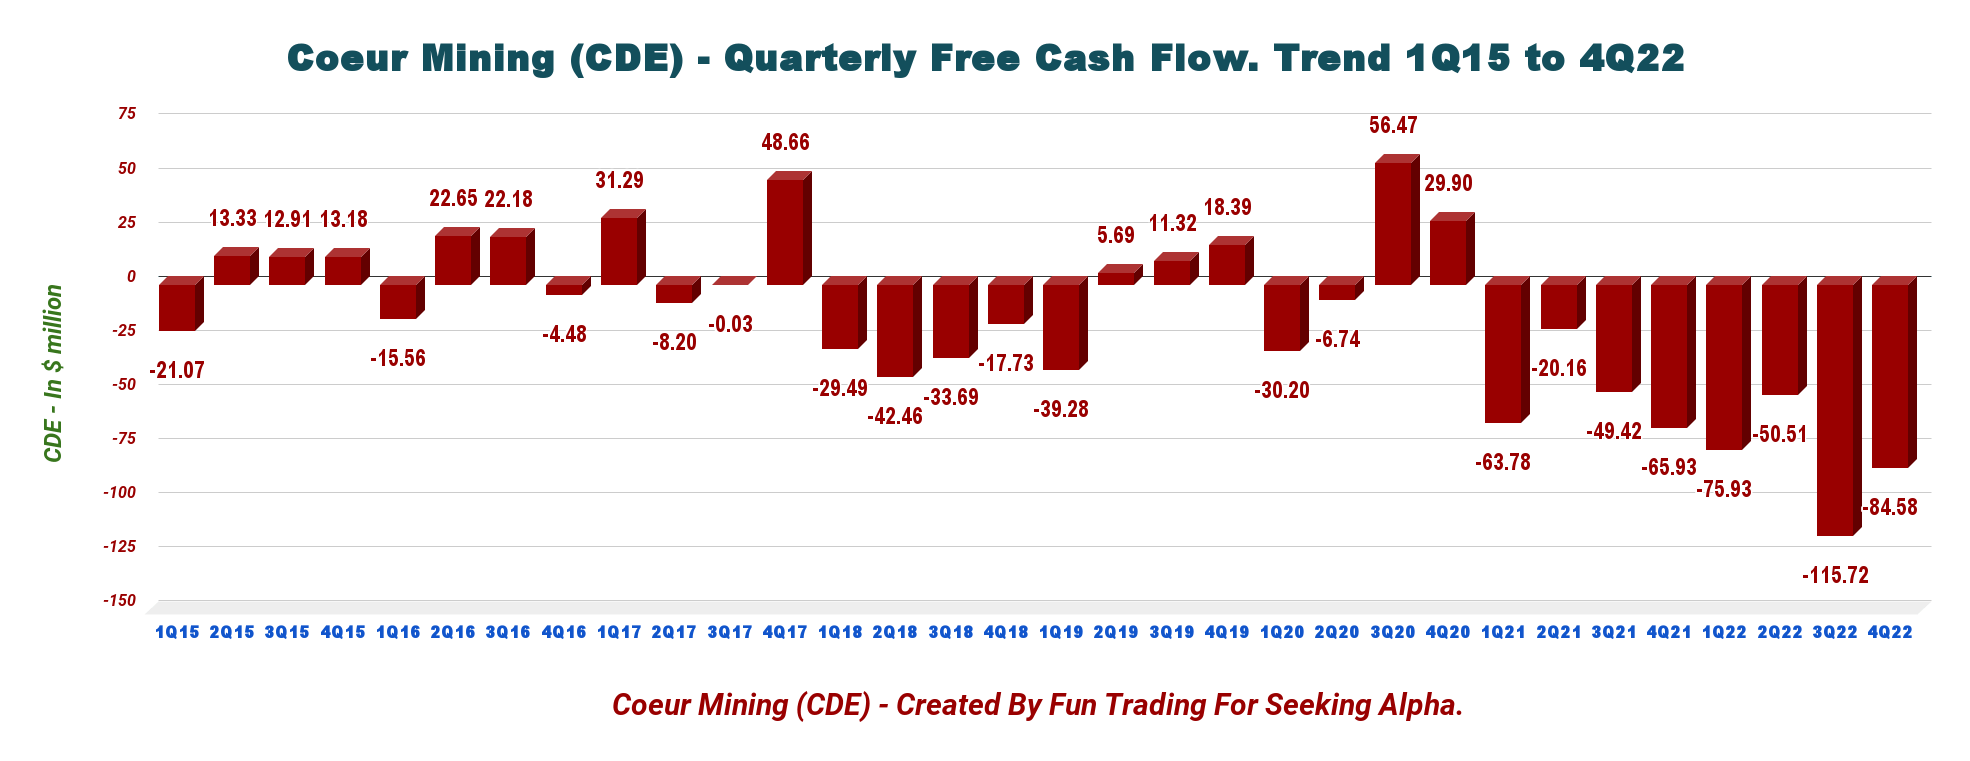
2 - Free cash flow was a loss of $84.58 million in 4Q22
CDE Quarterly Free cash flow history (Fun Trading)
Note: Generic free cash flow is cash from operations minus CapEx
Coeur Mining's free cash flow for the fourth quarter of 2022 was a loss of $84.58 million, and the trailing 12-month free cash flow was a loss of $326.74 million.
The company's CapEx in 4Q22 was $113.09 million, and cash flow from operations was a loss of $28.52 million. The company's CapEx is an issue and runs too high for comfort.
This recurring free cash flow loss since 1Q21 is quite concerning. However, The Rochester Expansion seems to be the main reason for the loss and should be resolved by H2 2023. The company said in the press release:
Capital expenditures increased 17% quarter-over-quarter to $113 million, bringing the full-year total to $352 million and within Coeur's 2022 guidance range of $330 - $395 million. Expenditures related to the expansion project at Rochester totaled $89 million and $229 million during the fourth quarter and full year, respectively, compared to $68 million in the third quarter and $148 million in 2021. Sustaining and development capital expenditures accounted for approximately 18% and 82%, respectively, of Coeur's total capital investment during the quarter.
Those concerns become less critical with the recent bullish run experienced in gold and silver prices.
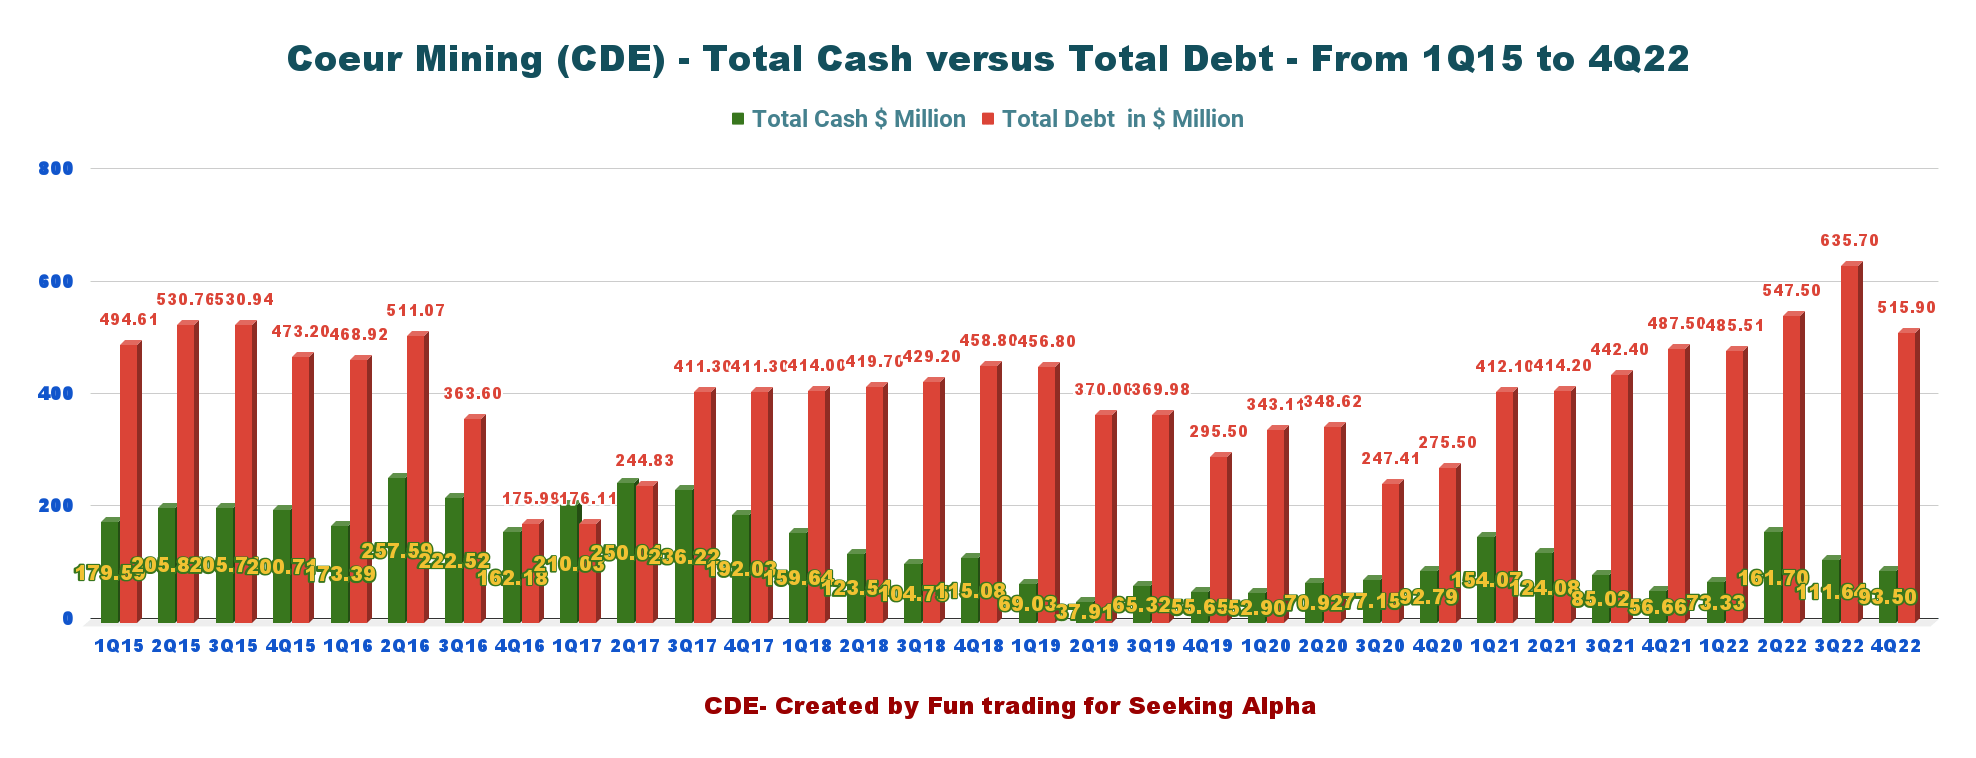
3 - Available capital, net debt, liquidity, and hedges
CDE Quarterly Cash versus Total debt history (Fun Trading)
Total debt was $515.9 million, and net debt was $422.4 million. Cash, cash on hand, and marketable securities were down to $93.50 million.
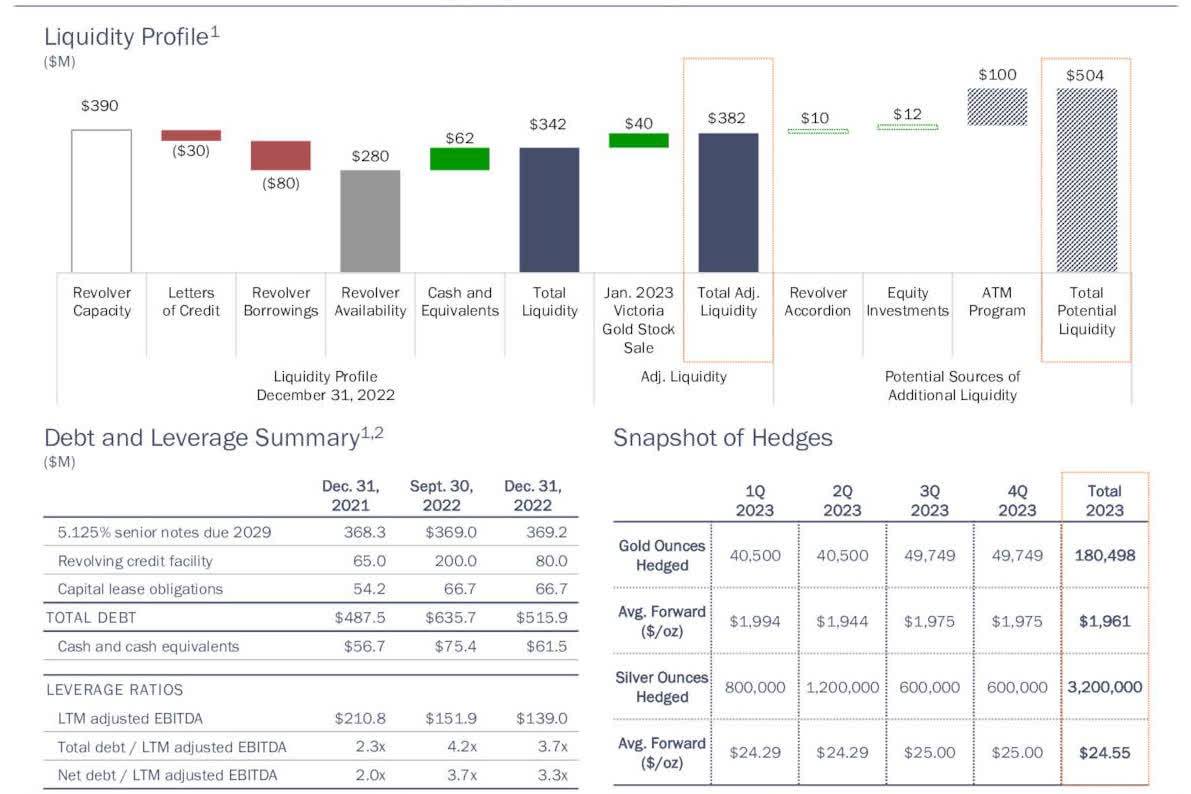
Total potential Liquidity is now $504 million (including $100 million ATM).
For financial ratios and Metal sales hedges, please see below:
CDE Debt Liquidity (CDE Presentation)
The only issue as a shareholder is that the company established a $100 million ATM program, a dilution potential.
CFO Tom Whelan said in the conference call:
The key elements of our financing strategy include we recently monetized our remaining position in Victoria Gold for $40 million, a revolving credit facility, which has $280 million of capacity. Our hedging program designed to provide downside commodity price risk protection during this period of capital intensity. We head into 2023 with approximately 180,000 ounces of gold hedged at $1,961 per ounce and 3.2 million ounces of silver hedge at $24.55 per ounce, and we put a new ATM in place for gross potential proceeds of up to $100 million.
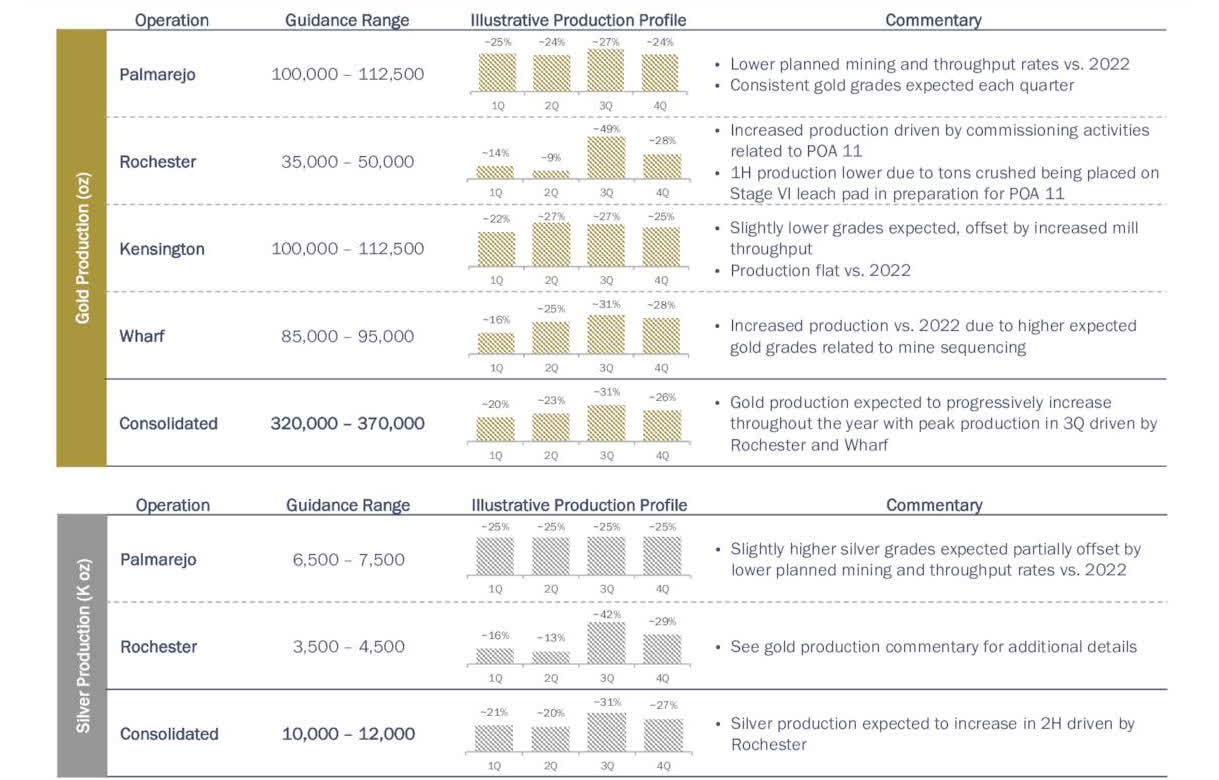
4 - 2023 outlook
In 2023, gold production is expected to be between 320K-370K oz, while silver production is between 10 And 12 Moz.
CDE 2023 Guidance (CDE Presentation)
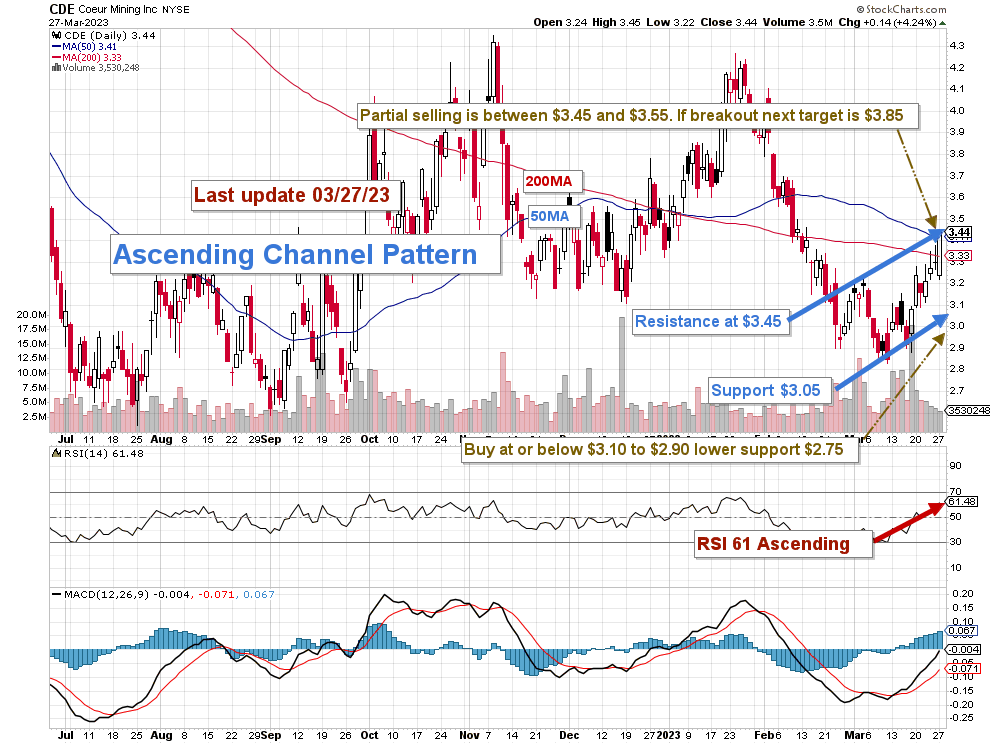
Technical Analysis And Commentary
CDE TA Chart short-term (Fun Trading StockCharts)
CDE forms an ascending channel pattern with resistance at $3.45 and support at $3.05. RSI is now 61 and is close to showing an overbought situation.
Ascending channel patterns are short-term bullish moving higher within an ascending channel, but these patterns generally form within longer-term downtrends as continuation patterns.
The trading strategy is to sell about 40%-50% of your position LIFO and keep a core long-term position for a higher target back of around $5.50 to $6.
I suggest taking profits LIFO between $3.45 and $3.55 with possible higher resistance at $3.85 and waiting patiently for a retracement between $3.10 and $2.90 with lower support at $2.75 to accumulate again.
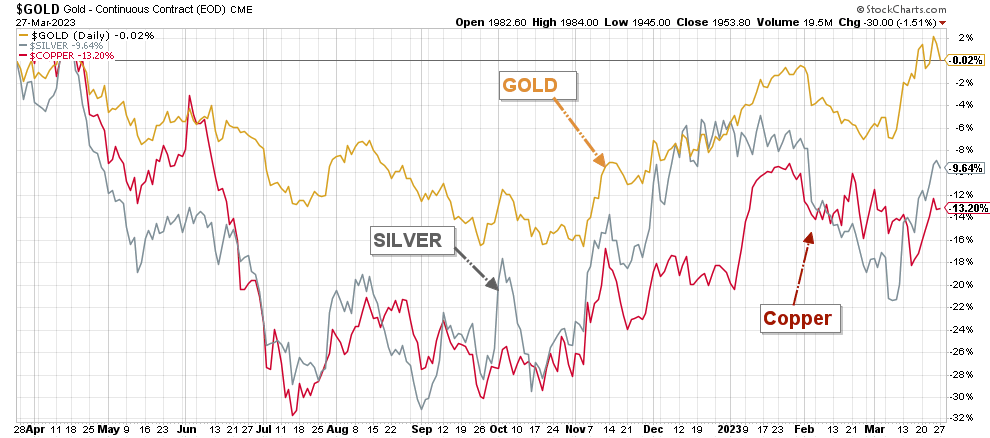
CDE 1-Year Chart gold, silver, and copper (Fun Trading StockCharts)
CDE is highly correlated to gold and silver prices which are fluctuating wildly now due to the Fed's action against rampant inflation.
Gold and silver recovered from their recent lows in October 2022. However, while the gold price is performing well and is still at $1,958 per ounce today, the silver price is still down about 10% YoY.
Thus, be cautious and watch the gold and silver prices like a hawk.
Warning: The TA chart must be updated frequently to be relevant. It is what I am doing in my stock tracker. The chart above has a possible validity of about a week. Remember, the TA chart is a tool only to help you adopt the right strategy. It is not a way to foresee the future. No one and nothing can.
For further details see:
Coeur Mining: Rochester Expansion Nearing Completion