PAAS - Coeur Mining: We Need A Lot Of Patience With This One (Rating Upgrade)
2023-05-17 11:50:39 ET
Summary
- Coeur Mining, Inc. quarterly revenue was $187.30 million, representing a decrease of 0.5% year-over-year.
- Total production was 69,039 Au ounces and 2,535K Ag ounces. Metal sales for the quarter totaled 70,866 Au ounces and 2.589 million ounces of silver.
- I recommend buying Coeur Mining stock between $3.25 and $3.10, with lower support at $2.90.
Part I - Introduction
Chicago-based Coeur Mining, Inc. ( CDE ) released its first-quarter results on May 10, 2023.
Note: I have followed CDE quarterly since April 2019. This new article is a quarterly update of my article published on March 28, 2023.
1 - 1Q23 results snapshot
Coeur Mining's quarterly revenue was $187.30 million, representing a decrease of 0.5% year-over-year. Gold and silver sales represented 67.9% and 32.1% of quarterly revenue. Net income was a loss of $24.59 million, or $0.08 per diluted share, compared to an income of $7.68 million, or $0.03 per share, last year.
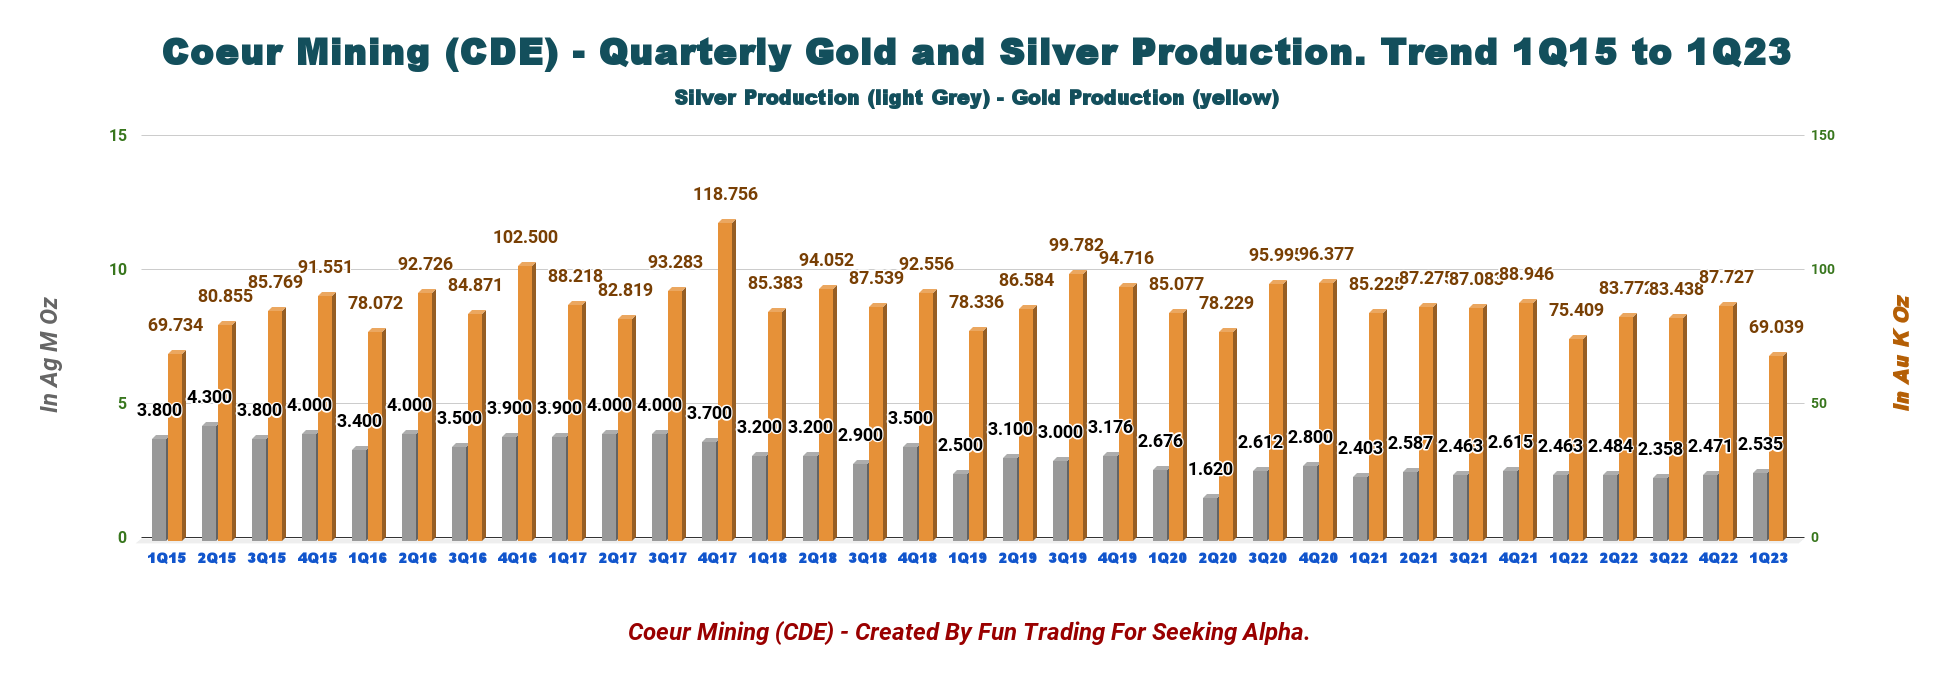
Gold production was better than expected this quarter at Palmarejo, Rochester, and the Wharf, offsetting lower production at Kensington. Total production was 69,039 Au ounces and 2,535K Ag ounces. Metal sales for the quarter totaled 70,866 Au ounces and 2.589 million ounces of silver.
CEO Mitch Krebs said in the conference call:
Our results were slightly ahead of expectations, driven by a strong start to the year at our Palmarejo, Rochester, and Wharf operations, which offset a weaker quarter from our Kensington mine. As we have said, the first quarter is typically our softest quarter of the year, due to weather and one-time payments. Overall, we remain on-track to deliver on our full year guidance, which reflects a much stronger second half.
2 - Stock Performance
Coeur Mining, Inc. continues to perform poorly in my portfolio's gold and silver miners. CDE sank significantly on a one-year basis and has underperformed the iShares Silver Trust ETF ( SLV ), the VanEck Vectors Gold Miners ETF ( GDX ), and Fortuna Silver Mines ( FSM ) while doing better than Pan American Silver ( PAAS ). The stock is down 5% YoY.
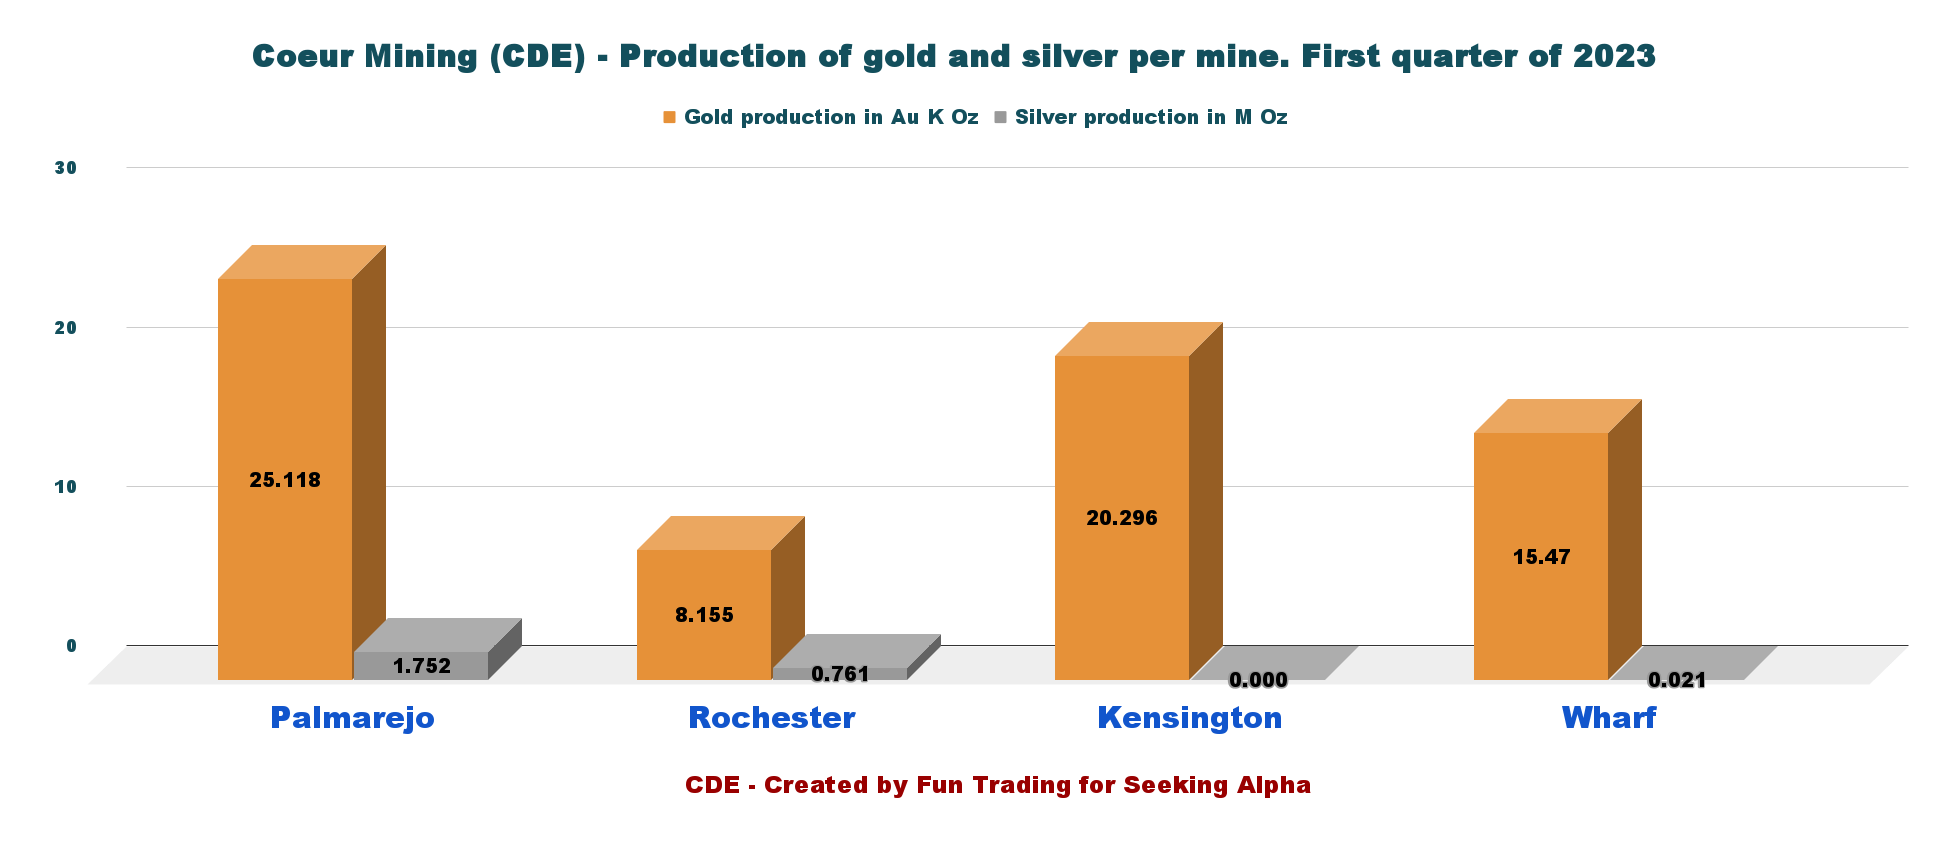
3 - Gold And Silver Production In 1Q23
Strong performances at Palmarejo, Rochester, and Wharf mines offset a weaker quarter from the Kensington mine.
CDE 1Q23 Gold and silver production per mine (Fun Trading)
Detailed Presentation per mine:
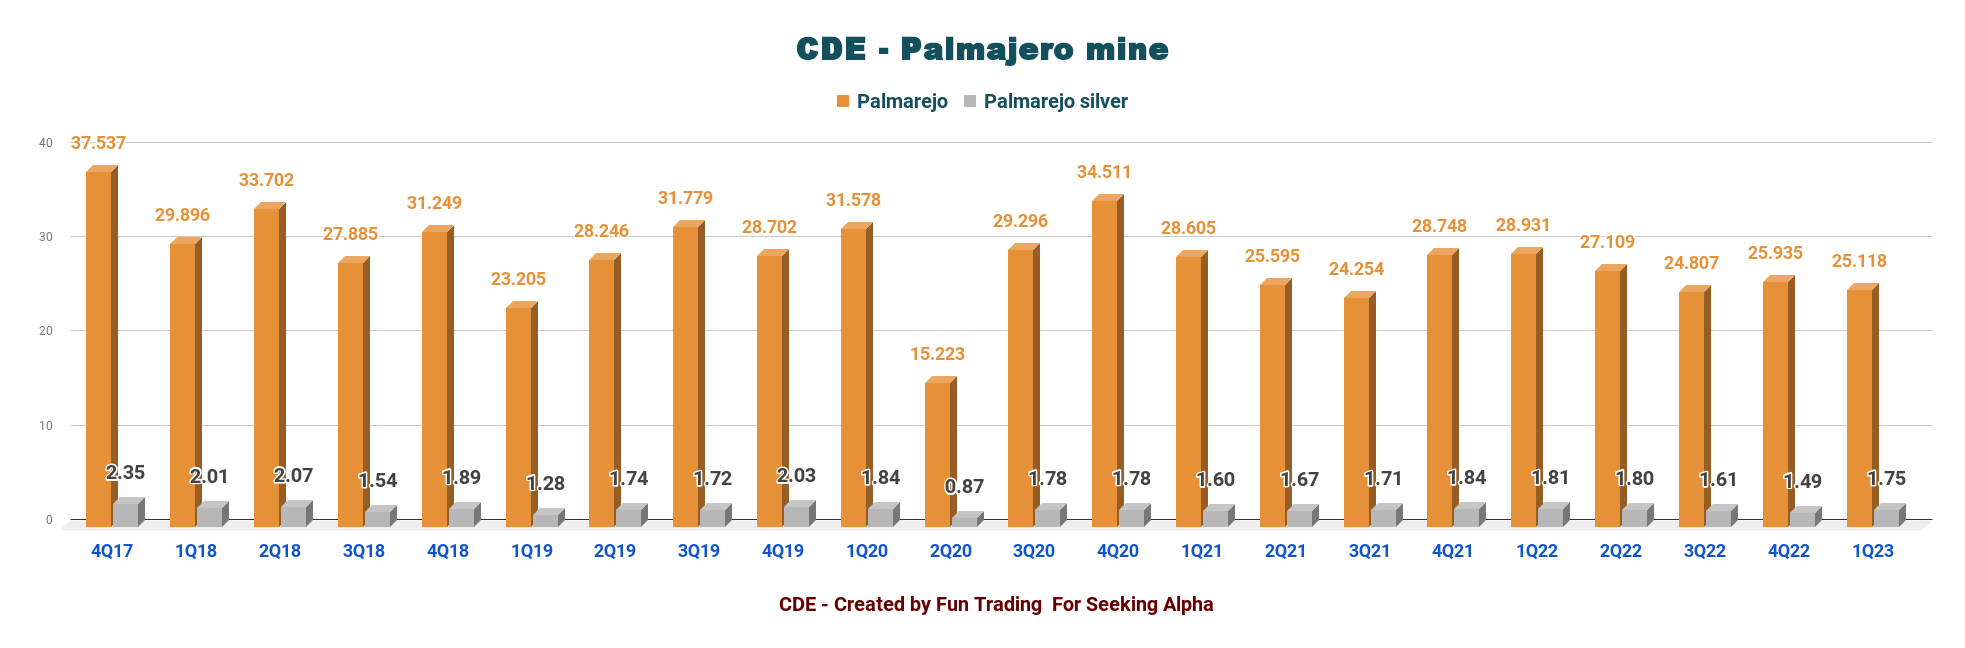
3.1 - Palmarejo mine. Solid quarter
CDE Quarterly Production Palmarejo (Fun Trading)
During 1Q23, gold and silver production totaled 25,118 Au oz and 1.752 Moz, respectively, compared to 25,935 Au Oz and 1.489 Ag Moz in the prior period.
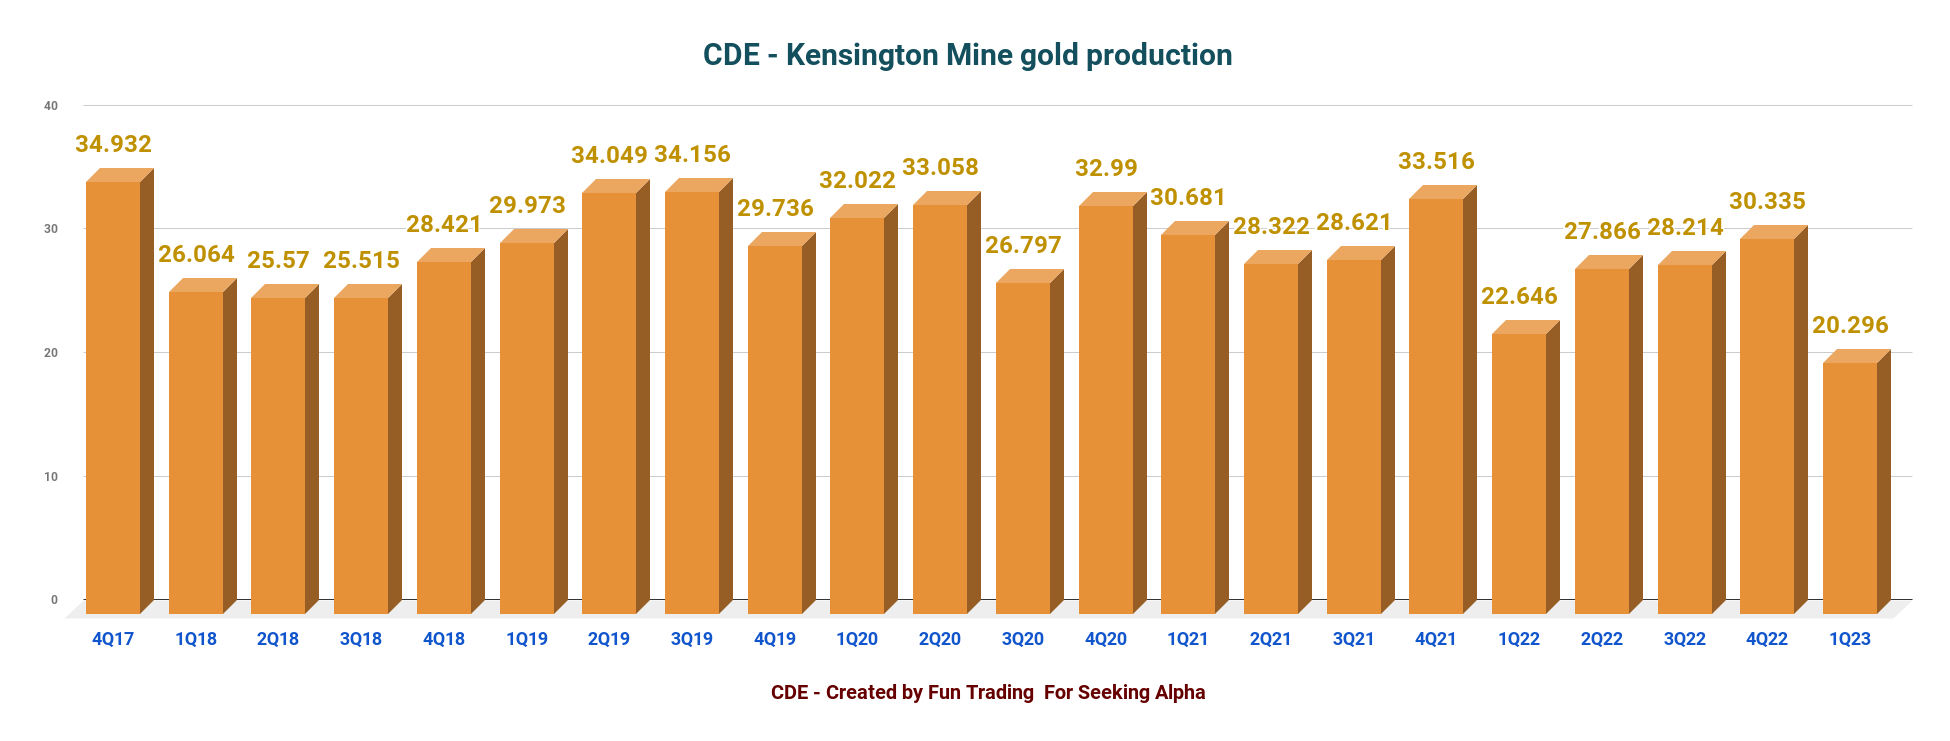
3.2 - Kensington Mine. A better production this quarter
CDE Quarterly Production history Kensington (Fun Trading)
Gold production decreased in the first quarter to 20,296 ounces compared to 22,646 ounces in the prior year period.
3.3 Rochester mine. Bad weather impacted the results.
CDE Quarterly Production Rochester History (Fun Trading)
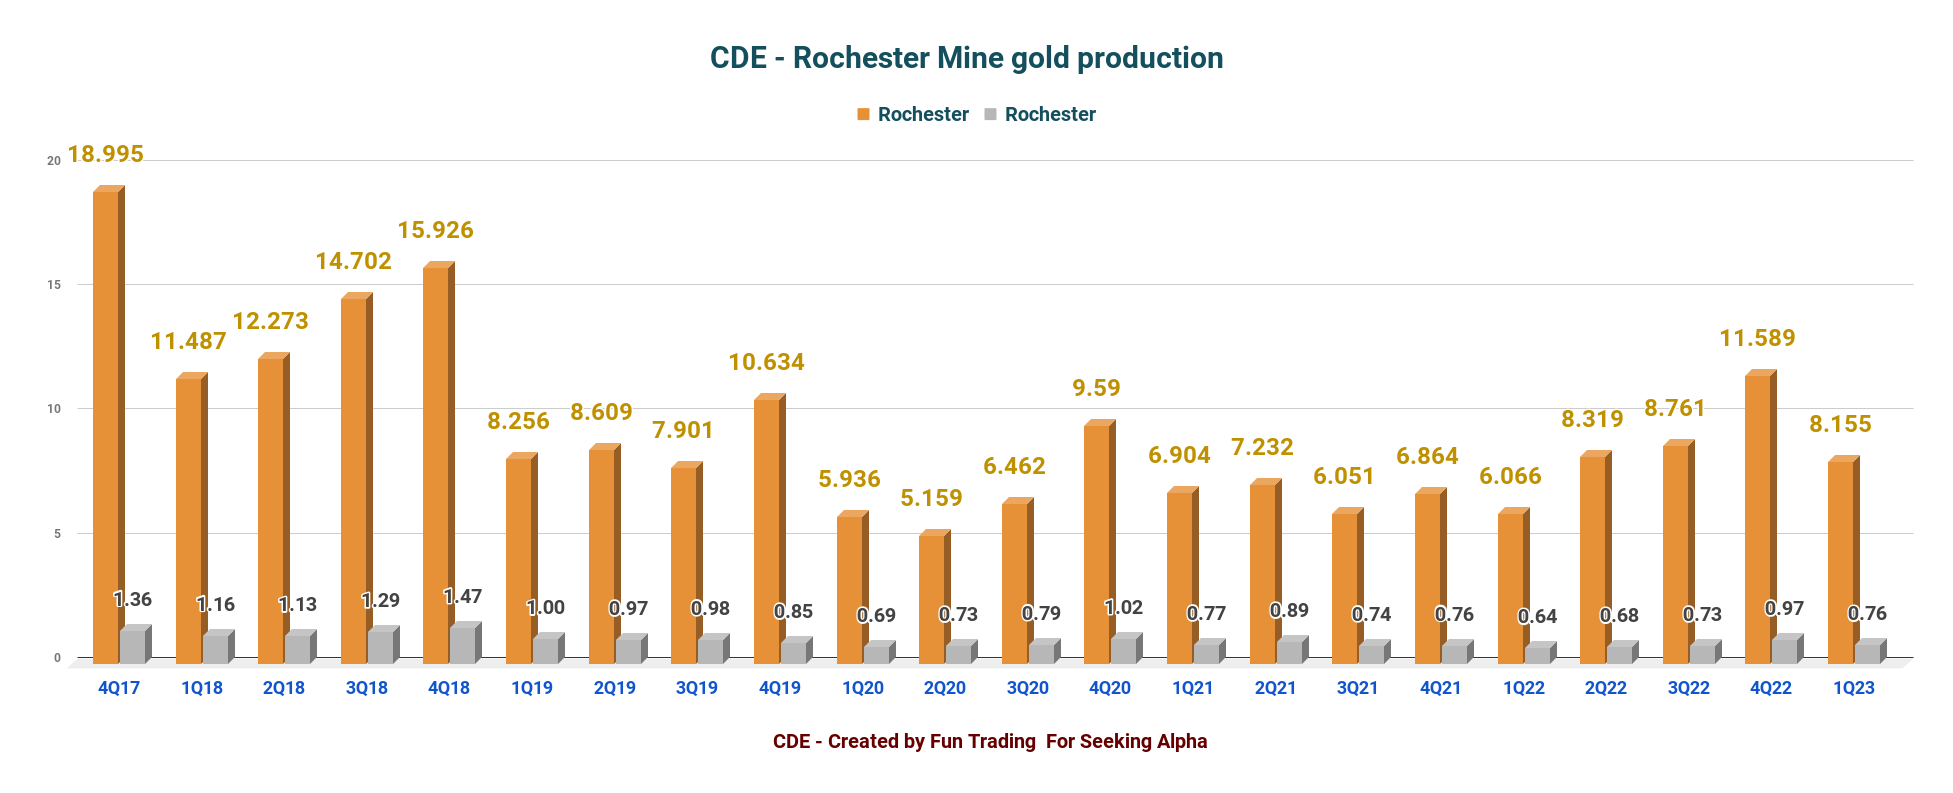
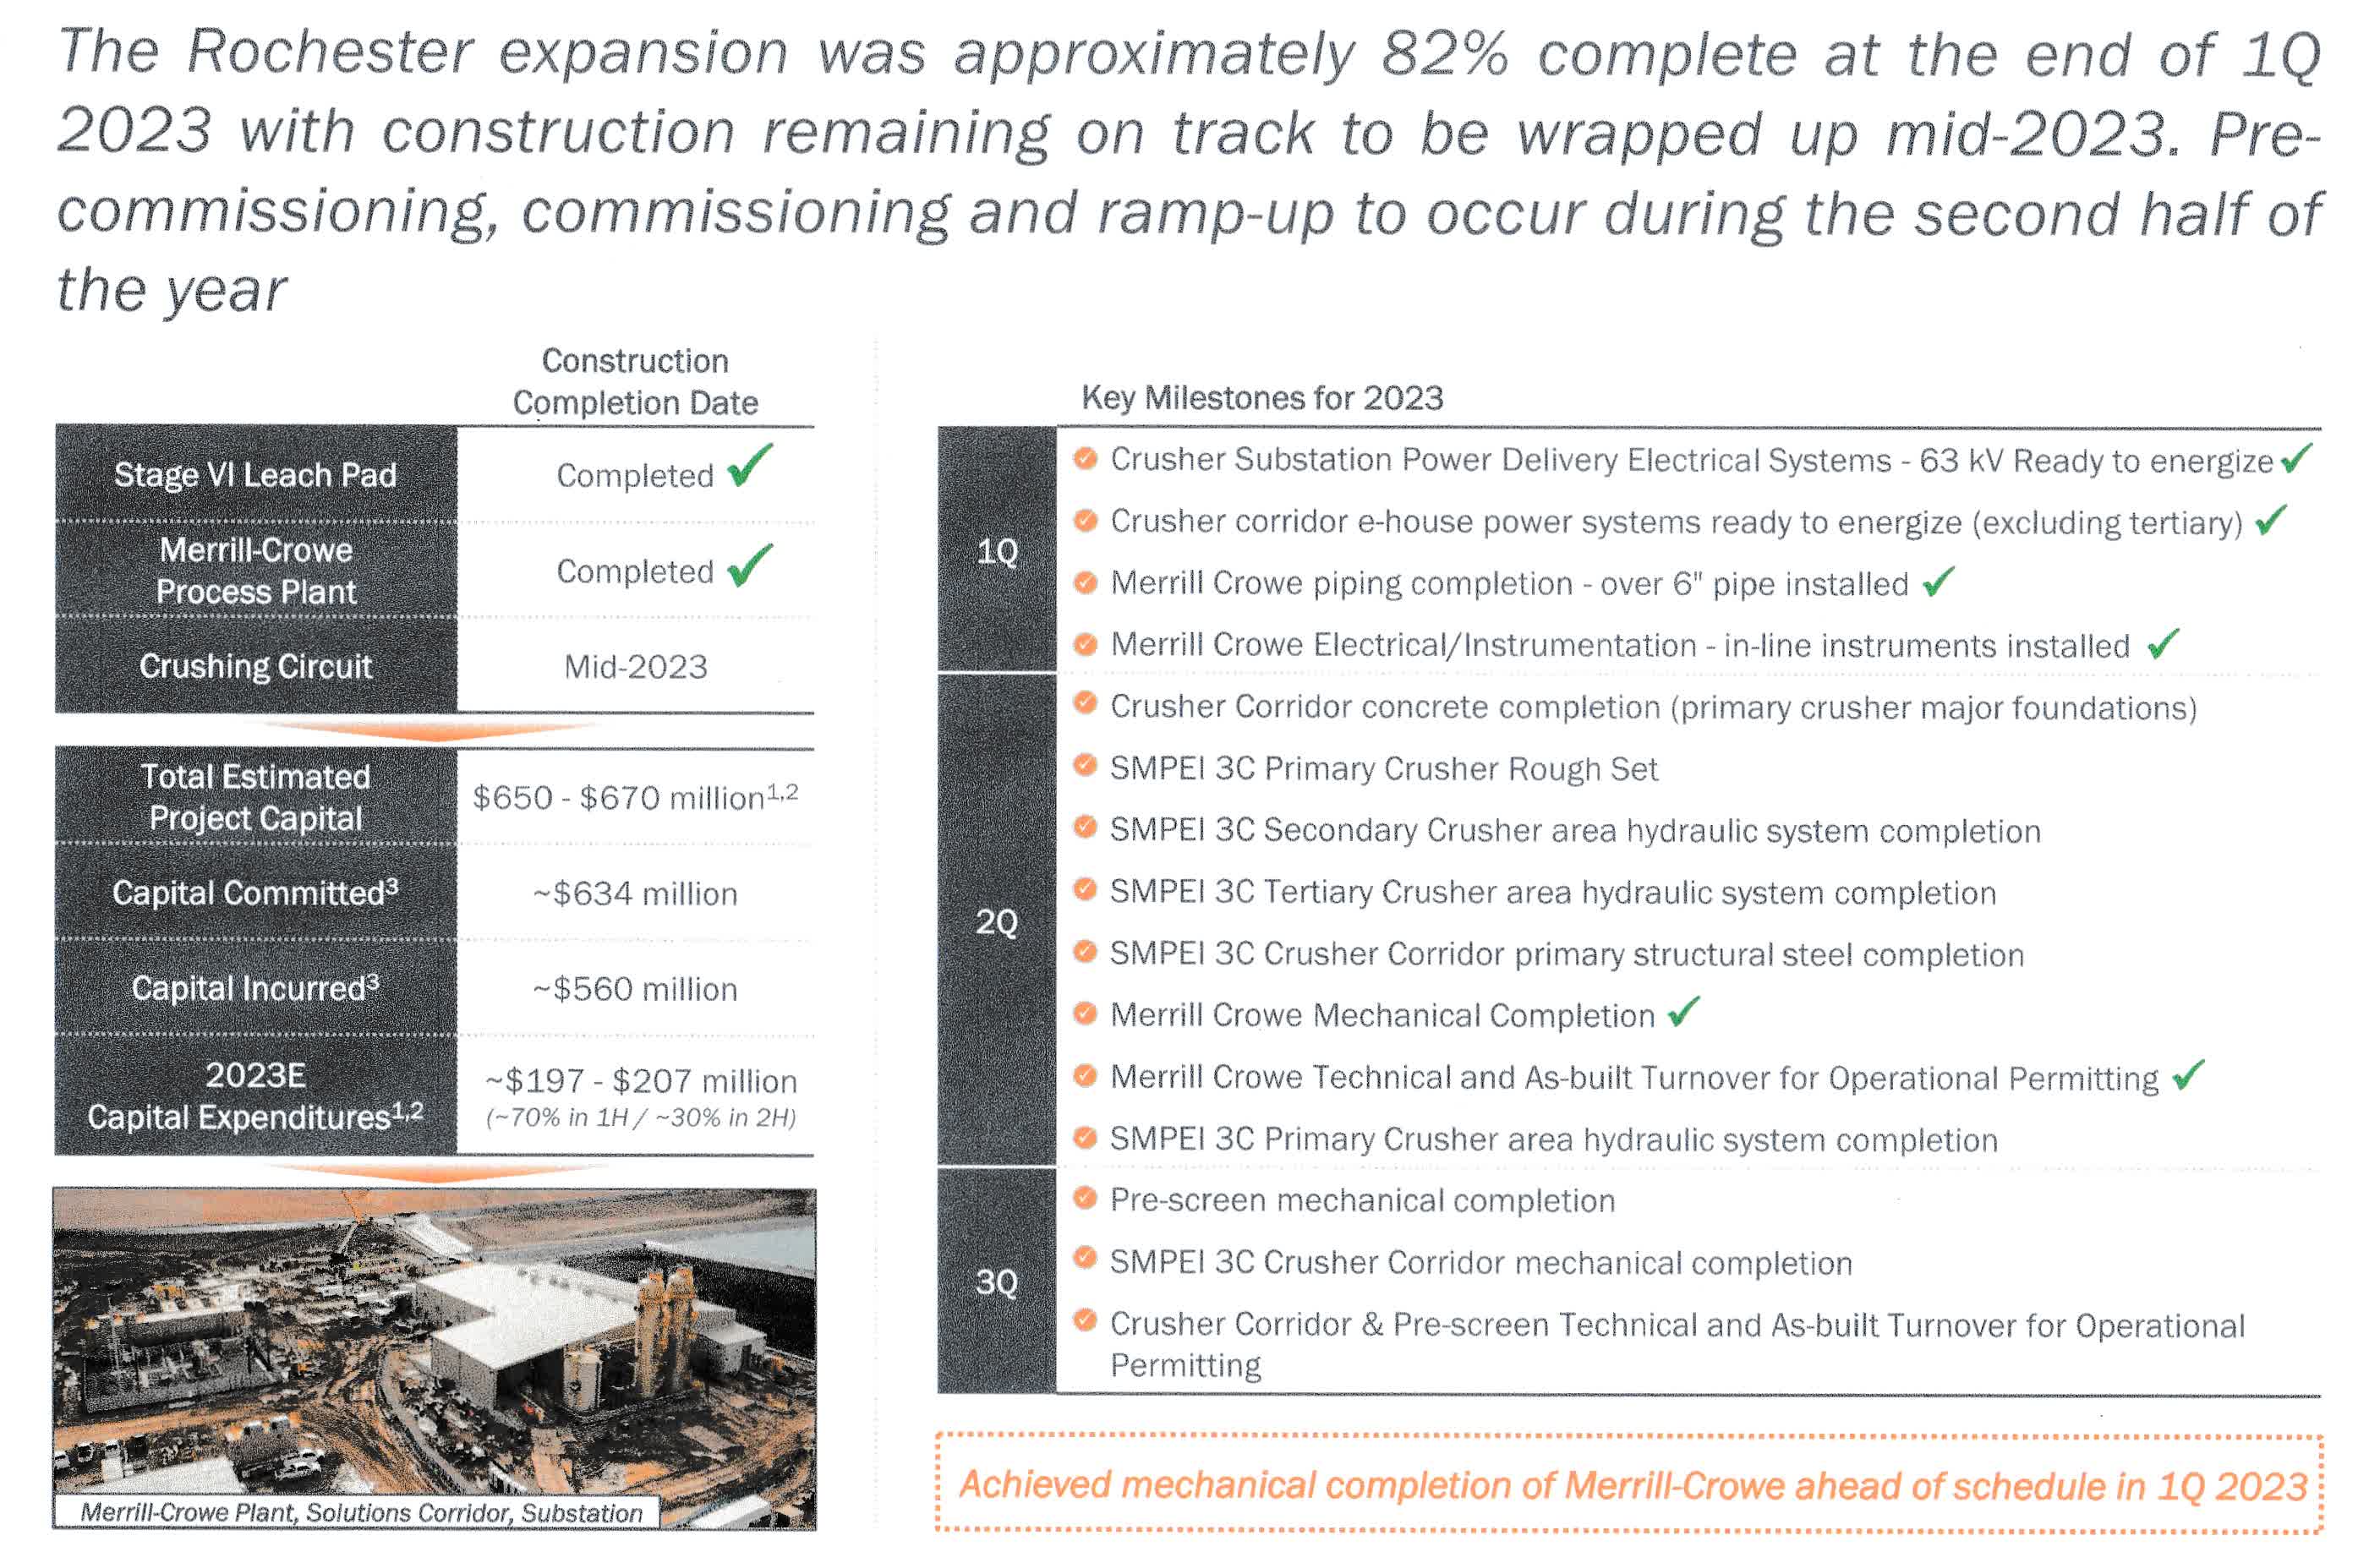
However, Coeur Mining, Inc.'s Rochester expansion is now above 82% completed.
CDE Rochester Expansion Update (CDE Presentation)
3.4 - Coeur Mining metal production
Gold and silver sales were 67.9% and 32.1% of quarterly revenue. Coeur Mining produced 69,039 Au ounces of gold (but sold 70,866 Au Oz) and 2.535 million Ag ounces (sold 2.589 Ag Moz) during the first quarter.
CDE Quarterly Production Gold and Silver History (Fun Trading)
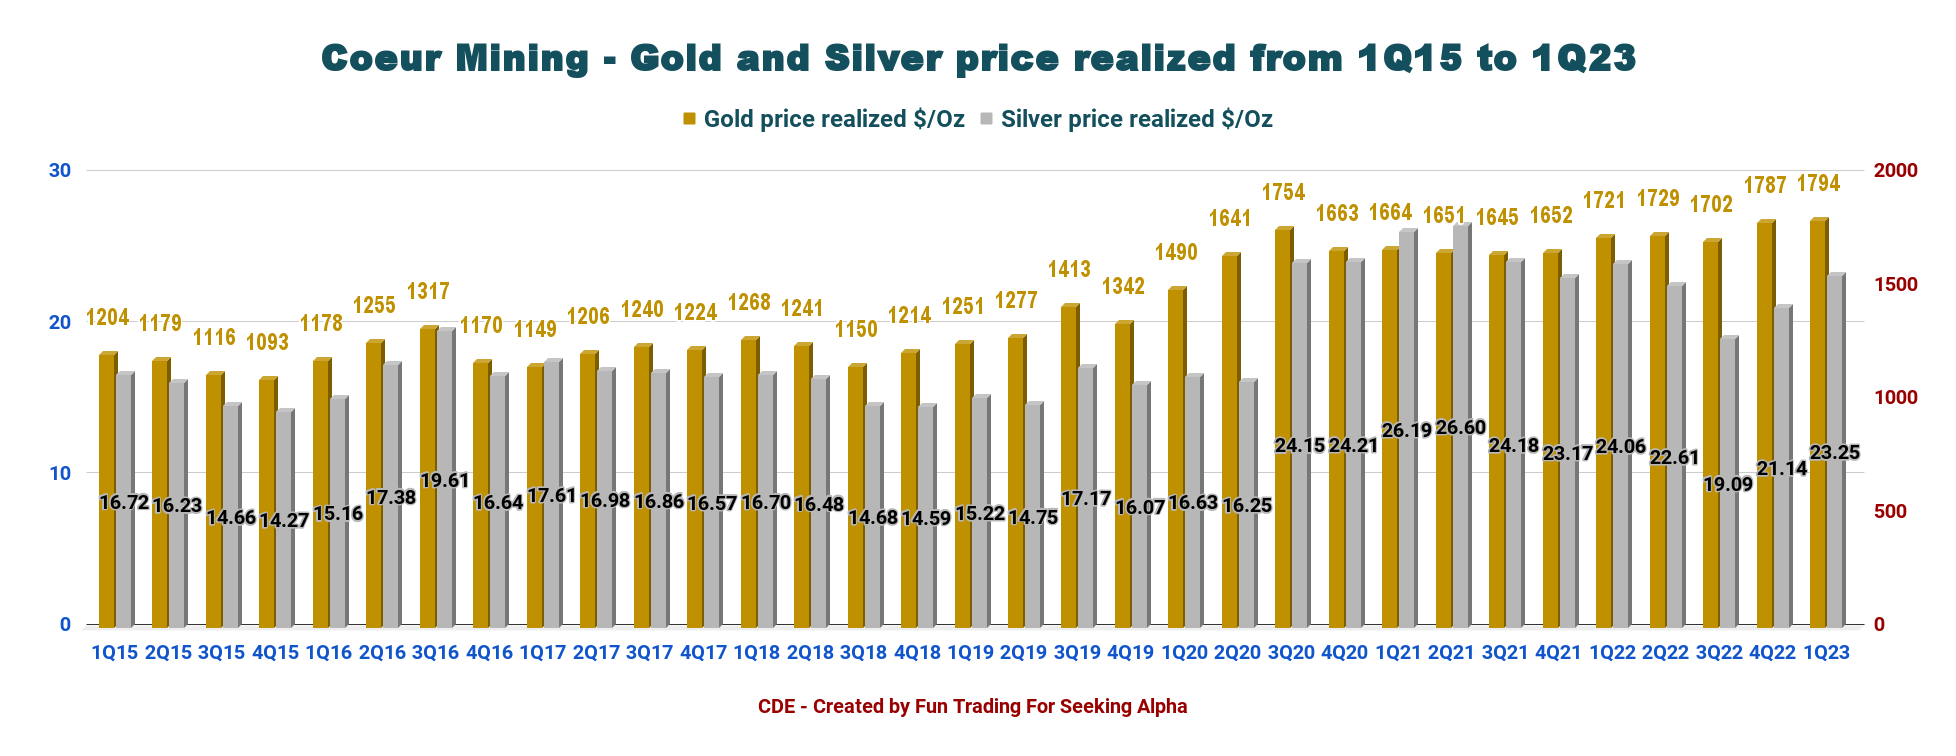
Average realized gold and silver prices for the quarter were $1,794 and $23.25 per ounce, respectively, compared to $1,721 and $24.06 per ounce in the prior year period.
CDE Quarterly Gold and Silver Prices History (Fun Trading)
Part II - Coeur Mining: Financials in 1Q23 - The Raw Numbers
| Coeur Mining |
| 1Q22 |
| 2Q22 |
| 3Q22 |
| 4Q22 |
| 1Q23 |
| Total Revenues in $ Million |
| 188.40 |
| 204.12 |
| 182.99 |
| 210.12 |
| 187.30 |
| Net income in $ Million |
| 7.68 |
| -77.43 |
| -57.44 |
| 49.09 |
| -24.59 |
| EBITDA $ Million |
| 39.96 |
| -33.29 |
| -21.01 |
| 84.33 |
| 16.22 |
| EPS diluted in $/share |
| 0.03 |
| -0.28 |
| -0.21 |
| 0.19 |
| -0.08 |
| Cash from operating activities in $ Million |
| -6.43 |
| 22.64 |
| -19.12 |
| 28.52 |
| -35.00 |
| Capital Expenditure in $ Million |
| 69.50 |
| 73.16 |
| 96.60 |
| 113.09 |
| 74.05 |
| Free Cash Flow in $ Million |
| -75.93 |
| -50.51 |
| -115.72 |
| -84.58 |
| -109.05 |
| Total cash $ Million |
| 73.33 |
| 161.70 |
| 111.64 |
| 93.50 |
| 81.82 |
| Total Debt (including lease obligation) In $ Million |
| 485.51 |
| 547.5 |
| 635.7 |
| 515.9 |
| 485.5 |
| Shares outstanding in Million |
| 263.56 |
| 278.04 |
| 278.11 |
| 282.92 |
| 300.95 |
Data Source: Company 10-Q .
Analysis: Revenues, Free Cash Flow, Debt, And Production Details
1 - Revenues and trends - Revenues were $187.3 million in 1Q23
CDE Quarterly Revenue History (Fun Trading) Coeur Mining posted $187.30 million in revenues, with an EBITDA of $16.22 million and a cash flow loss from operating activities loss of $35.00 million. The adjusted net income was a loss of $33.1 million, or $0.11 per share. The company reported a net loss of $24.59 million, or $0.08 per diluted share, compared with an income of $0.03 a year ago. Michael Routledge said in the conference call: We are pleased with the start to the year and expect company's 2023 production to be significantly weighted towards the second half, consistent with our production guidance we provided earlier this year.
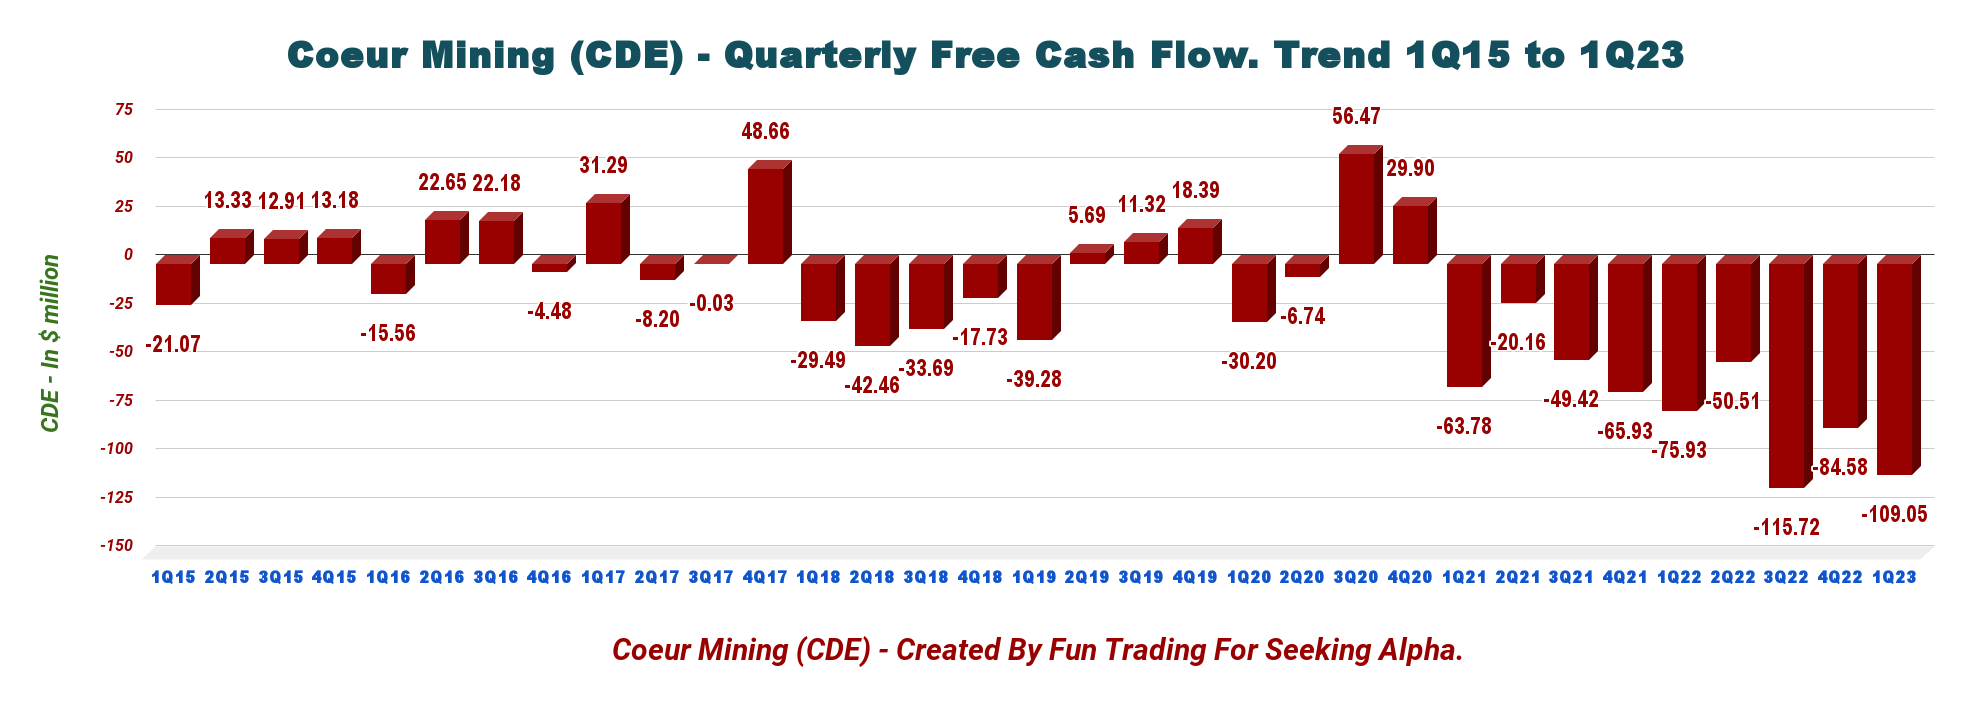
2 - Free cash flow was a loss of $109.05 million in 1Q23
CDE Quarterly Free Cash Flow History (Fun Trading)
Note: Generic free cash flow is cash from operations minus CapEx.
Coeur Mining's free cash flow for the first quarter of 2023 was a loss of $109.05 million, and the trailing 12-month free cash flow was a loss of $359.86 million.
The company's CapEx in 1Q23 was $74.05 million, and cash flow from operations was a loss of $35.00 million.
The Rochester Expansion seems to be the main reason for the loss and should be resolved by H2 2023. However, with solid gold and silver prices, CDE will do quite well in H2 2023.
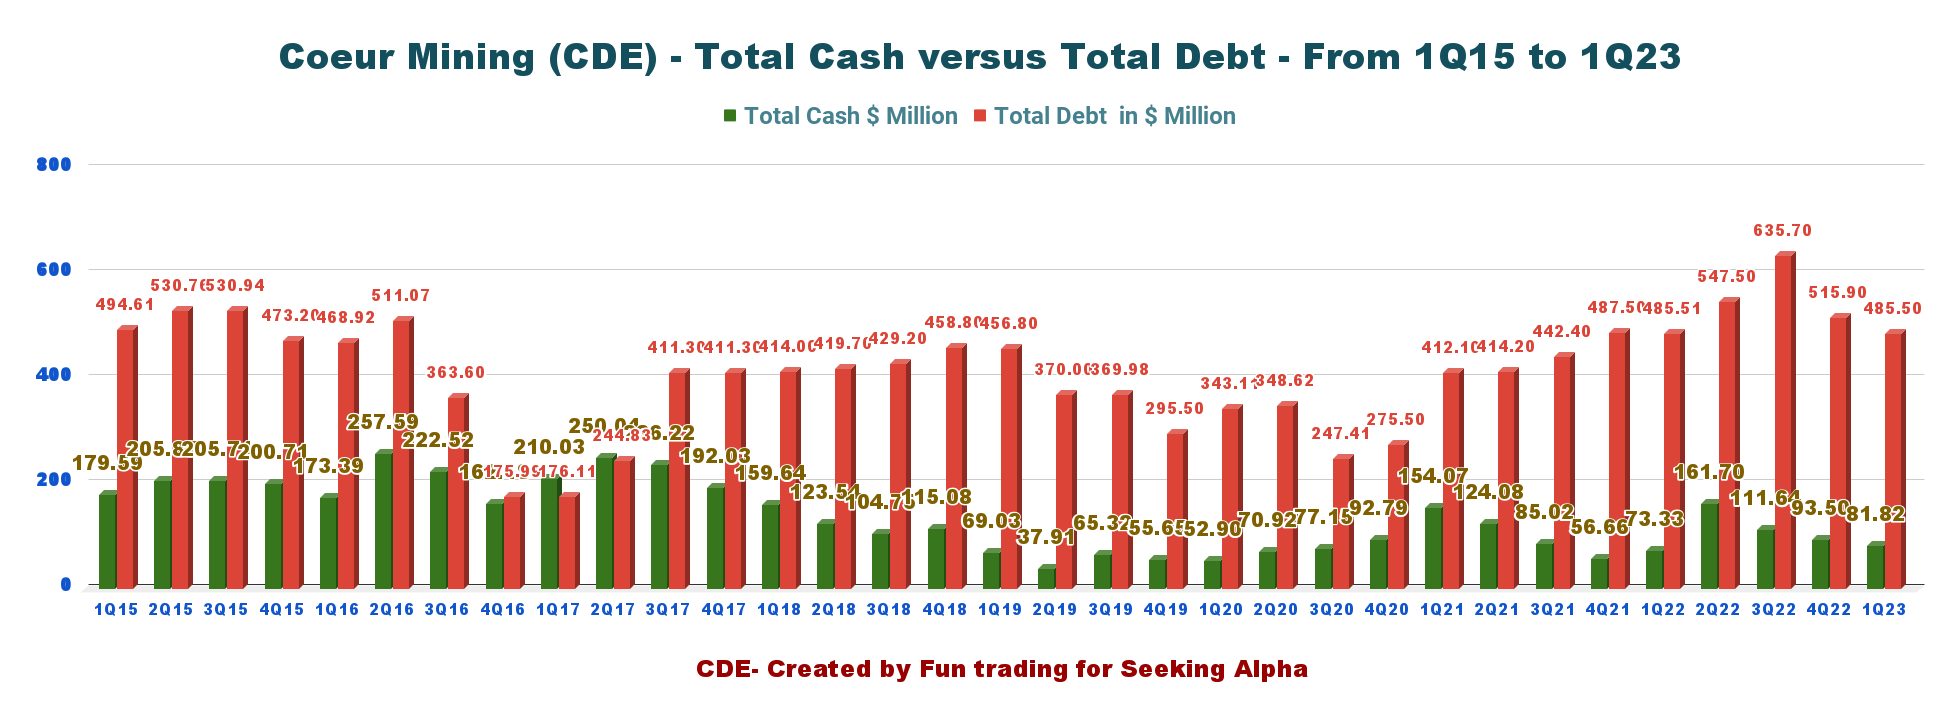
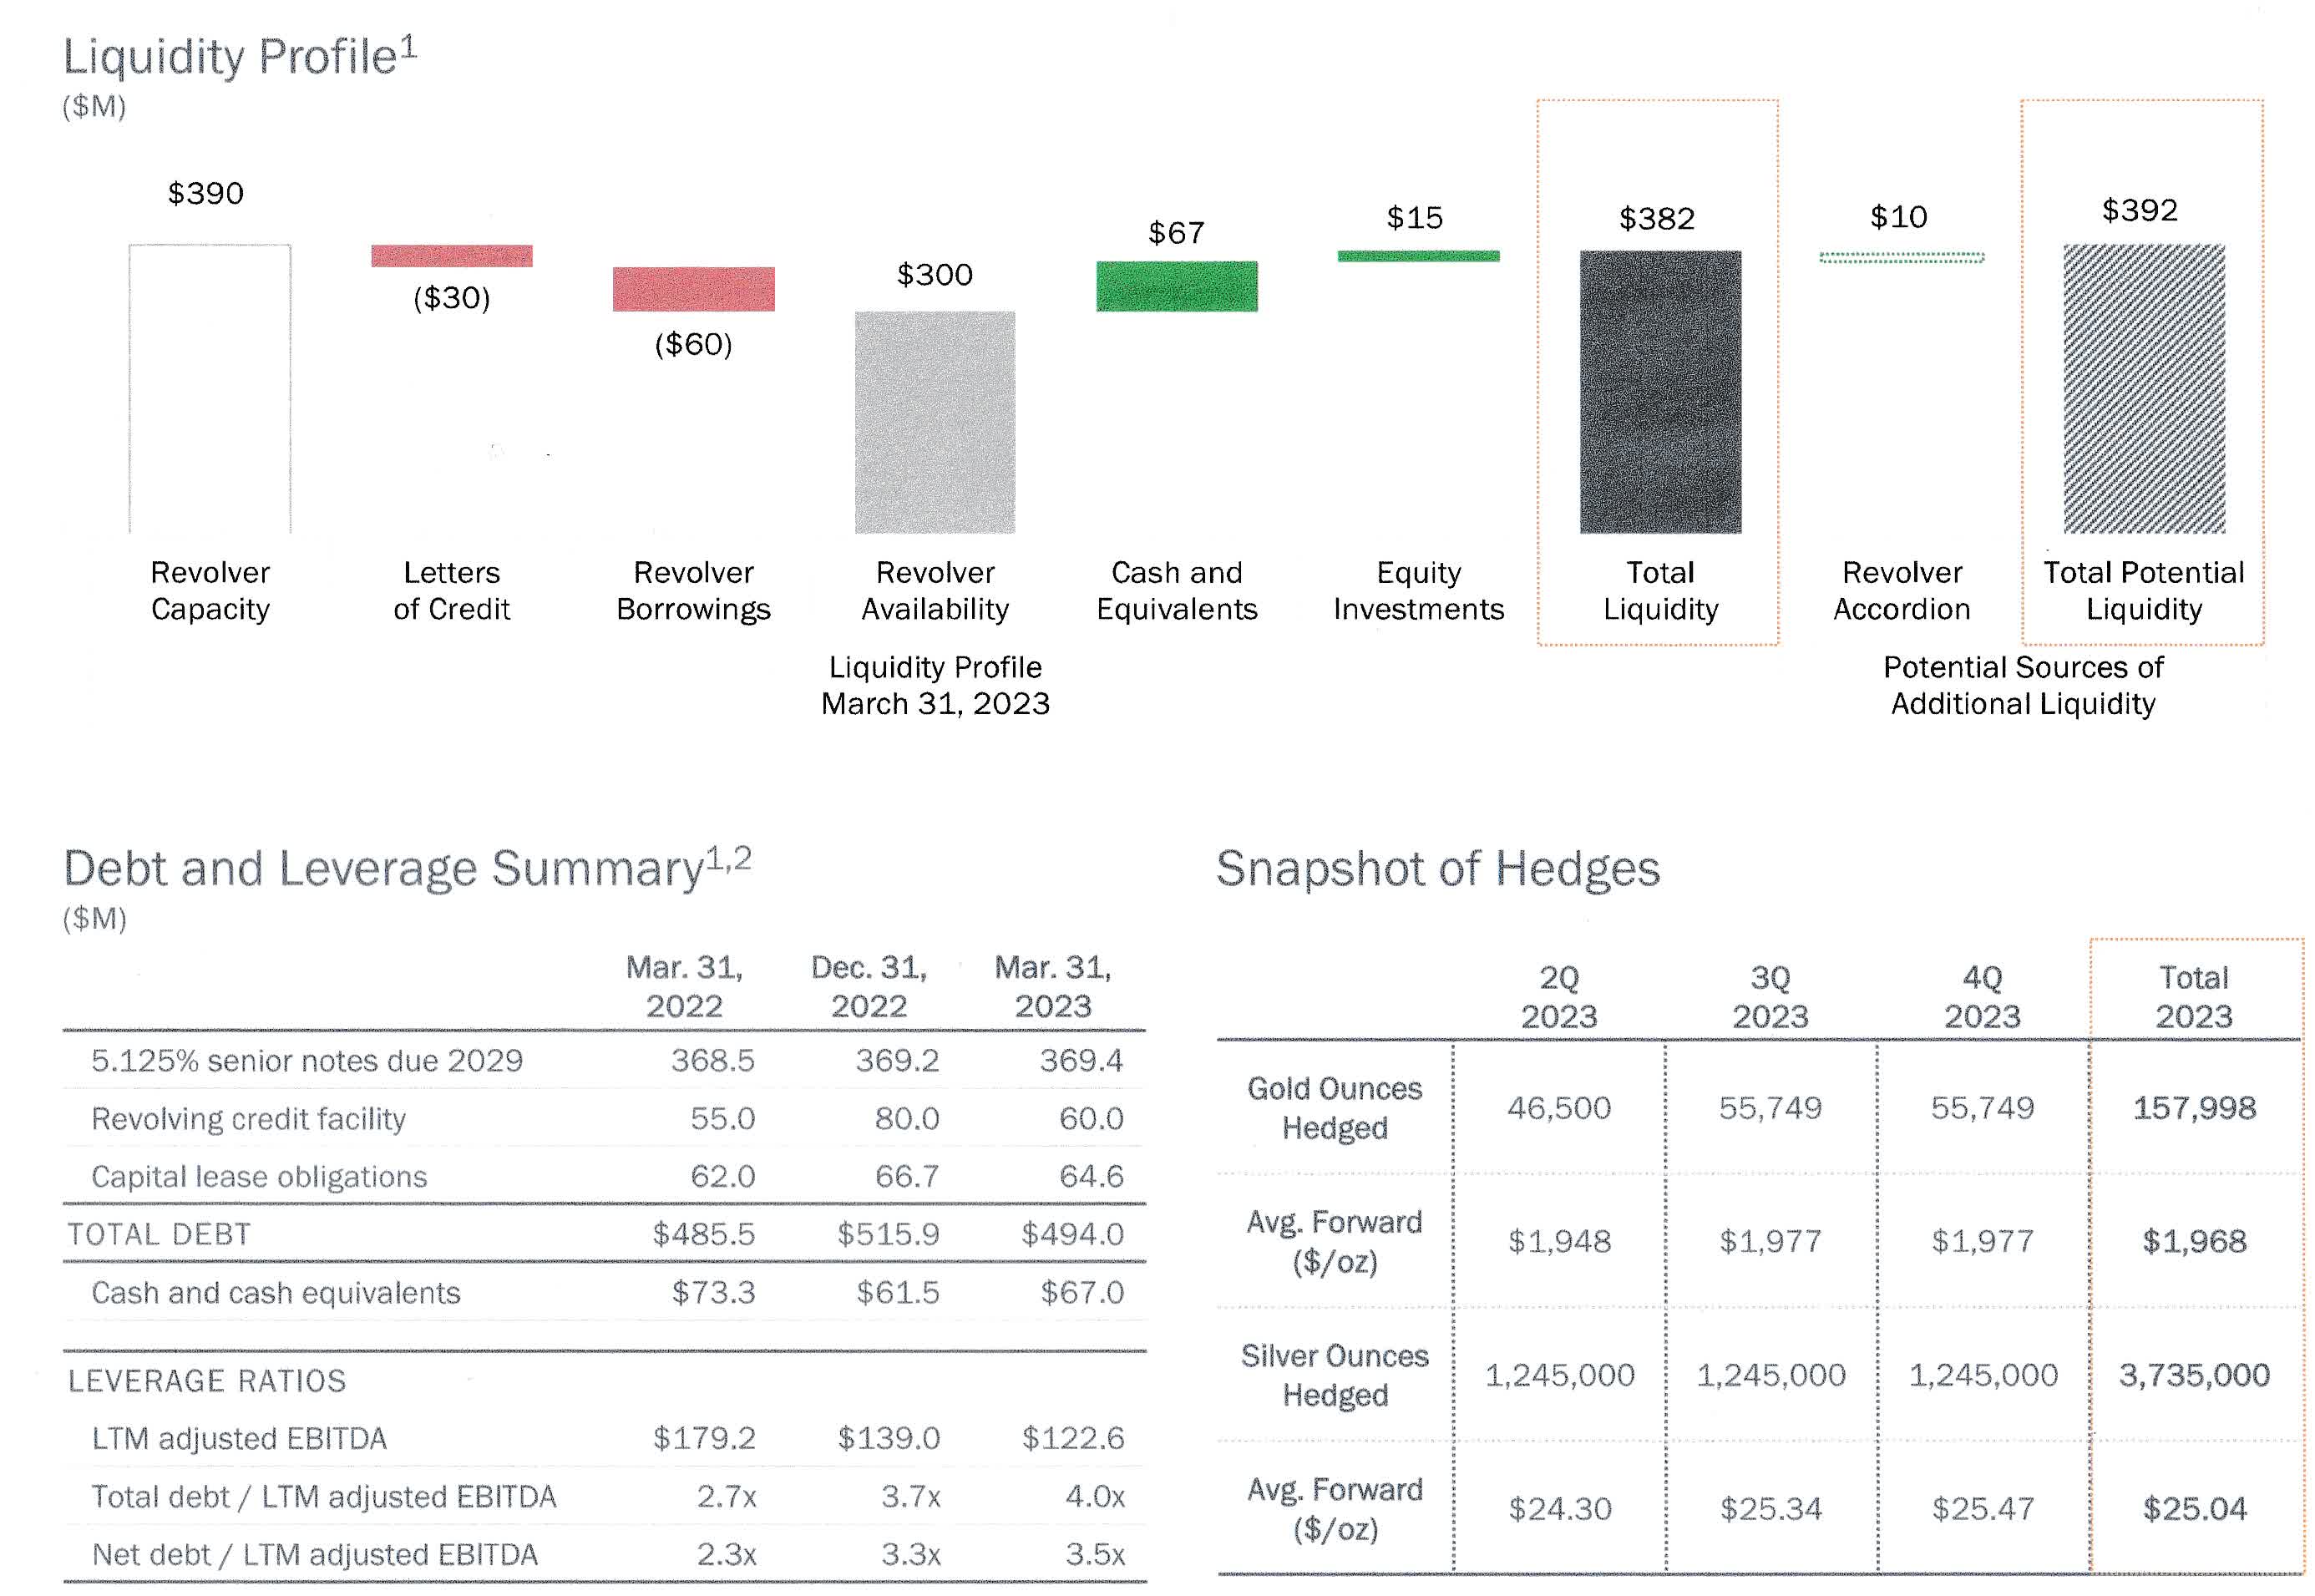
3 - Available capital, net debt, liquidity, and hedges
CDE Quarterly Cash versus Debt History (Fun Trading)
Total debt was $485.5 million, and net debt was $403.68 million. Cash, cash on hand, and marketable securities were down to $81.82 million.
Total potential liquidity is now $382 million (including $100 million ATM).
For financial ratios and Metal sales hedges, please see below:
CDE Liquidity Profile (CDE Presentation)
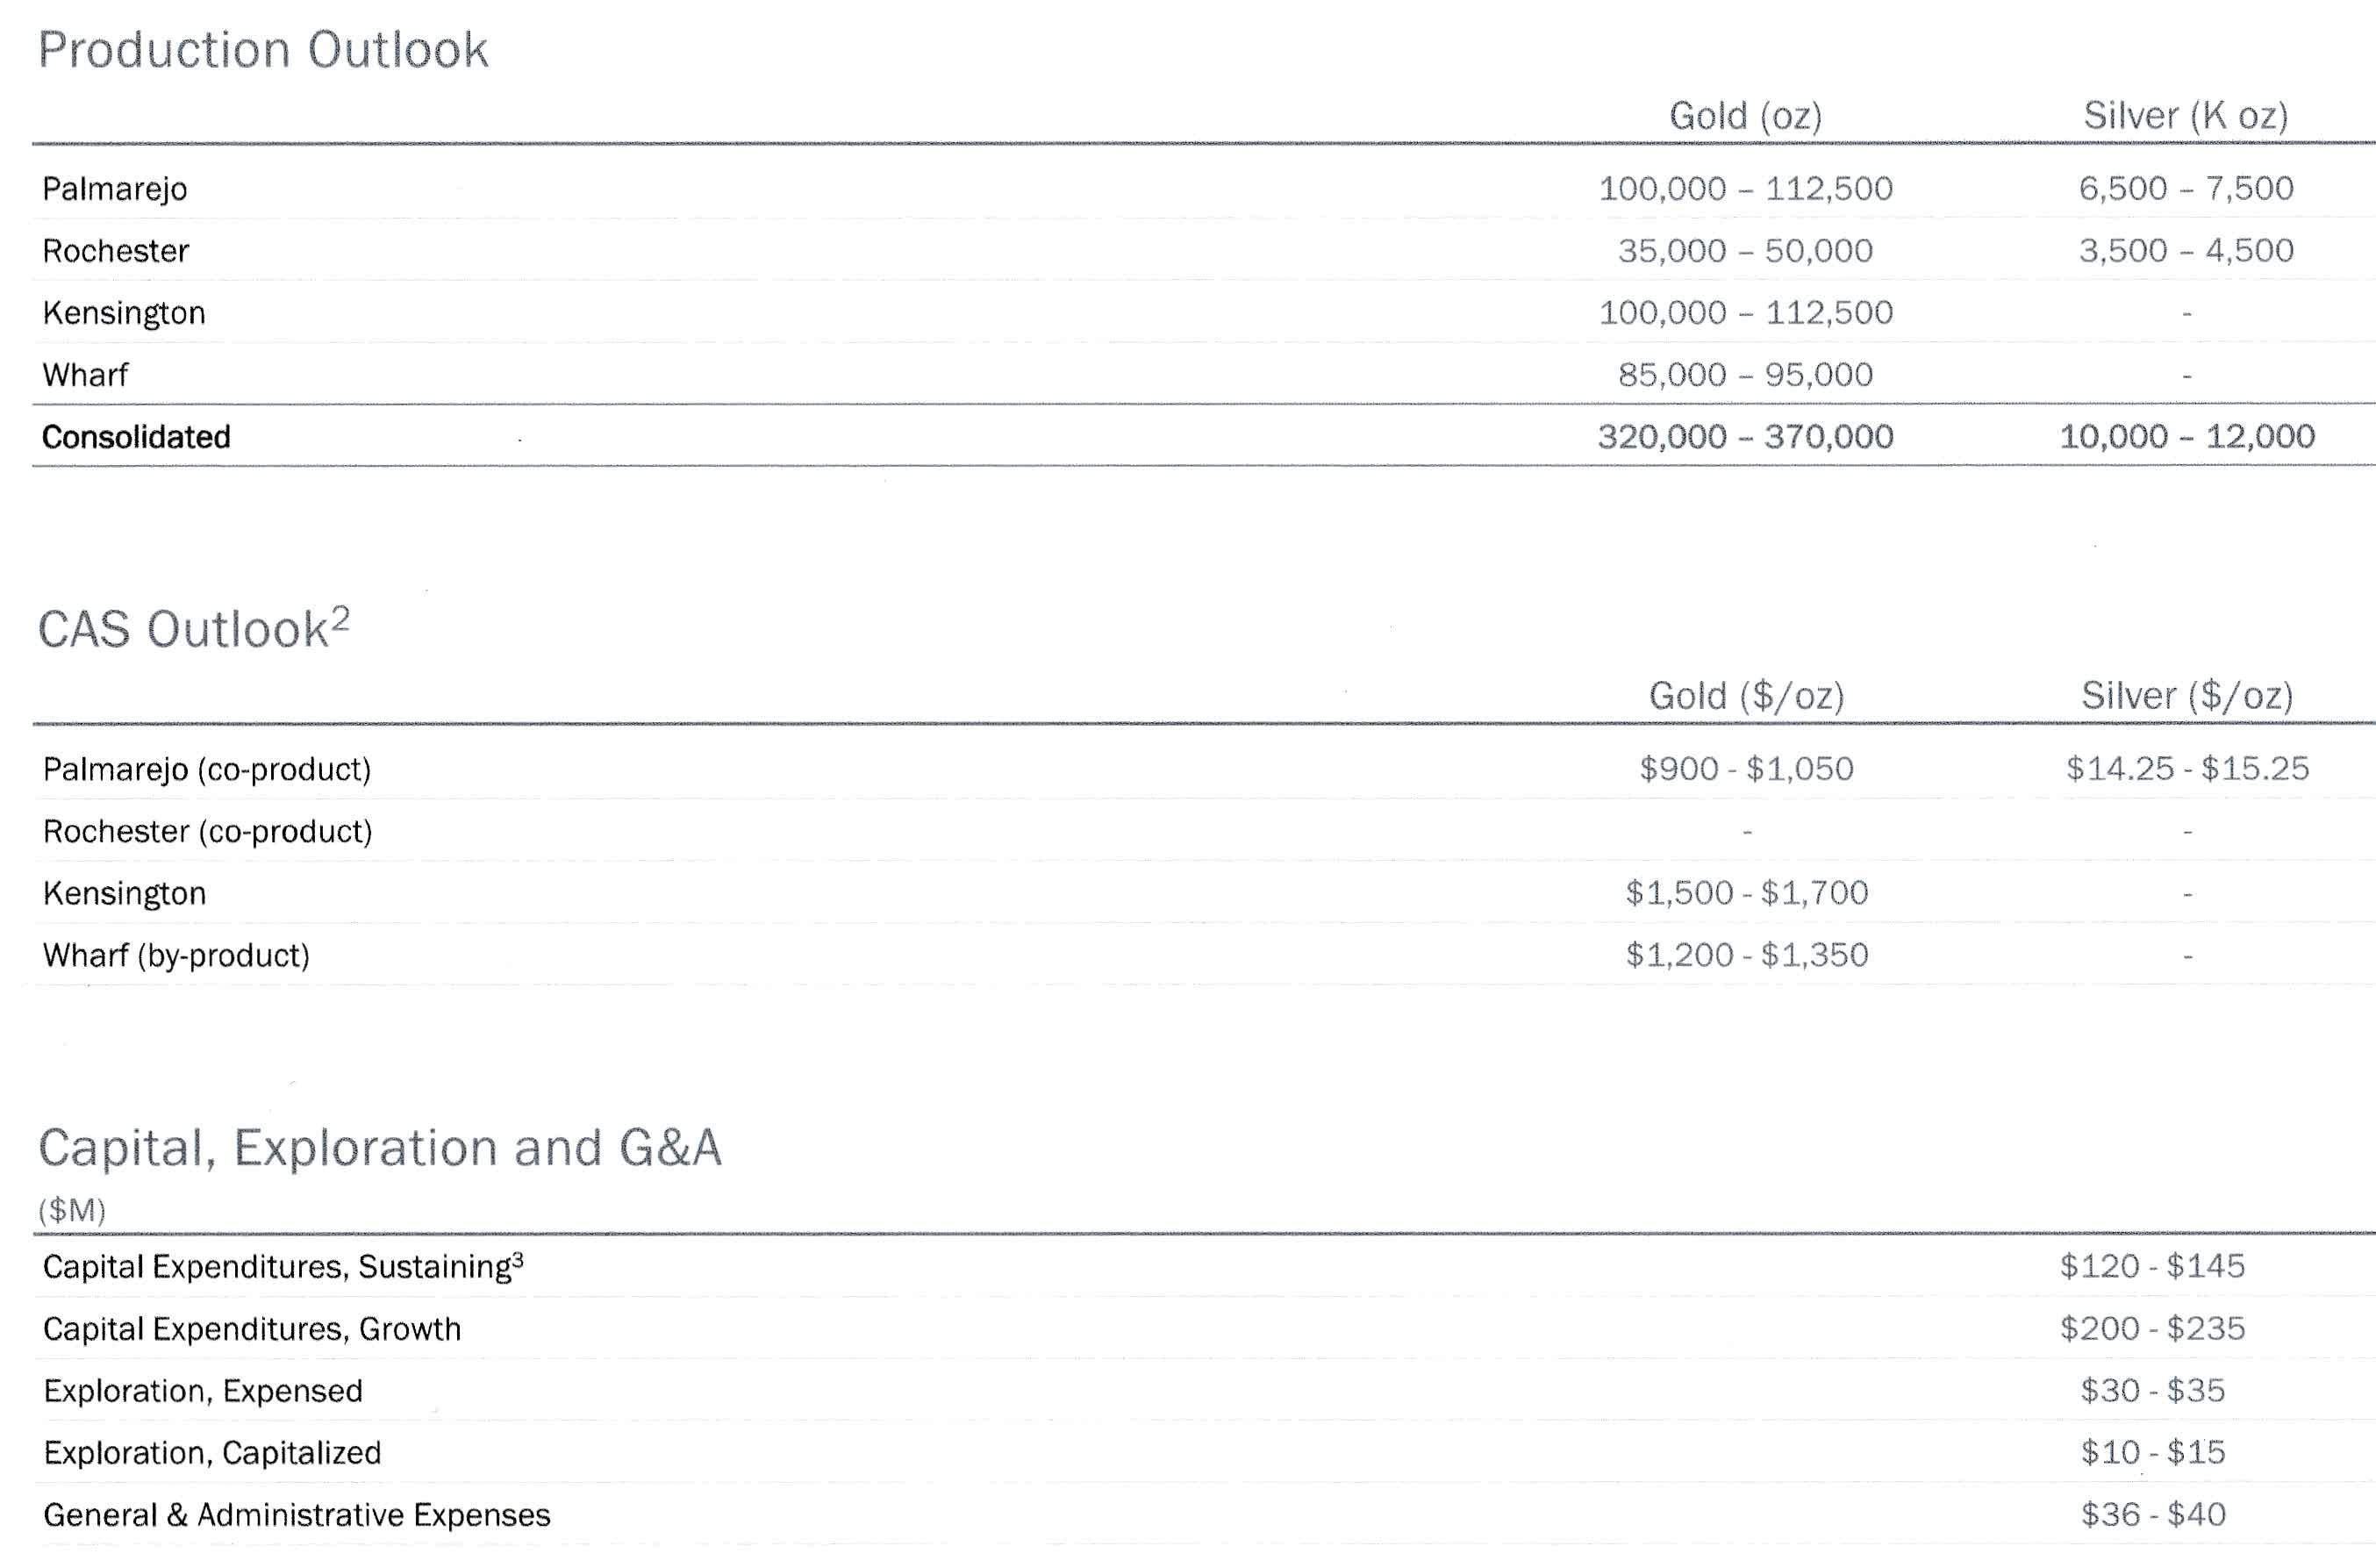
4 - 2023 outlook - Unchanged
In 2023, Coeur Mining, Inc.'s gold production is expected to be between 320K-370K oz, while silver production is between 10 And 12 Moz.
CDE 2023 Guidance (CDE Presentation)
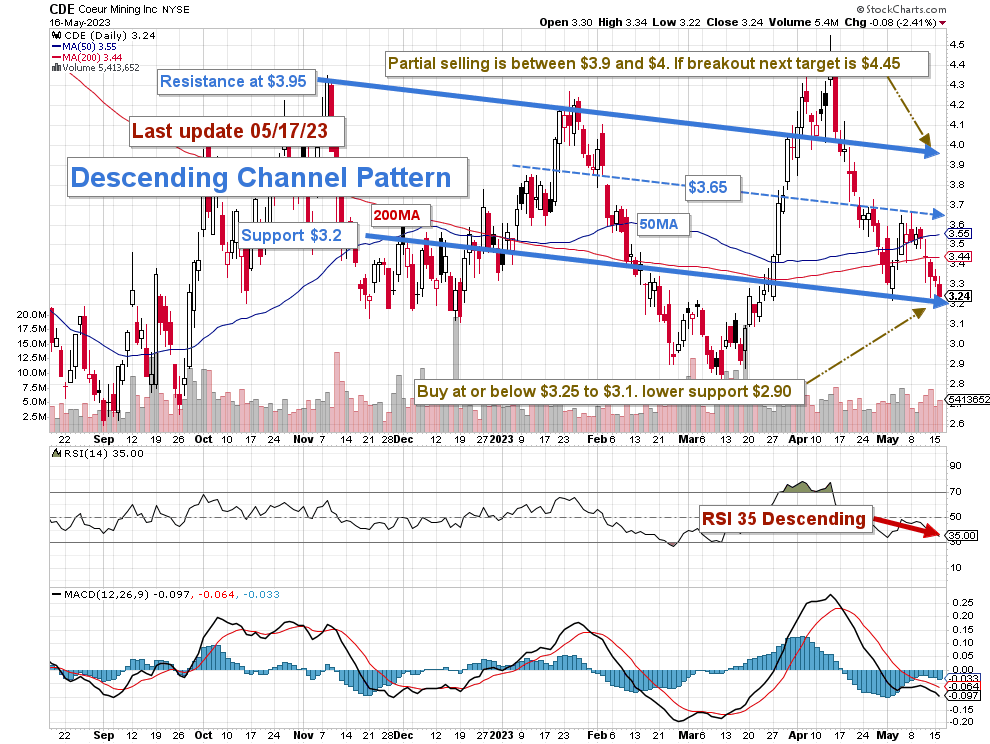
Technical Analysis And Commentary
CDE TA Chart short-term (Fun Trading StockCharts)
CDE forms a descending channel pattern, with resistance at $3.95 and support at $3.20. RSI is now 35 and close to showing an oversold situation, a buy signal.
Descending channel patterns are short-term bearish in that a stock moves lower within a descending channel, but they often form within longer-term uptrends as continuation patterns. The descending channel pattern is often followed by higher prices, but only after an upside penetration of the upper trend line.
The trading strategy is to sell about 40%-50% of your position LIFO and keep a core long-term position for a higher target of around $6 to $6.50.
I suggest taking profits LIFO between $3.90 and $4 with possible higher resistance at $4.45 and waiting patiently for a retracement between $3.25 and $3.10 with lower support at $2.90 to accumulate again.
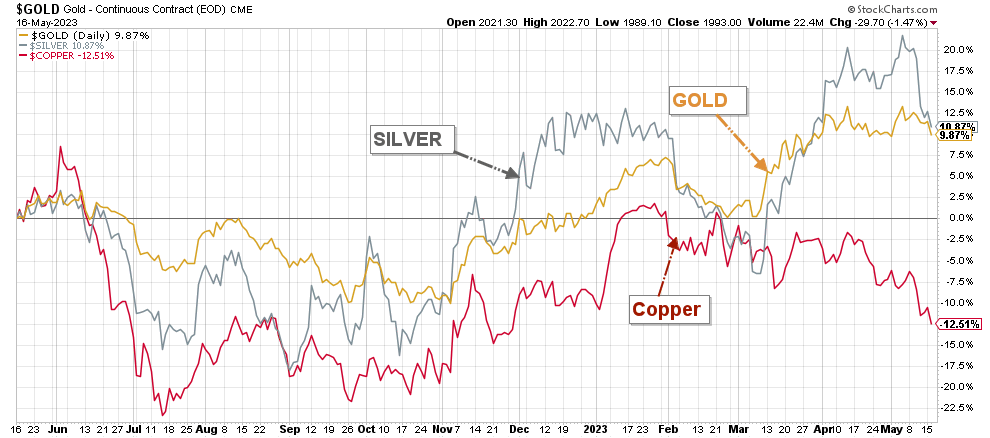
Gold and Silver are helping the bottom line.
CDE 1-Year Chart gold, silver, copper (Fun Trading StockCharts)
Thus, be cautious and watch the gold and silver prices like a hawk.
Warning: The TA chart must be updated frequently to be relevant. It is what I am doing in my stock tracker. The chart above has a possible validity of about a week. Remember, the TA chart is a tool only to help you adopt the right strategy. It is not a way to foresee the future. No one and nothing can.
For further details see:
Coeur Mining: We Need A Lot Of Patience With This One (Rating Upgrade)