CBAUF - CommBank Australia: Headed Down Under (Technical Analysis)
2023-07-11 14:07:01 ET
Summary
- The stock price has reached an important swing high and needs time to consolidate. We discuss the most likely path forward.
- What are the specific price levels we are able to project for this correction?
- What would tell us to shift our stance?
By Levi at Elliott Wave Trader, produced with Avi Gilburt
There's an ebb and flow to all waves. It's simply the nature of the tides. Life is movement, forward and back, ever shifting. Humans have learned to predict the tides down to the minute with what would seem to be surprising accuracy. The tides are repeating patterns again and again. This repeating pattern is highly reliable and therefore provides predictability.
First We Skip To The End
Let's first discuss how this same type of repeating pattern can help us identify a high-probability setup in the CommBank Of Australia ( CBAUF ) stock price. Then, we will point out specific price levels that we will look for going forward as the correction unfolds. Finally, what would cause us to shift our stance should our primary expectation not play out as illustrated?
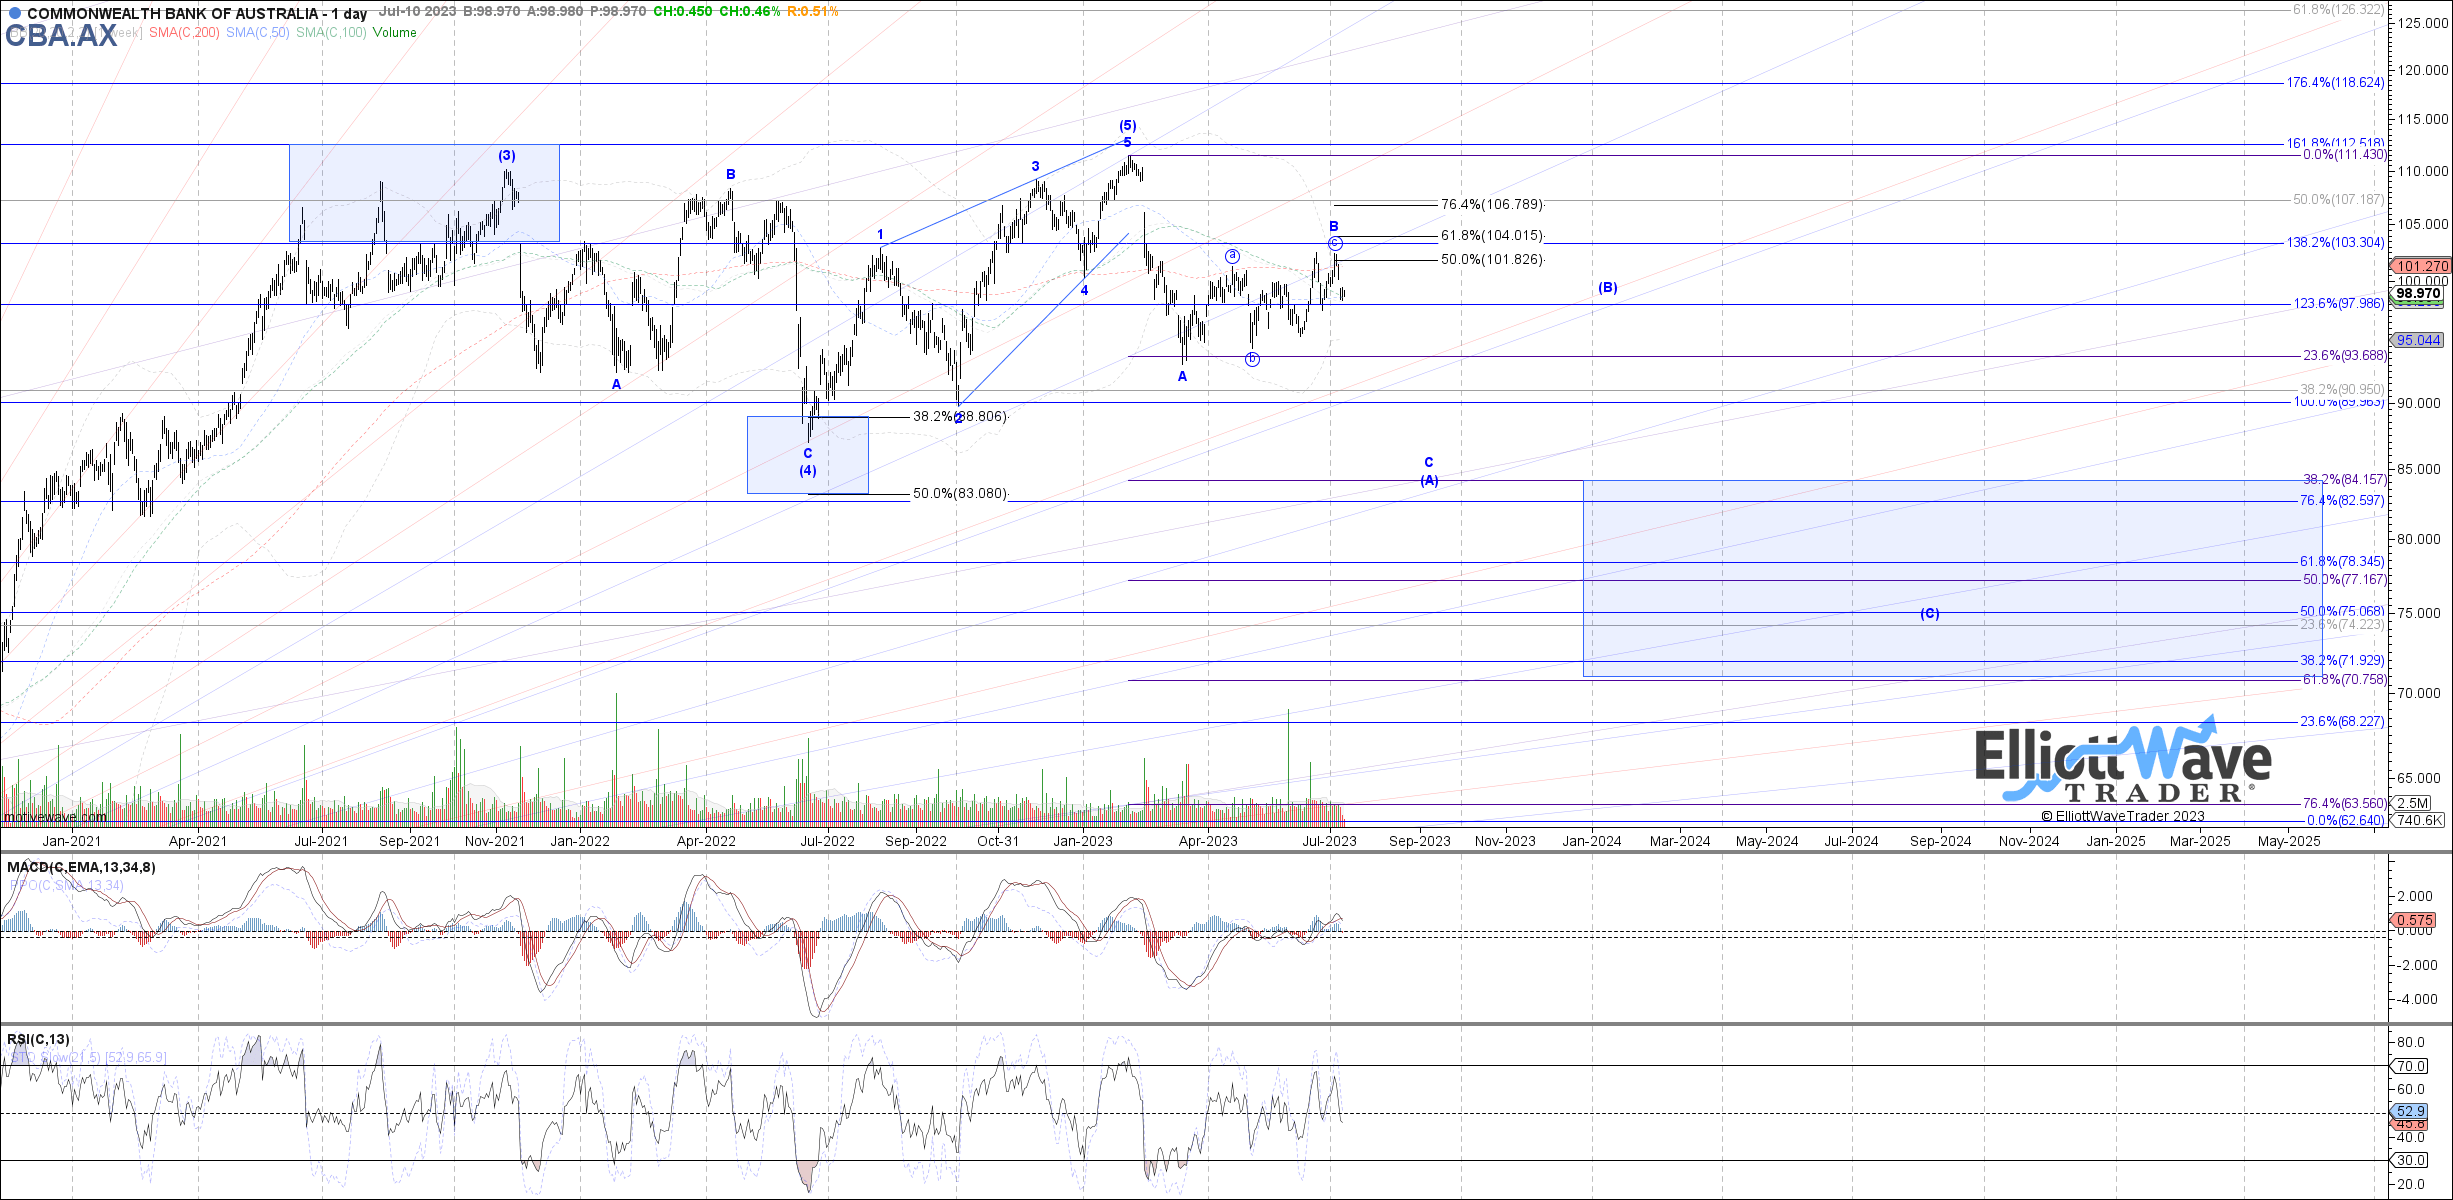
The latest chart from Garrett Patten shows that price retested the June high and has since turned down from there. The first step toward confirming that the 'B' wave high is in place would be a sustained move below 97.40 and fully confirmed below 95.25. Until then, this could be a wider flat for a smaller fourth wave and there could be one more slightly higher high to go in this B wave corrective bounce to as high as 104.
Risk : The 103-104 area is strong resistance. Should price give way to higher highs, then it likely tests the recent highs at 111. However, we find that to be a much less probable outcome given the overlapping nature of the current bounce from the low at 93.
The most probable path we are able to identify is as shown in the above chart. Note that the initial 'A' wave down from the 111 high struck at the .236 retrace of the larger rally structure. This is a typical target and reinforces the projection for the next 'C' wave of the larger [A] wave down to the 84 region.
While the projected low at 84 could be all of the correction, it would be the structure of the bounce from 84 that would tell us if that is indeed the case. Should the bounce again be corrective and overlapping, then it would strongly suggest the path shown that illustrates another larger degree [B] wave bounce before a final low, perhaps in the 75 region.
How Do We Arrive At These Projections?
It was back about five years ago that Avi Gilburt wrote a six-part series of articles entitled, "This Analysis Will Change The Way You Invest Forever" (see part 1 here ). Here are a few excerpts from that piece:
"In 2011, I began writing for Seeking Alpha, and quickly encountered a major challenge. I realized that writing about technical analysis on a fundamental analysis website was not going to be easy.
While those that initially read my articles were quite skeptical (and that is probably being kind), as Seeking Alpha readers began to see the accuracy in my analysis, I started to gain a following. It was not long until I was the number one followed metals analyst on Seeking Alpha, and have basically remained in that position for the great majority of the seven years I have been writing on Seeking Alpha.
Back in the 1930s, an accountant named Ralph Nelson Elliott identified behavioral patterns within the stock market which represented the larger collective behavioral patterns of society en masse. And, in 1940, Elliott publicly tied the movements of human behavior to the natural law represented through Fibonacci mathematics.
Elliott understood that financial markets provide us with a representation of the overall mood or psychology of the masses. And he also understood that markets are fractal in nature. That means they are variably self-similar at different degrees of trend.
Most specifically, Elliott theorized that public sentiment and mass psychology move in 5 waves within a primary trend, and 3 waves within a counter-trend. Once a 5 wave move in public sentiment has completed, then it is time for the subconscious sentiment of the public to shift in the opposite direction, which is simply the natural cycle within the human psyche, and not the operative effect of some form of 'news'.
This mass form of progression and regression seems to be hardwired deep within the psyche of all living creatures, and that is what we have come to know today as the 'herding principle,' which gives this theory its ultimate power."
Follow The Power Of The Tides
We have a clear 5 wave structure up into the 111 high for CommBank stock. From that high, we now anticipate a 3 wave corrective pattern to unfold. It is still quite early in that anticipated correction. There are several twists and turns that will manifest themselves in this consolidation.
The basic structure should be a move down to the .382 retracement level at 85. Then a bounce in the larger [B] wave to perhaps 98 and a final move to complete the correction at 75.
There are many ways to analyze and track stocks and the market they form. Some are more consistent than others. For us, this method has proved the most reliable and keeps us on the right side of the trade much more often than not. Nothing is perfect in this world, but for those looking to open their eyes to a new universe of trading and investing, why not consider studying this further? It may just be one of the most illuminating projects you undertake.
(Housekeeping Matters)
If you would like notifications as to when our new articles are published, please hit the button at the bottom of the page to "Follow" us.
For further details see:
CommBank Australia: Headed Down Under (Technical Analysis)