SCHQ - Condensing Complex Macro Readings Into One Number For Rates
2023-06-08 15:50:00 ET
Summary
- US macro data suggests rates should be around 6%, supporting the Fed's current position above 5%.
- The 10-year Treasury yield remains low, suggesting residual upward pressure on market rates.
- Despite some factors pointing to lower rates, further upward pressure on market rates is expected in the near term.
By Padhraic Garvey , CFA, Regional Head of Research, Americas
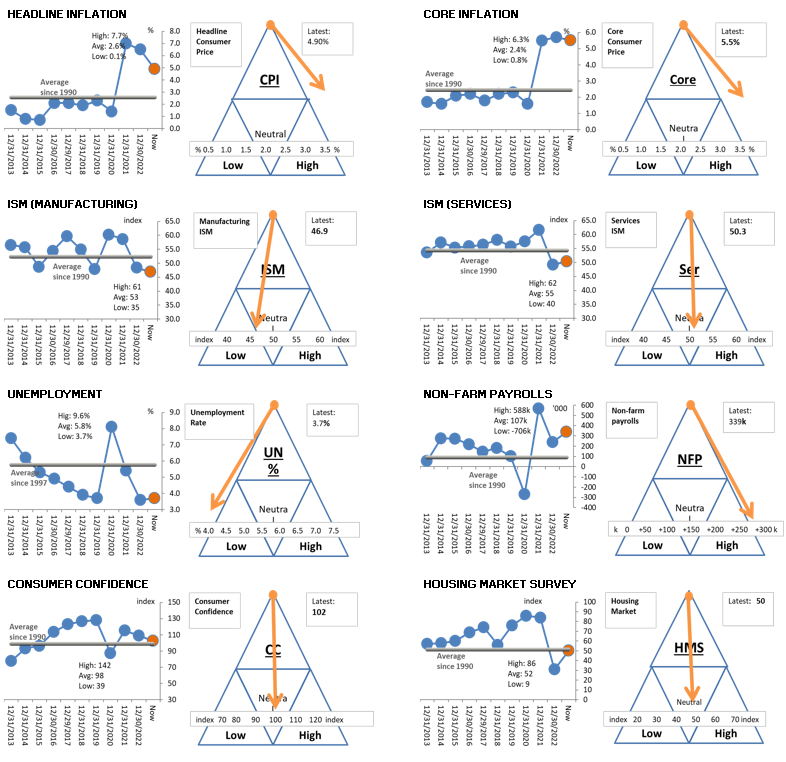
Some US macro numbers are pointing in dramatically different directions right now. Witness the stark juxtaposition between strong ongoing payrolls growth versus manufacturing and services surveys entering recessionary territory (low 40s for some components of the manufacturing PMI). And on the inflation front, while there is evidence of more subdued pipeline pressure, core inflation remains elevated (in the area of 5%).
To help assess where we are in terms of rates pressure, we employ a simple model that aggregates the macro arrows pointing in different directions to a single outcome for rates. For example, readings on consumer price inflation are off the charts, as are readings on the labour market. In contrast, PMIs are more in tune with a material slowdown, and in fact point to a recessionary tendency. Then we have the housing market, that had looked like it was about to implode lower, but has been fighting back of late. And then we have consumer confidence, which continues to hold up. It's off the highs, but refuses to materially lie down.
Pendulum Analysis - contrast in macro arrows
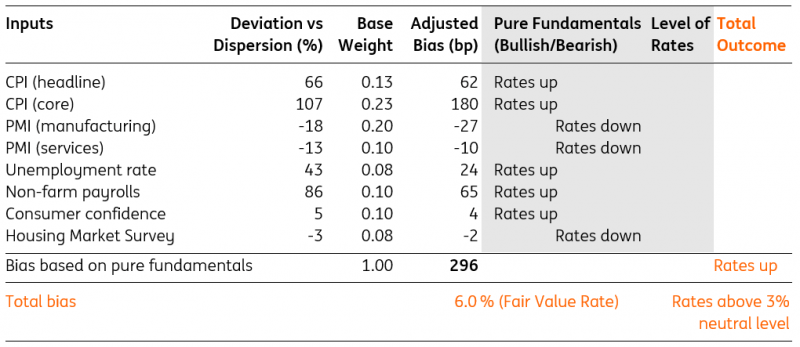
We input all of these factors into our model where we look at how our selected variables deviate from normal, apply weights to each component, and then aggregate that to a deviation from normal for rates.
The outcome of this process is a single number, and that number is 3%. What does this mean? It tells us that based on contemporaneous circumstances, rates should be about 3% above normal.
And what's normal? We think 3%, based on a neutral real rate of 0.5% to 0.75% and inflation of 2.25-2.50%. So we take our 3% neutral rate and add our 3% deviation above normal to that, to get 6%.
How do we interpret this? It suggests that based on where macro circumstances are right now, rates should be around 6%. This supports the Fed being above 5% currently.
Our Fair Value US Rates Model based on latest macro data
And, by the way, our model for the eurozone has a deviation above normal now of 1.9%. Adding that to a neutral rate of 2% (zero real rate) sums to 3.9%. Effectively, this points to the 4% area as the level that eurozone rates could or should be referenced against.
Our Fair Value Eurozone Rates Model based on latest macro data
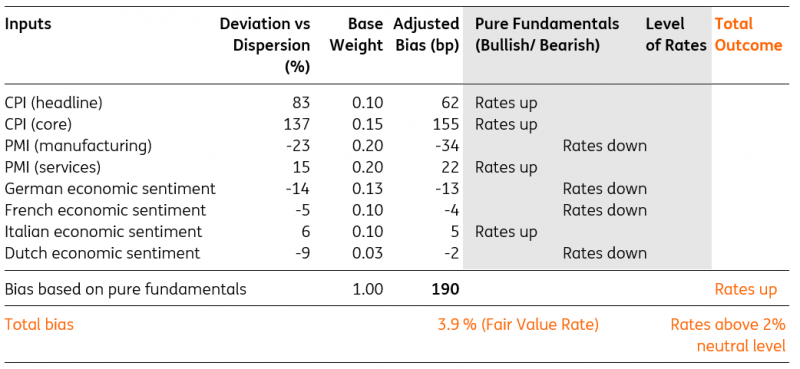
Back in the US, the fed funds rate at 5.25% is still below 6%. But bear in mind that the Fed has 2.5% as its implied neutral rate. So that, plus the 3% deviation from normal, gives 5.5%. In that respect, the Fed is already there or thereabouts in terms of tightening requirements (from their perspective). But the 10yr Treasury rate remains low in relative terms. The highest yield hit in this cycle was 4.5% in the fourth quarter of 2022, and again briefly it got to that area in March this year (just prior to the Silicon Valley Bank collapse). The suggestion is the US 10yr never really got to the heights that it should have during this cycle.
We are not suggesting that the 10yr yield needs to get to 6%. But we are pointing to the fact that it never did hit anything near that level. Also, we are noting that it remains well below that level, even as many indicators are pointing to a degree of macro stubbornness to slow down enough to help kill off inflation. So there is a net risk here for residual upward pressure on market rates.
None of this factors in forecasts for the future, market discounts, the impact of recent banking angst in the US, or the tightening in lending standards for example. These factors generally pull lower on the headline rates identified here, or in due course argue for lower rates in the future. Hence, the curve inversions seen. Still, degrees of inversion can still be referenced within a framework that identifies long-run neutral rates and a current rationale for deviation from them.
While there are some good reasons to expect market rates to fall (weak PMIs for example), our preferred expectation from here is to see some further upward pressure on market rates first. The 4% area for the 10yr Treasury yield for example remains a generic target that could well be hit in the coming month or so. And higher would not look wrong, in the near term. That does not affect our medium-term view, which still sees 3% as the trough level to aim for on the US 10yr, by the end of 2023 and into 2024.
Content Disclaimer:
This publication has been prepared by ING solely for information purposes irrespective of a particular user's means, financial situation or investment objectives. The information does not constitute investment recommendation, and nor is it investment, legal or tax advice or an offer or solicitation to purchase or sell any financial instrument. Read more.
Editor's Note: The summary bullets for this article were chosen by Seeking Alpha editors.
For further details see:
Condensing Complex Macro Readings Into One Number For Rates