CSTM - Constellium: Fundamental Issues Coupled With No Margin Of Safety
2023-05-19 09:46:09 ET
Summary
- Constellium's 6.8% CAGR in revenue over the past 10 years hides the low shipment growth. Its growth in selling price was also very much lower than that of aluminum.
- CSTM is a cyclical company, and any analysis and valuation should be based on its performance over the cycle.
- On such a basis, there is no margin of safety. I also have concerns about its profitability and financial strength. As such, this is not an investment opportunity.
Investment thesis
Constellium SE (CSTM) is a global aluminum company that IPOed in 2013. It had a challenging performance during the first few years. But the past few years' results seem to suggest that it has turned around.
But CSTM is a cyclical company. It should be analyzed and valued based on its performance over the cycle. On such a basis, I found that there is no margin of safety. I also have concerns about its profitability and financial strength. I would not invest in CSTM.
Thrust of my analysis
CSTM is a global leader in the development, manufacture, and sale of a broad range of highly engineered, value-added specialty rolled and extruded aluminum products. Its customers cover the packaging, aerospace, automotive, other transportation, and industrial end-markets.
The company has 3 major business segments with major operations and markets in Europe and North America.
To project the business performance, management would probably start with each segment-region. Next, they would sum up all the various business segment-region performances.
But as an outsider, it would be very challenging to forecast on such a basis. I thus had to develop a business model that takes a macro perspective.
I found that there was a 0.74 correlation between CSTM selling price per ton and the LME aluminum price. I then developed a linear regression equation for the selling price per ton with the LME aluminum price as the independent variable.
CSTM is also a cyclical company. As such any analysis and valuation of the company should be based on its performance over the cycle.
On such a basis and using my regression equation, I found that there is no margin of safety at the current price.
Background
The company was formed to acquire several affiliates of Rio Tinto in 2011 and IPO on the NYSE in 2013. As such my analysis starts from 2013.
The company has 3 major business segments:
- Packaging & Automotive Rolled Products (P&ARP). This includes the production of rolled aluminum products in Europe and North America. This segment supplies the packaging market with can stock and closure stock for the F&B sector.
- Aerospace & Transportation (A&T). This includes the production of rolled aluminum products and very limited volumes of extruded products in Europe and North America.
- Automotive Structures & Industry (AS&I). This includes the production of extruded aluminum products and aluminum structural components. The segment focuses on the automotive industry in Europe, North America, and China.
You can see that CSTM is a global aluminum company. Since its IPO, not only has the product profile changed, but there were also changes in the regions it serves. Charts 1 and 2 illustrate my point.
- The biggest growth came from the P&ARP segment.
- From a regional perspective, the major growth was in Germany and the US.
Chart 1: Segment Revenue (Author) Chart 2: Revenue by Regions (Author)
Each segment is driven by different business factors. Also, the business conditions in one region will be different from those in another region.
To get an accurate picture of the company you have to analyze the performance of each segment by region and build up the picture from there. As an outsider, there is not enough information to do this. I had to find another way to project the business performance.
I found the following correlations with the LME aluminum prices that were extracted from CSTM Form 20-F.
- 0.93 correlation with revenue.
- 0.74 correlation with revenue per ton. The revenue per ton was derived by dividing the revenue for each year with the corresponding shipment volume. It represents the average selling price per ton.
One possible explanation for the different correlations is that the shipment volume is not linked to the LME prices. You should not be surprised by this as customer demand is driven by other factors than just the aluminum price.
CSTM revenue is driven by not only LME prices but also regional premiums and value-added margins. At the same time, there are also different shipment volumes for each of the segments.
Despite these, somehow the changes in LME prices accounted for about 55% of the selling price per ton changes. This meant that I could model CSTM's performance based on its shipment volume and unit selling price.
- The shipment volume would be one input. I would have to consider customer demand and production capacity for this.
- The unit selling price is another input. But this is pegged to the LME aluminum price.
By separating the shipment volume and unit selling price, I would be able to carry out a more in-depth "what-if" analysis.
Performance
I considered 3 metrics when looking at CSTM performance - revenue, PAT, and Gross Profitability (Gross Profits / Total Assets). Refer to Chart 3.
Chart 3: Performance Index (Author)
Notes to Chart 3.
a) To be able to plot all the 3 metrics onto one chart, I converted them into indices.
b) The index for a particular year is obtained by dividing the value for the year by the respective 2013 value.
c) The drop in the 2015 PAT was due to a one-off write-down for the Wise assets.
I would not consider CSTM's performance as good.
Revenue grew at 6.8% CAGR from 2013 to 2022. But shipment volume grew at 4.9% CAGR while the average selling price per ton grew at 1.8% CAGR.
But there are problems with these growths.
- The shipment growth was affected by the Wise acquisition in 2015. There was a jump in shipment volume in 2015 because of this. The post-Wise shipment growth from 2015 to 2022 was only 1.0 % CAGR.
- From 2013 to 2022, the LME aluminum price grew at 7.0 % CAGR. This is much higher than the CAGR of CSTM average selling price per ton of 1.8 %.
The result is a decline in the Gross Profit margins. This averaged 13.4 % for 2013/14 compared to 9.6 % in 2021/22. The impact can be seen in the PAT and Gross Profitability.
- Over the past 10 years, there were 4 years with losses.
- Gross Profitability had declined from the 2013 level and is today still lower than that in 2013.
According to Professor Novy-Marx, Gross Profitability has the same power as PBV in predicting cross-section returns. The Gross Profitability trend in Chart 3 does not augur well for the stock. I would have preferred an uptrend for this metric.
Financial position
I also have concerns about CSTM's financial position.
Its Debt Equity as of the end of Dec 2022 ratio is 2.7. This is high when you look at the peer ratios. Refer to Table 1.
This is probably because CSTM is not well capitalized as can be seen from its Leverage in Table 1. You can see that CSTM's Leverage is an outlier compared to its peers.
Table 1: Peer Financial Performance (Author)
Notes to Table 1:
a) Leverage = Total assets/Total equity.
b) Int coverage = EBIT/interest expense.
At the same time, its interest coverage ratio is low and is in the same range as the other aluminum companies (CENX and KALU) that I had concerns with. Refer to my other Seeking Alpha articles:
- Kaiser Aluminum: The Metal Price Neutral Approach Is Not Working Fully
- Century Aluminum Is Not A Growth Stock
The positive sign is that over the past 10 years, CSTM had been able to generate positive cash flow from operations every year. However, the total amount generated at USD 3.0 b was lower than the total USD 3.2 b cash flow used for investments.
Cyclical sector
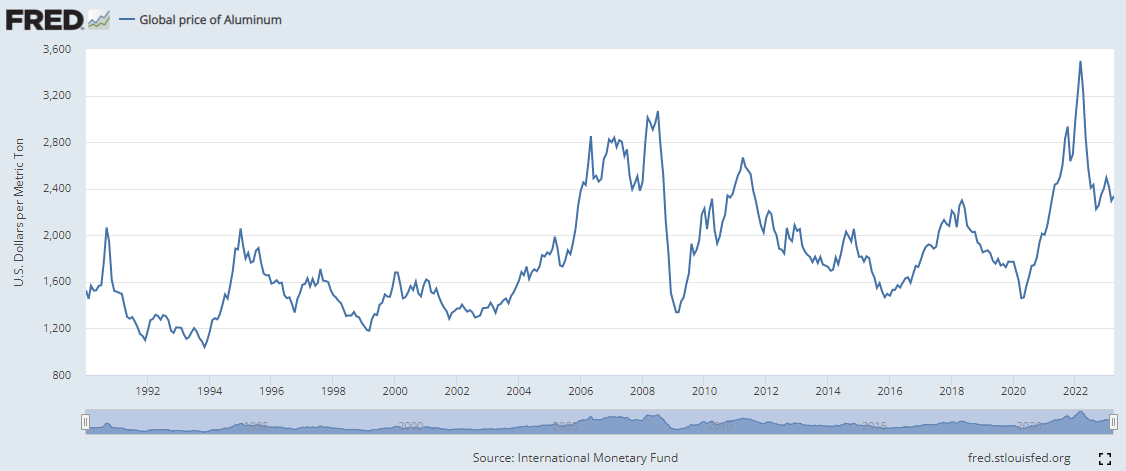
The aluminum sector is cyclical. Chart 4 illustrates this. You can see that while cyclical, there is a long-term price uptrend. But this was not a fantastic growth rate. From Jan 1990 to Jan 2023, prices grew at 2.3 % CAGR.
You can also see that from 2013 to 2022, there were about 2 price cycles. Taking the average values over this period can represent the cyclical values.
Chart 4: Aluminum Prices (FRED)
Valuation of cyclical companies
Damodaran opined that the value of cyclical companies is often more dependent on the movement of the commodity price than on firm-specific characteristics. Valuing such companies based on their current earnings can lead to a misleading picture.
We should thus look at the "normalized" earnings over the cycle. Damodaran has suggested several ways to do this.
The first is to take a simple average of the earnings over the cycle. But if the company has grown over the years, this method will not reflect its bigger size. We have this situation with CSTM due to the WISE acquisition in 2015.
The other way is to take the current shipment volume and multiply it by the average selling price per ton over the cycle. This will give the normalized revenue. You next multiply this by the average margins over the cycle to derive the normalized earnings. This is what I did for CSTM.
Valuation
I valued CSTM using the single-state Free Cash Flow (FCFF) to the firm model.
I focused on 2 scenarios.
- Scenario 1 - 2022 shipment volume with the 2013 to 2022 average LME aluminum prices.
- Scenario 2 - max capacity shipment with the 2013 to 2022 average LME aluminum prices.
On an overall basis, the 2022 shipment is about 89 % of the production capacity. As such I consider Scenario 1 more realistic.
Table 2 summarizes the results.
You can see that there is no margin of safety from a cyclical perspective. To match the market price of the stock, the cycle LME price has to be 50% higher than the past 10 years' average. Is this realistic? If you look at Chart 4, you will see that this is not realistic.
Table 2: Summary of Valuation (Author)
A sensitivity analysis showed the CSTM problem is not about its shipment volume since there is no margin of safety at full capacity. It is also not about growth. Rather it is about the Gross Profit margins. Under scenario 1, you could match the market price if the Gross Profit margin in my valuation model was increased by 25%.
You should not be surprised since the Gross Profit margin has been declining since its IPO days. I have not dug deeper to see which product or region contributed to the decline. This is a story for another day. But I was surprised not to see more management focus on this in its 2022 Form 20-F or the latest quarterly presentation.
Valuation model
I valued CSTM based on the single-stage Free Cash Flow to the Firm (FCFF) model.
Value of the operating assets of the firm = FCFF X (1 + g) / (WACC - g)
Where:
FCFF = EBIT X (1 - t) X (1 - Reinvestment rate).
EBIT = Gross Profits - Selling, General & Admin charges - Depreciation & Amortization - Other Operating expenses.
g = growth rate. I assumed that this was 1.0 % as per the post-Wise shipment volume organic growth rate. This is the fundamental growth rate = Return X Reinvestment rate.
t = average 2013 to 2022 tax rate of 39%.
Return = EBIT(1-t) / Total Capital Employed.
Total Capital Employed or TCE = Total Equity + Debt - Cash
I then derived the Reinvestment rate from the fundamental growth rate.
WACC = weighted average cost of capital derived from the first page of a Google search for the term "CSTM WACC" as summarized in Table 3.
Value of Equity = value of operating assets of the firm + Cash - Minority Interests - Debt.
Table 3: WACC (Various)
Gross profits
My valuation model hinges on deriving the Gross Profits.
Gross Profits = Revenue X Gross Profit margin.
Revenue = Shipment volume X Average selling price per ton.
Using the data from 2013 to 2022, I used the EXCEL to developed the following linear regression equation for the average selling price:
Average selling price per ton = (1.1024 X LME Aluminum price) + 2406.9.
The LME price was the average price for the year extracted from CSTM Form 20-F.
Table 4 shows a sample calculation and the other assumptions used.
Table 4: Sample calculation of intrinsic value (Author)
Notes to Table 4.
- SGA = Selling, General & Admin charges
- D&A = Depreciation & Amortization
Risks and limitations
The crux of my valuation is that the CSTM's business is cyclical. If you use the current LME prices for the cyclical portion, you would not be following Damodaran.
Having said that, you should consider the following when looking at my valuation:
- Non-cyclical WACC.
- Low growth.
- Small data points
The WACC I used was based on the current situation of high inflation, a possible recession, and the Ukraine invasion. If I am going to value the company over the cycle, you could argue that I should use the cyclical WACC. The risk-free rates and the equity risk premiums would probably be lower. This meant that my valuation is on the high side.
I had shown that CSTM had 1% shipment growth. Also, the long-term aluminum price growth was only 2.3 % CAGR. And I have shown that CSTM failed to benefit from this price growth. With such low growth, it would be more appropriate to value CSTM based on the Earnings Power Value. This is USD 5 per share under scenario 1. Again, there is no margin of safety.
Finally, I had only 10 years of data points to develop my regression equation. With an R2 of 0.55, the LME aluminum prices only account for slightly more than half of the changes in the unit selling price. A better model should have a higher R2 value. However, given the vast difference between the intrinsic value and the market price, I would not worry too much about the missing half.
Conclusion
There are two challenges with CSTM.
Firstly, it does not seem to be a fundamentally strong company. I have concerns about its profitability as well as its financial strength. The company would have to address its Gross Profit margins, capital structure and other operating efficiency issues to resolve the concerns.
Secondly, a valuation based on its performance over the aluminum price cycle did not provide any margin of safety. I fail to see how this can be improved without a greater focus on Gross Profit margins. It is not a customer shipment or long-term demand issue.
I am a long-term value investor holding onto stocks for 6 to 8 years. As such I look at the long-term prospects of the company. You can understand why I focused on the cyclical performance and would not pick CSTM.
For further details see:
Constellium: Fundamental Issues Coupled With No Margin Of Safety