CMRE - Costamare: A Complex Yet Promising Long-Term Hold
2023-10-18 11:43:09 ET
Summary
- Costamare Inc. demonstrates shareholder value through share repurchases and dividend declarations, indicating a positive outlook and income diversification strategy.
- Investors should be cautious of potential market oversupply and the company's refinancing activities, which could impact charter rates and debt levels.
- Despite robust revenue growth, there is a concerning decline in net income and questionable earnings quality, suggesting a cautious investment approach and a Hold rating.
Investment Thesis
Costamare Inc. ( CMRE ) presents a complex but promising investment landscape, making it suitable for a 'Hold' recommendation for long-term investors. The company has demonstrated shareholder value through its repurchase of 5,385,492 common shares for $50 million and a dividend declaration of $0.115 per share. Its leasing transactions valued at $120 million and a $200 million investment in the dry bulk sector indicate a positive outlook and an income diversification strategy. The company has further hedged its market position by securing 56 dry bulk vessels on period charters through its subsidiary, Costamare Bulkers Inc. ((CBI)).
However, investors should heed the company's 'Order Book,' which flags a potential market oversupply that could depress charter rates.
The financial forecast data, backed by multiple analysts, suggests a generally positive outlook for the company's revenue and earnings per share for the period ending September 30, 2023. The median and average forecasts for both metrics are optimistic, although the range in EPS forecasts indicates that there's less consensus on the company's profitability.
Overview
In Q2 2023, Costamare Inc. reported a Net Income of $63.2 million ($0.52 per share) and an Adjusted Net Income of $68.6 million ($0.56 per share), both underlining its profitability. These earnings are complemented by a strong liquidity position of $1,059 million, which not only signifies operational flexibility but also the capacity to meet short-term obligations.
The company has a diversified business model, operating in both the container ship and dry bulk sectors. It has strategically invested $200 million in its dry bulk operations, signaling a long-term commitment to capitalize on future market improvements. Additionally, Neptune Maritime Leasing, a subsidiary, has successfully concluded leasing transactions worth $120 million, adding another revenue stream. The company has also executed a share buyback program, purchasing $15 million worth of its own shares, which often indicates the belief that the stock is undervalued and has higher growth potential.
To underline the confidence in its intrinsic value, Costamare repurchased 5,385,492 common shares for $50 million and still maintains a reserve of $40 million for common shares and $150 million for preferred shares. As for dividends, the company has declared a dividend of $0.115 per share on common stock.
On the operational side, the company has expanded its fleet to 56 ships, giving it greater negotiating power for better rates and margins. Furthermore, it has 56 period vessels on index-linked charter agreements, offering a more stable and diversified income stream. While the container ship sector shows softening rates, they remain at profitable levels. The dry bulk sector is set for a potential recovery in the third and fourth quarters of 2023.
Given the high liquidity and net income, the company is financially stable and can make long-term investments or change strategies if market conditions shift. The strategic investments in dry bulk and share buybacks point to competent management. The company itself advises a cautious, step-by-step approach to growth, particularly because of market volatility. Therefore, its $200 million investment in dry bulk seems well-placed for long-term gains, provided market conditions improve.
On the risk side, the company's "Order Book" presents a potential threat of market oversupply, which could negatively impact charter rates. Additionally, Costamare has refinanced existing debt to the tune of $176 million, of which $84 million is allocated for future acquisitions, warranting close monitoring. Contracted revenues for the company's containership fleet stand at approximately $2.9 billion for 2023, with a TEU-weighted duration of 3.9 years, indicating long-term revenue stability. Thus, market volatility in both sectors and the looming "order book," which threatens to flood the market with excess shipping capacity, are risks that could affect revenue.
Costamare's high liquidity and net income validate its financial health; inductively, the investments in dry bulk and leasing imply a focus on diversifying income streams; and abductively, the share repurchase suggests that the company perceives its shares as undervalued. Therefore, based on these solid financial numbers and business logic, Costamare appears to be a promising long-term investment, albeit with advisories on monitoring the order book and debt levels.
Revenue Analysis
Author analysis
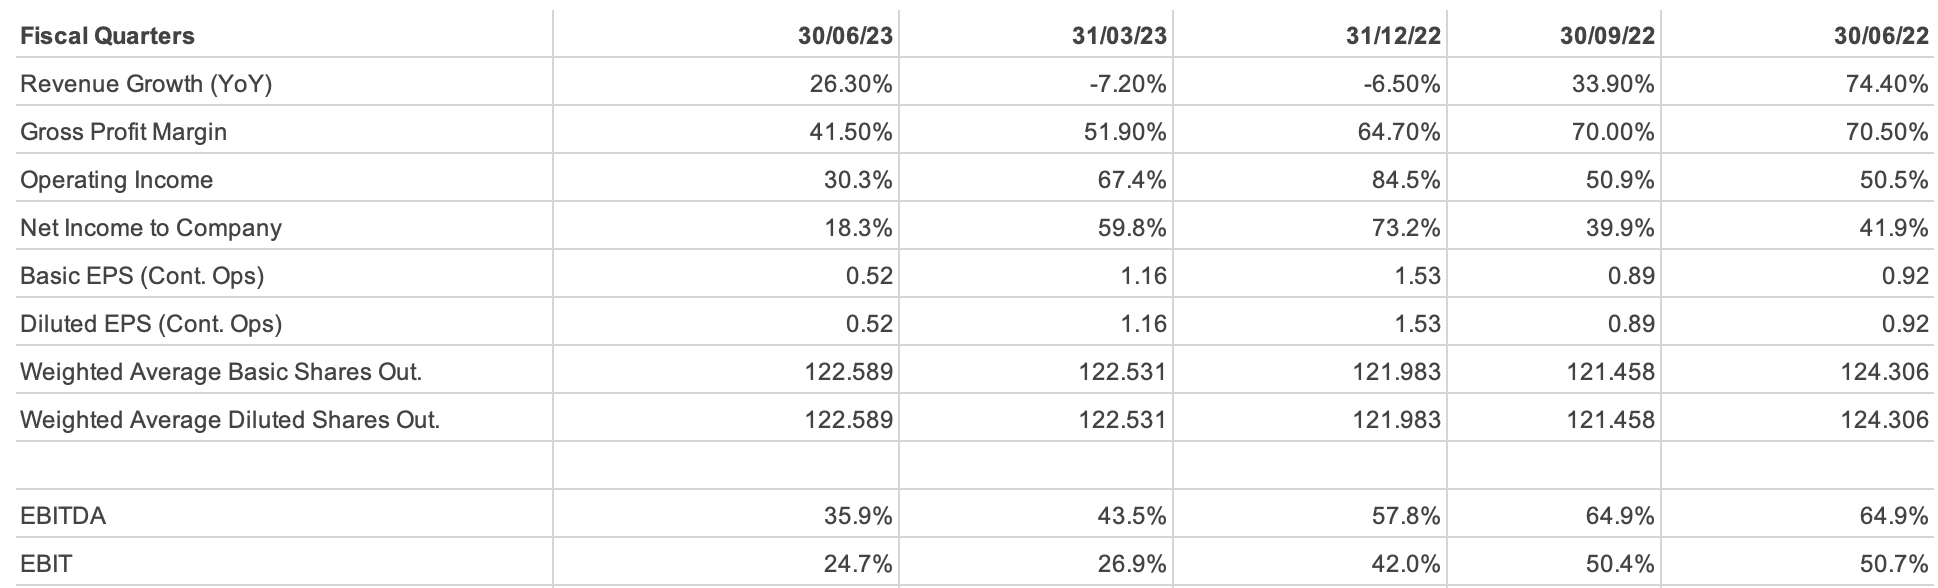
Let's dive into the financials of this company, starting with its main income source, Voyage Revenue. Over the past half-year, this revenue grew by 10%, jumping from $558,937K in 2022 to $614,712K in 2023. On a quarterly basis, it's even more impressive, with a 25.8% increase from $290,927K to $365,943K. This shows the core business is pretty solid. The company also started making money from Leaseback Vessels in 2023, pulling in an extra $1,477K. Though it's a small amount, it signals that the company is smartly diversifying its income streams, which is generally a good move for reducing financial risks.
The company's expenses are shooting up, specifically the Voyage Expenses. These went up by a shocking 409% half-yearly and 516% quarterly. We're talking about an increase from $19,833K to $101,011K in just half a year. This is a red flag that could be due to anything from rising fuel costs to inefficient operations and needs to be addressed. Additionally, a new category of expense Charter-in Hire Expenses—accounts for $86,961K annually and $74,556K quarterly. This could mean the company is leasing more vessels to expand, but at the cost of profitability, which isn't great.
Despite the revenue going up, the operating income decreased by 7% half-yearly and 19% quarterly. Thus, the company isn't converting its increased revenue into profits, mostly due to its skyrocketing expenses. This becomes even clearer when we look at Net Income, which fell by 12% half-yearly and a concerning 44.7% quarterly. Earnings per Share also took a hit, declining 9.7% half-yearly and a whopping 43.5% quarterly, which is bad news for investors.
The operating margin has slipped to 45% from 53.4% last year, underscoring that the company is generating less income from its operations than before. This decline in operating margin aligns with the observed decrease in operating income, reinforcing the hypothesis of operational inefficiencies. The net margin—has declined to 35.1% from last year's 43.9%, offering further evidence that the company is losing its profitability edge, possibly due to the aforementioned surge in expenses.
While the revenue growth implies strong market demand and could be seen as a value driver for the company, it is sharply contrasted by an 11.7% decrease in net income from $245,024K in H1 2022 to $216,258K in H1 2023.
For future projections , if the 10% growth in Voyage Revenue continues, it might hit $676,183K in 2024. But with operating income and net income dropping by 7% and 12% respectively, they could fall to $258,159K and $190,307K. This implies that unless the company controls its escalating expenses, profitability is at risk.
Deductively, this signals that despite the promising revenue figures, the company has red flags when it comes to profitability, making net income the key metric to monitor. If current cost factors remain unchanged, we can expect another 10% increase in revenue but a continued decline in net income. This leads to the abductive hypothesis that there may be underlying cost management issues, given that revenue growth has not translated into net income.
To sum it all up, the company is at a crossroads. It's showing strong revenue growth and has started diversifying its income, which is great. However, the astronomical rise in expenses and the decline in profitability metrics like operating income, net income, and EPS raise concerns.
Balance Sheet Analysis
Starting with liquidity ratios, the Current Ratio stands at 1.68, calculated by dividing the total current assets of $1,112,340k by the total current liabilities of $661,136k. This is a reassuring sign, as a ratio above 1 implies that the company has enough assets to cover its short-term liabilities. The Quick Ratio, which is a more stringent test of liquidity, comes out to be 1.6. This is calculated by subtracting inventories ($54,436k) from current assets and dividing it by current liabilities. The fact that this ratio is above 1 underscores the company's strong liquidity position, even if we exclude inventories, which may not be as easily convertible to cash.
Moving on to solvency ratios, the Debt to Equity Ratio is calculated to be 1.04, with the total debt at $2,431,206k and total equity at $2,342,184k. This ratio suggests that the company's capital structure is balanced but leans towards debt. This could flag a moderate level of financial risk but isn't a red alert.
Next up is the trend analysis. The company's current assets have increased by 9.6% from December 2022 to June 2023. On the flip side, fixed assets have seen a dip of 3.5% during the same period. Additionally, long-term debt decreased by 7.3%. This pattern suggests that the company is probably directing its focus more towards liquid assets and is intentionally reducing its long-term obligations, likely making it less leveraged. However, the decrease in fixed assets warrants an investigation, as it could be due to either depreciation and asset sales.
In terms of forward-looking analysis, the company's increase in Accounts Receivable and Inventories might signal a strategic focus on short-term gains. However, this could be a double-edged sword, as it might also indicate inefficiencies in collecting payments or moving inventory. Given the Debt to Equity Ratio of 1.04, the company does have some room to take on more debt for growth, if it considers that to be a good move.
The forecast for next year, based on a steady 9.6% growth in current assets and a 7.3% reduction in long-term debt, suggests that the company could further improve its liquidity while becoming less leveraged.
Now, let's tackle the potential red flags. The high Accounts Receivable could lead to liquidity issues if not managed effectively. Similarly, the substantial increase in inventory could result in inefficiencies and write-downs if these goods aren't sold.
A SWOT analysis brings us to the following conclusions: Strengths lie in the company's good liquidity and reduction in long-term debt. Weaknesses appear in the form of increased short-term obligations and a slight leaning towards debt. Opportunities could be in the form of growth indicated by the increase in current assets, while threats could emerge from high inventories and accounts payable, which may suggest operational inefficiencies.
Finally, the investment recommendation would be to 'Hold'. While the company shows strong liquidity and a balanced capital structure, the red flags around high Accounts Receivable and significant inventory increase cannot be ignored. Therefore, holding off on additional investment until these aspects are clarified would be prudent.
Free Cash Flow Analysis
Author analysis
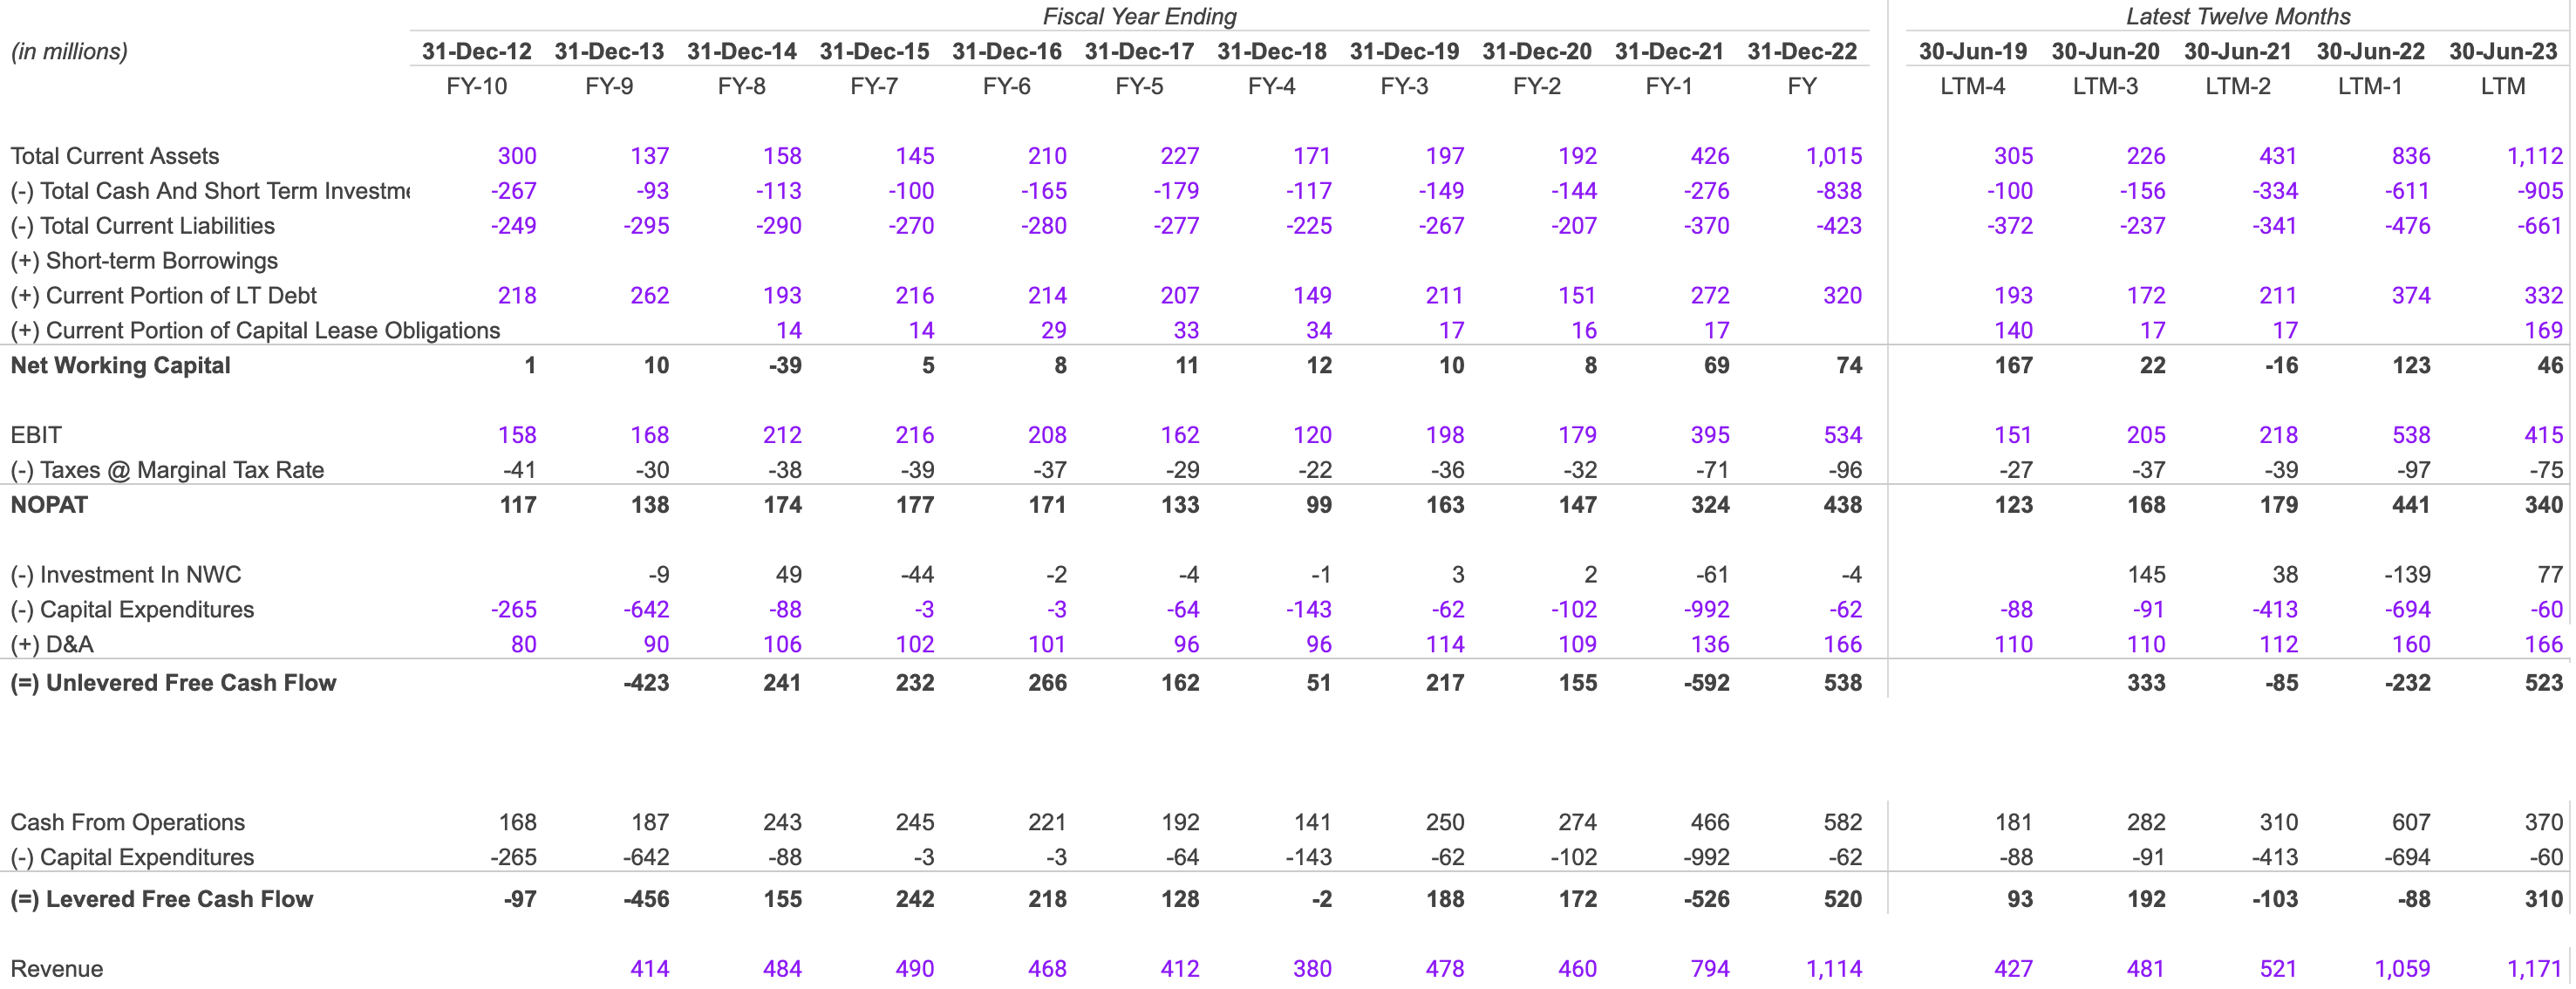
Cash From Operations initially rose from $310 million in 2021 to $607 million in 2022, indicating robust operational cash generation. However, a subsequent decline to $370 million in 2023 suggests a potential softening in business activities. On the investing front, Capital Expenditures saw significant outflows—$413 million in 2021 and $694 million in 2022—before sharply dropping to $60 million in 2023, signaling a reduction in asset investments and a realization of returns on prior investments. Concurrently, the Current Portion of Long-Term Debt decreased from $374 million in 2022 to $332 million in 2023, suggesting prudent debt management through repayments and refinancing.
Net Working Capital improved from a negative $16 million in 2021 to a positive $46 million in 2023, signifying enhanced liquidity. Unlevered Free Cash Flow improved from negative values—$85 million in 2021 and $232 million in 2022—to a positive $523 million in 2023. Levered Free Cash Flow followed suit, recovering from negative $103 million in 2021 and negative $88 million in 2022 to a positive $310 million in 2023. These improvements in free cash flows could continue if the company keeps capital expenditures low and manages its debt effectively.
However, there's a dip in operational profitability and efficiency, as evidenced by the drop in EBIT from $538 million in 2022 to $415 million in 2023 and a decline in NOPAT from $441 million to $340 million over the same period. Despite these red flags, the company has managed to elevate its Revenue by 10.6%, from $1,059 million in 2022 to $1,171 million in 2023.
Value seems chiefly driven by the increase in Net Working Capital and Levered Free Cash Flow, suggesting operational efficiency. Financial ratios also back this hypothesis; a Current Ratio of 1.68 and a Net Profit Margin of 29% for 2023 signal healthy financial standing.
Given its swing from a negative $85 million in 2021 and negative $232 million in 2022 to a positive $523 million in 2023, we can anticipate a continuation of this positive trend, especially if capital expenditures remain as low as the $60 million seen in 2023. A conservative estimate might place the Unlevered Free Cash Flow for the next year above the $523 million mark, assuming operational efficiency remains stable, and no unexpected investment spikes occur. Like Unlevered Free Cash Flow, Levered Free Cash Flow has shown a positive trend, improving from negative values to a positive $310 million in 2023. If the company maintains or further reduces its current debt levels, we could see a sustained positive Levered Free Cash Flow, potentially exceeding the current $310 million.
Although the spike in both Unlevered and Levered Free Cash Flows indicates reliable earnings, the decline in Cash From Operations in 2023 of $370 million from $607 million in 2022 warrants closer scrutiny. If this trend reverses in the next year, it would enhance the quality and reliability of earnings. However, if it continues to decline, it could raise questions about the sustainability of earnings and cash flow.
In summary, the company shows promising signs in its free cash flows, but there are cautionary elements in NOPAT and Cash From Operations that require close monitoring.
Cash Conversion Cycle
Author analysis
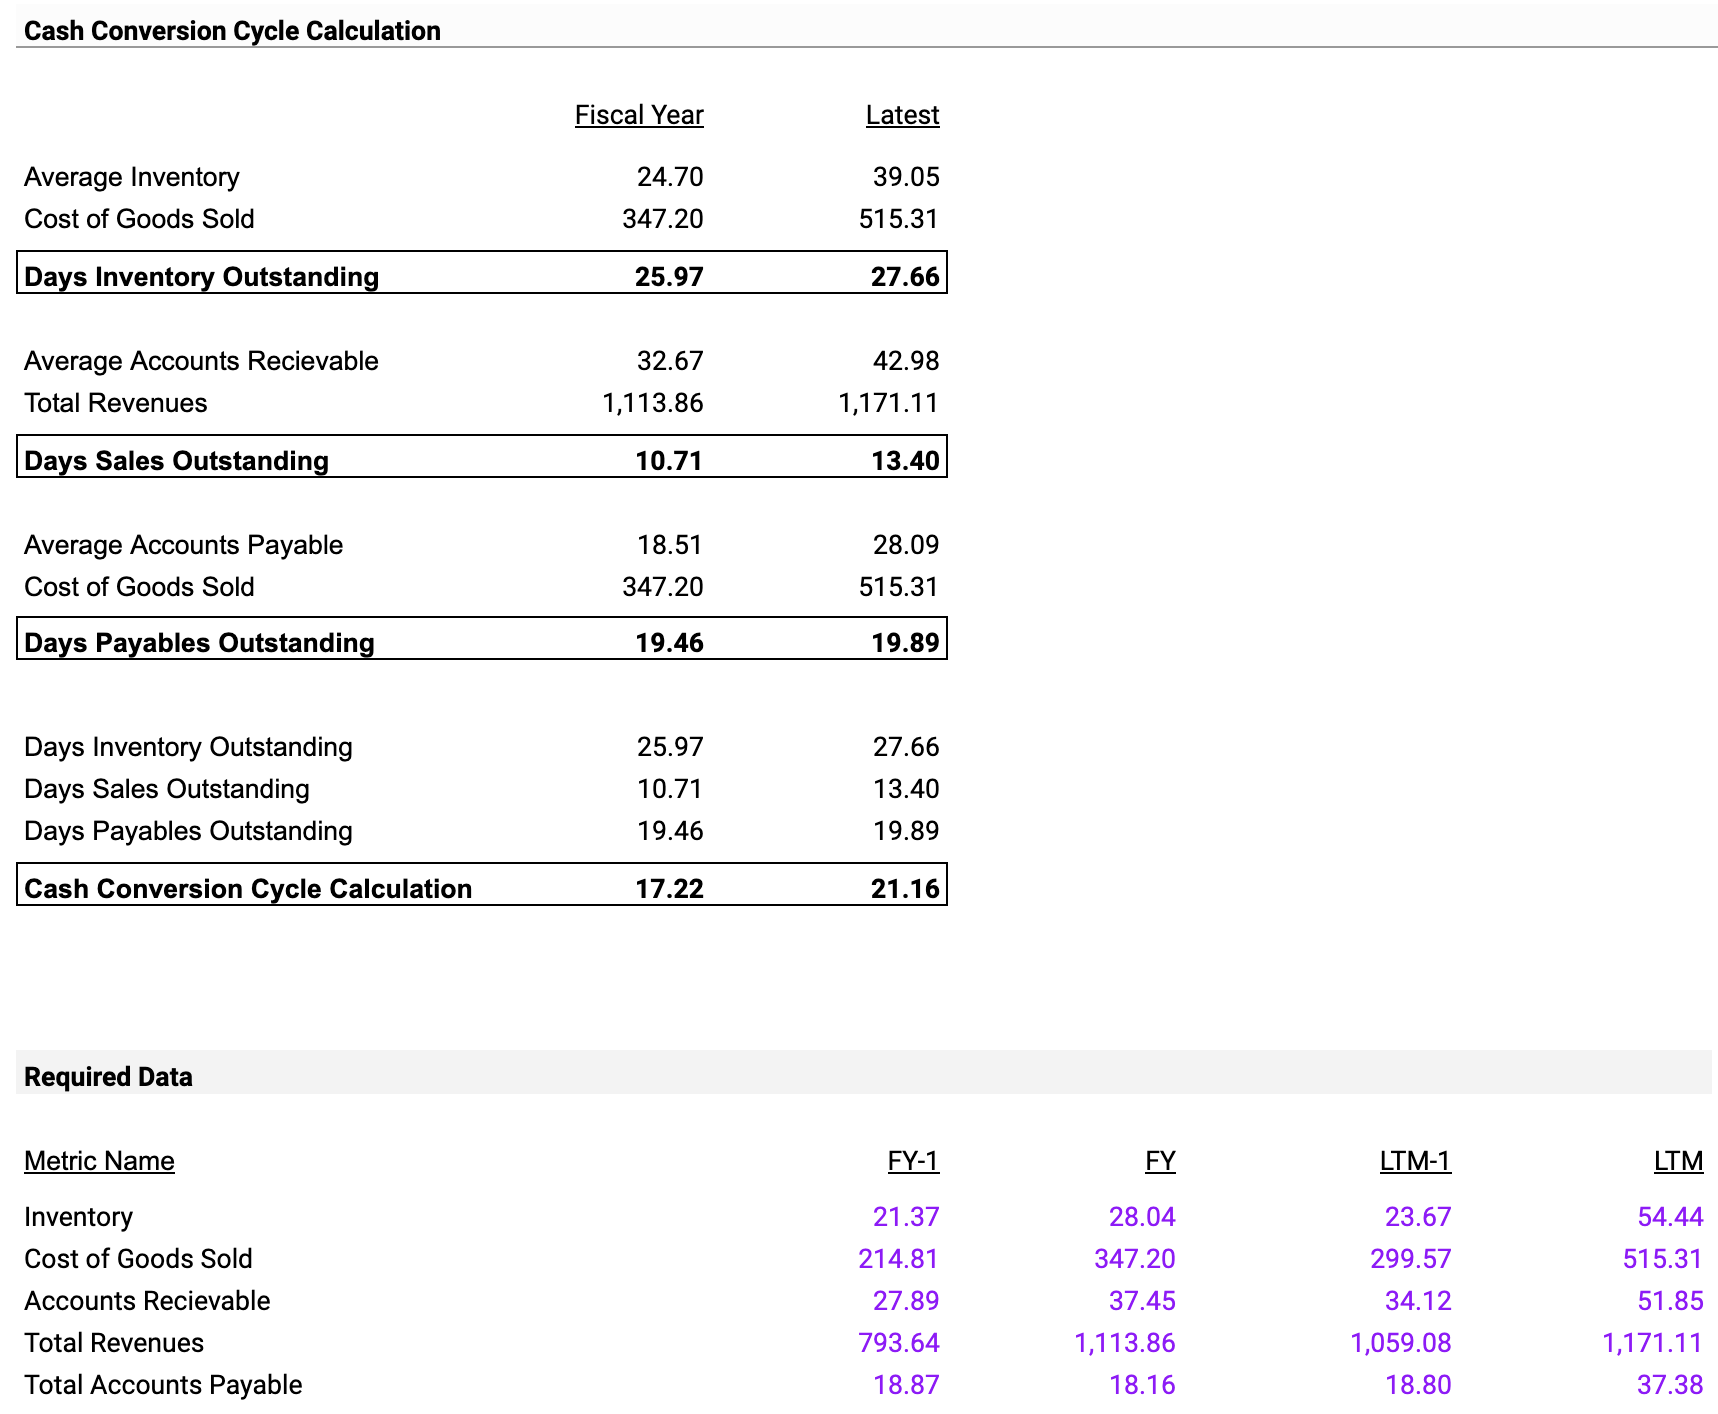
The Cash Conversion Cycle (CCC) has notably increased from 17.22 days in the last fiscal year to 21.16 days most recently, indicating a potential liquidity issue as the company takes more time to convert its investments into cash. This liquidity concern is further exacerbated by an increase in Days Sales Outstanding (DSO) from 10.71 days to 13.40 days, suggesting slower cash collections.
Projecting forward, if these trends persist, the CCC could escalate to around 23-25 days in the next year. Moreover, the Average Inventory rose by 57.8% year-over-year, from 24.70 to 39.05, while the Cost of Goods Sold jumped 48.4%, from $347.20 million to $515.31 million, which are both alarming signs.
Despite these liquidity and operational challenges, the company's primary value driver remains its revenue growth, with total revenues standing at $1,171.11 million. Given the existing trends, there's a high risk of further CCC increase, affecting liquidity.
Shareholder Yield
Author analysis
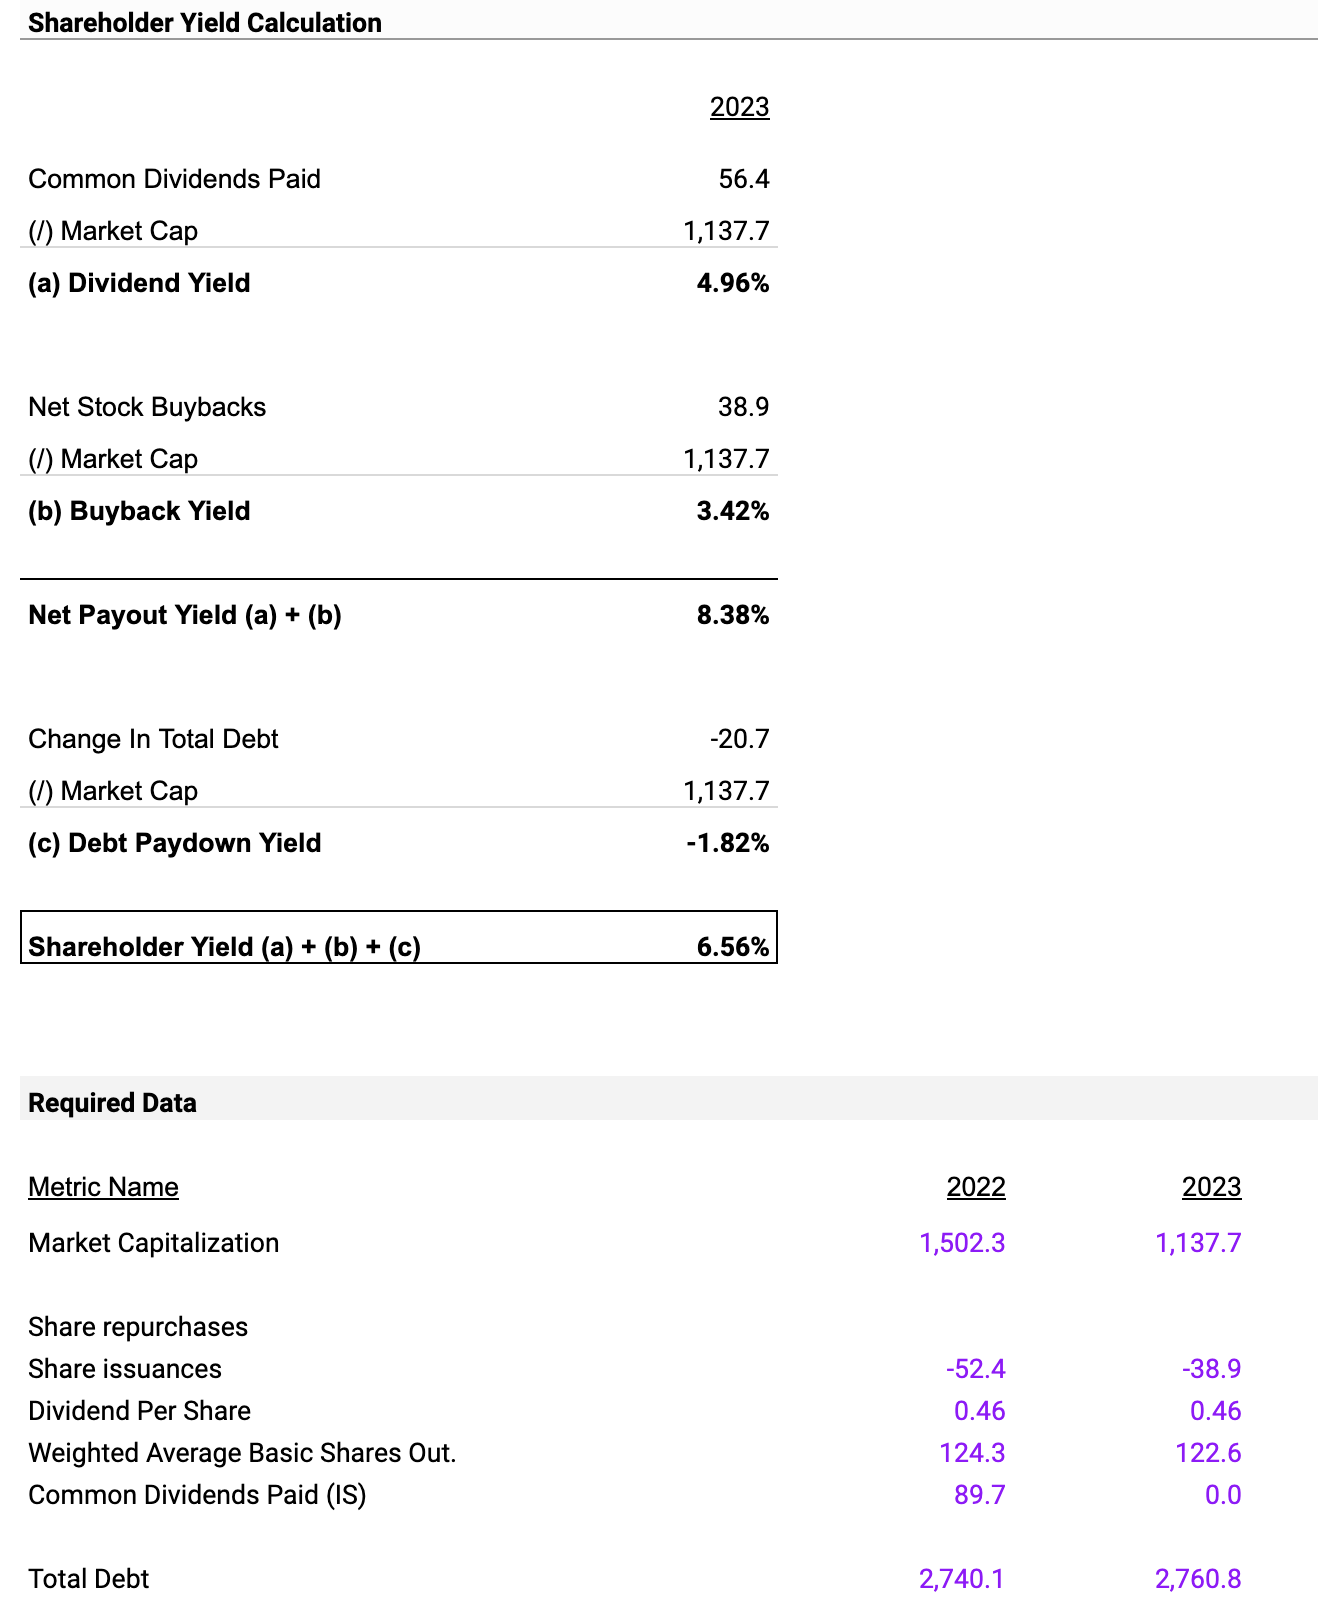
The company has a Shareholder Yield of 6.56%, which is a composite of a Dividend Yield of 4.96% on $56.4 million in common dividends and a Buyback Yield of 3.42% from $38.9 million in Net Stock Buybacks, both calculated against a Market Cap of $1,137.7 million. This Shareholder Yield serves as the primary value driver, chiefly propelled by dividends and buybacks.
However, there's a red flag in the Debt Paydown Yield, which is at a negative 1.82% due to a $20.7 million reduction in total debt. This negative yield poses a high-priority risk and could impact long-term solvency despite the company's current liquidity being boosted by high dividend and buyback yields.
In a forward-looking analysis , if the company maintains its current financial activities, the Shareholder Yield is expected to remain around the 6-7% range, making it a high-priority metric to watch.
Valuation
In evaluating the financial health and valuation of Costamare Inc., I am relying on EV/EBITDA multiples, a commonly used metric in comparable company analysis. Our model indicates a fair value of $10.89 per share for Costamare, based on both historical and forward-looking EBITDA multiples.
LTM EBITDA Valuation
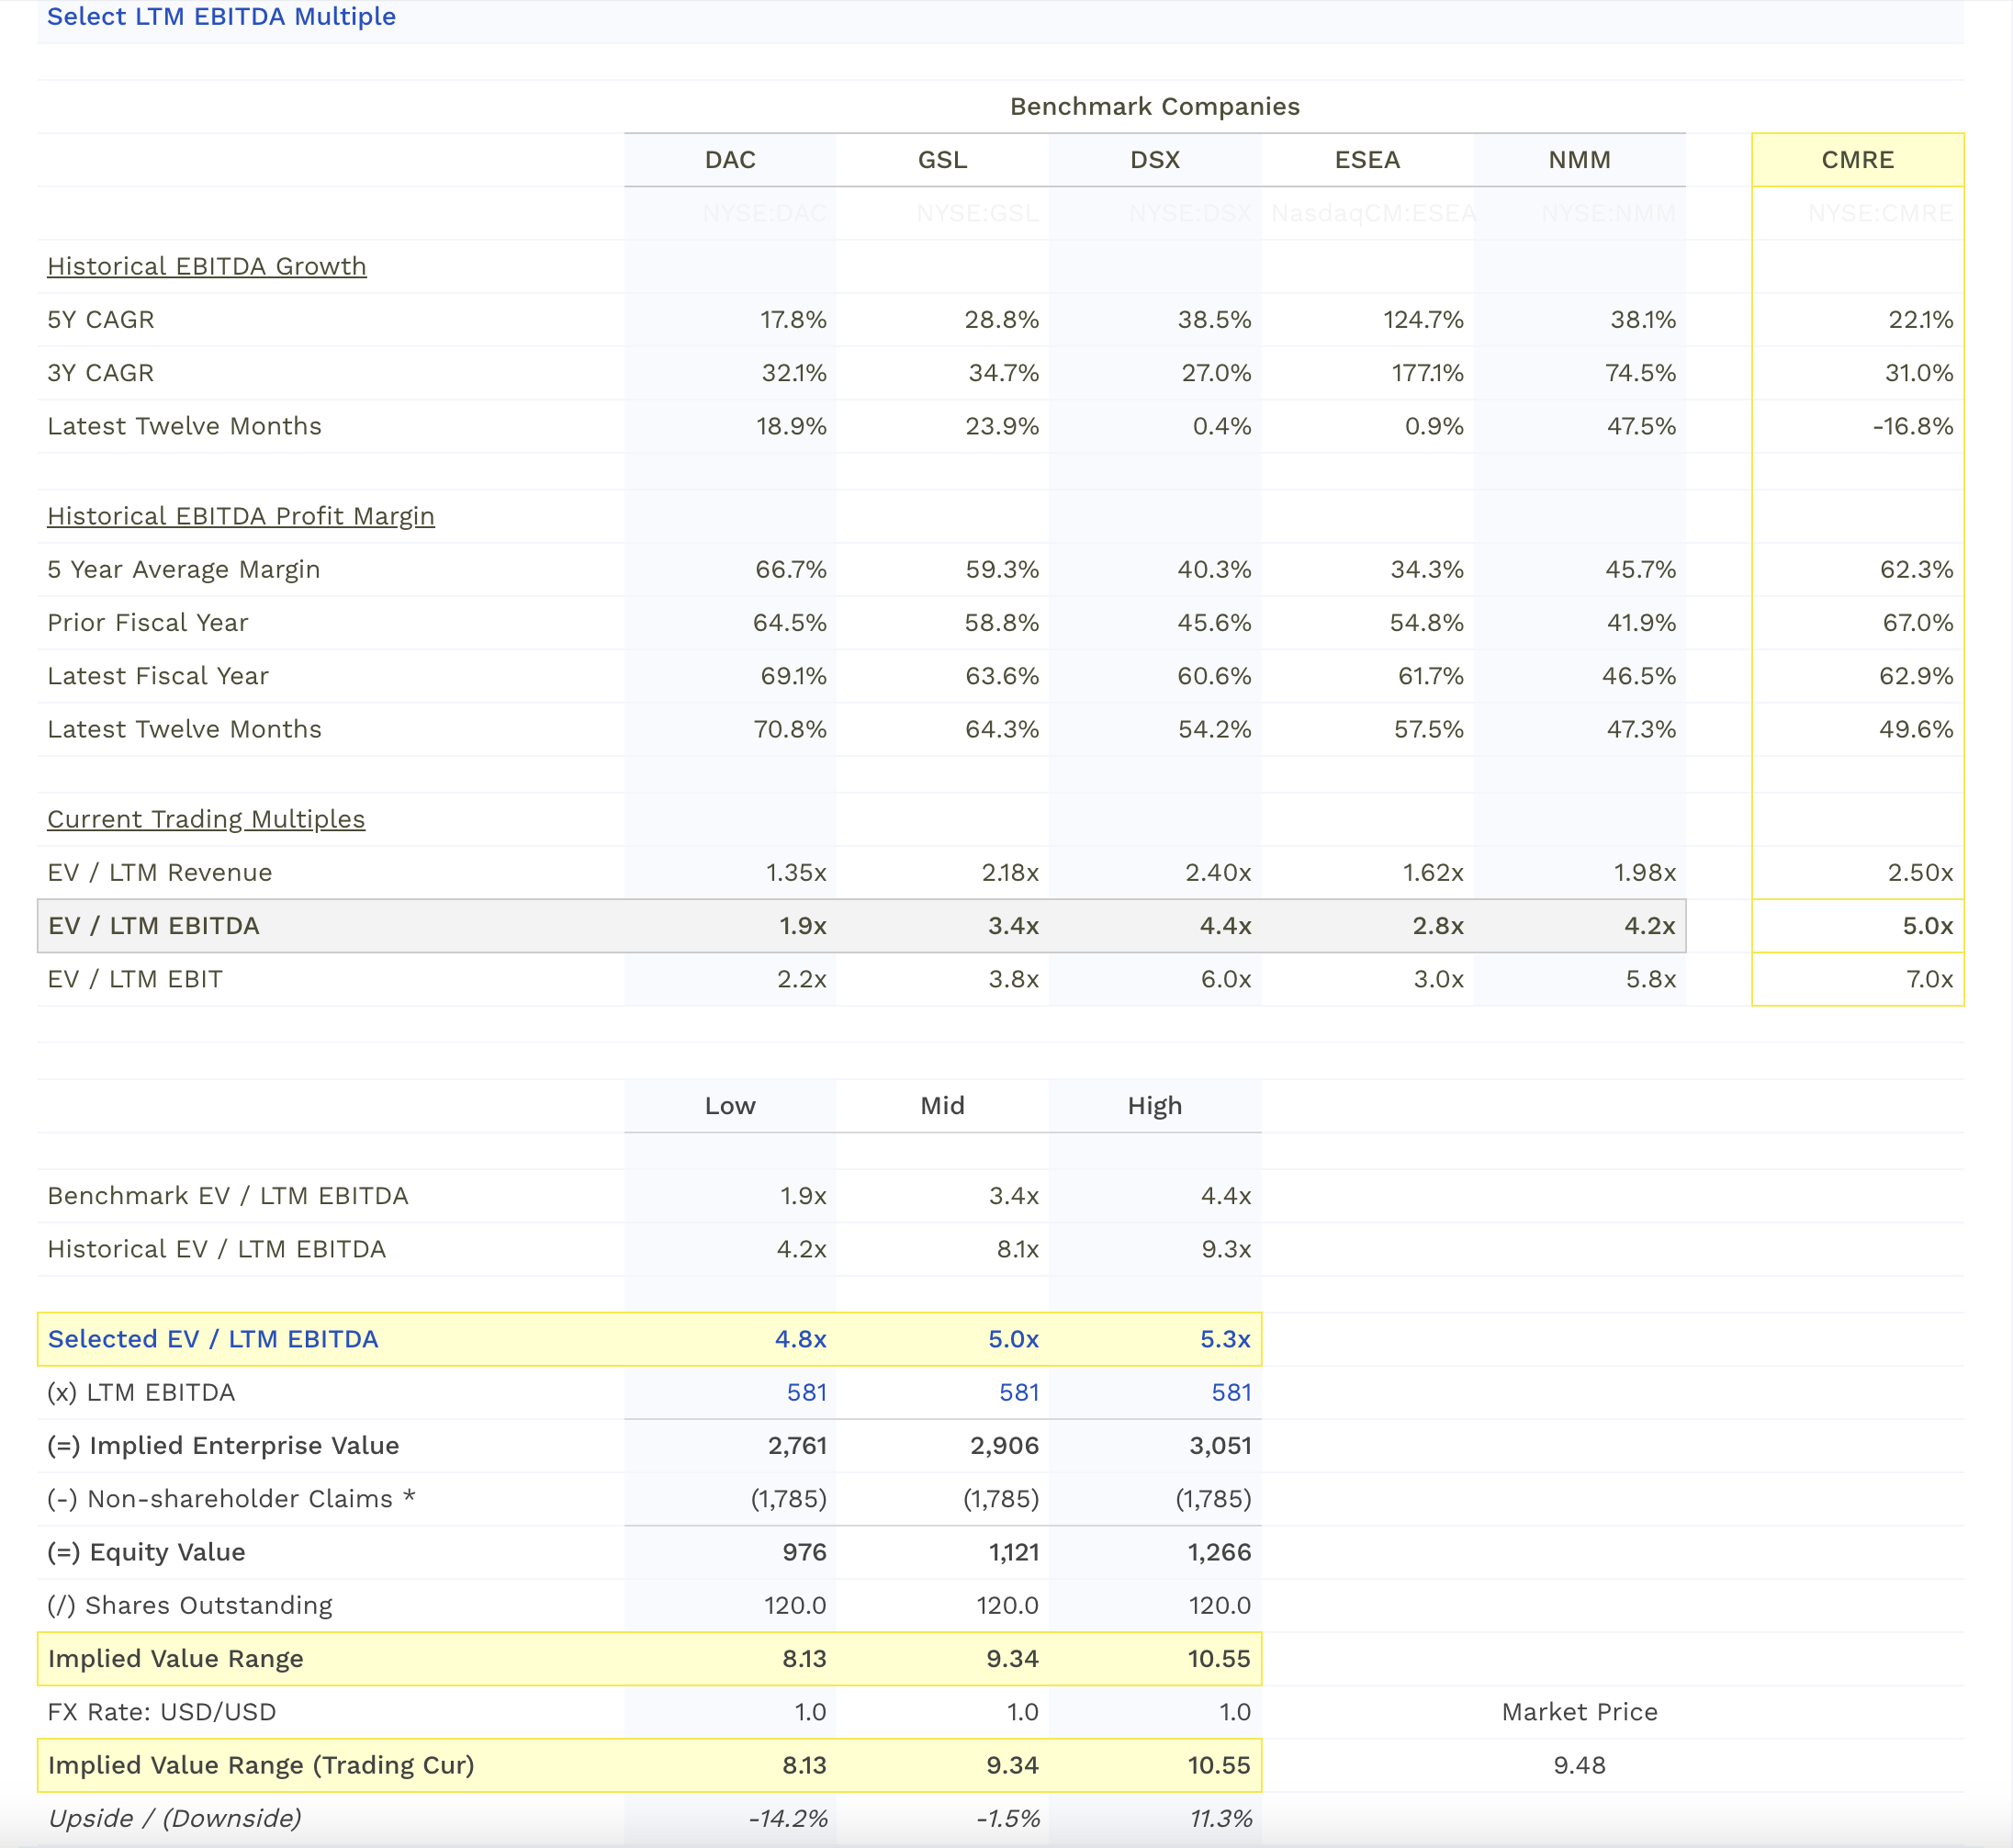
We consider benchmark companies like Danaos Corporation ( DAC ), Global Ship Lease ( GSL ), Diana Shipping ( DSX ), Euroseas ( ESEA ), and Navios Maritime Partners ( NMM ) for comparison. For the Last Twelve Months (LTM), the EBITDA multiples for these benchmarks range from 1.9x to 4.4x, with Costamare having a multiple of 5.0x. This is higher than the benchmark median of 3.4x, indicating a premium valuation.
Given the EBITDA of Costamare is $581 million, applying our selected LTM EBITDA multiple of 5.0x yields an implied Enterprise Value (EV) of $2,905 million. Subtracting non-shareholder claims of $1,785 million leaves an Equity Value of $1,121 million. Dividing by 120 million shares outstanding, we get an implied stock value range of $9.34.
Forward EBITDA Valuation
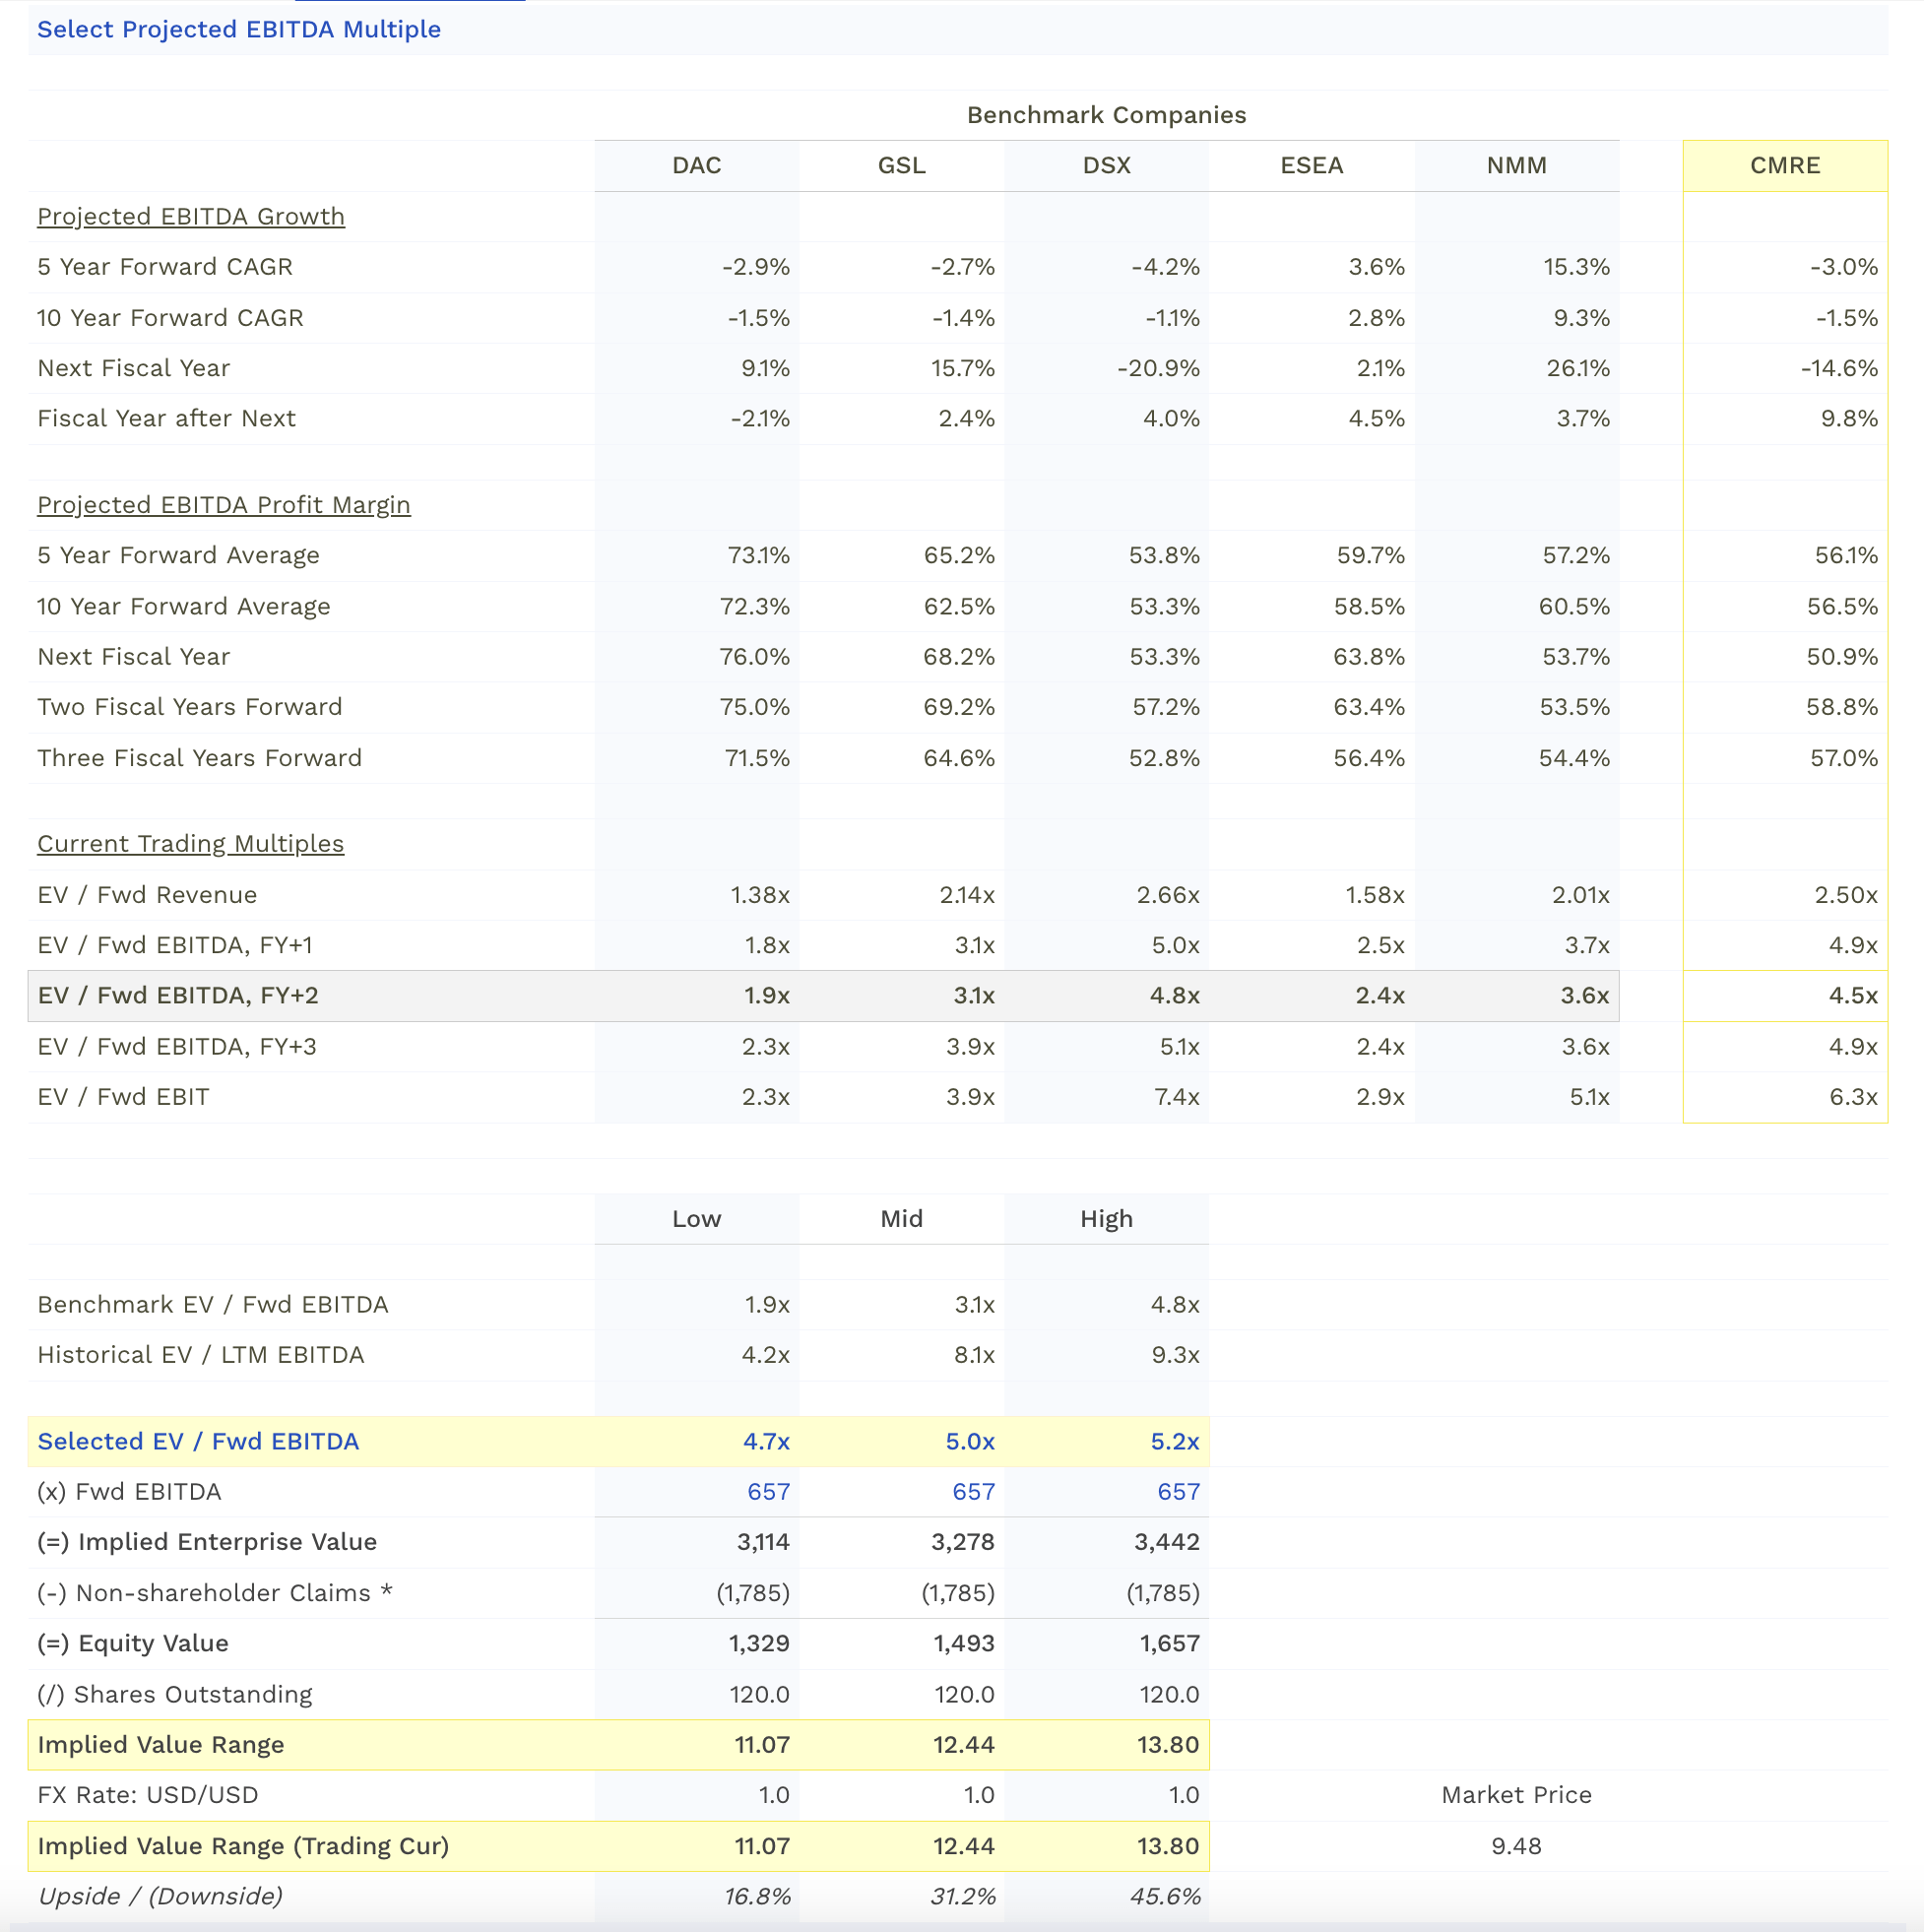
For the forward-looking EBITDA valuation, the selected multiple is 5.0x, based on a future EBITDA projection of $657 million. This results in an implied EV of $3,278 million. After accounting for non-shareholder claims, the Equity Value is $1,493 million. Again, divided by 120 million shares, the implied stock price stands at $12.44.
Risk and Upside
Considering EBITDA growth rates, Costamare has shown a 5-year CAGR of 22.1% and a 3-year CAGR of 31.0%, although it's underperformed in the latest fiscal year with a -16.8% growth. Its EBITDA profit margin over the LTM is 49.6%, below the 5-year average of 62.3%. These factors suggest some volatility and potential downside risk.
Fair Value
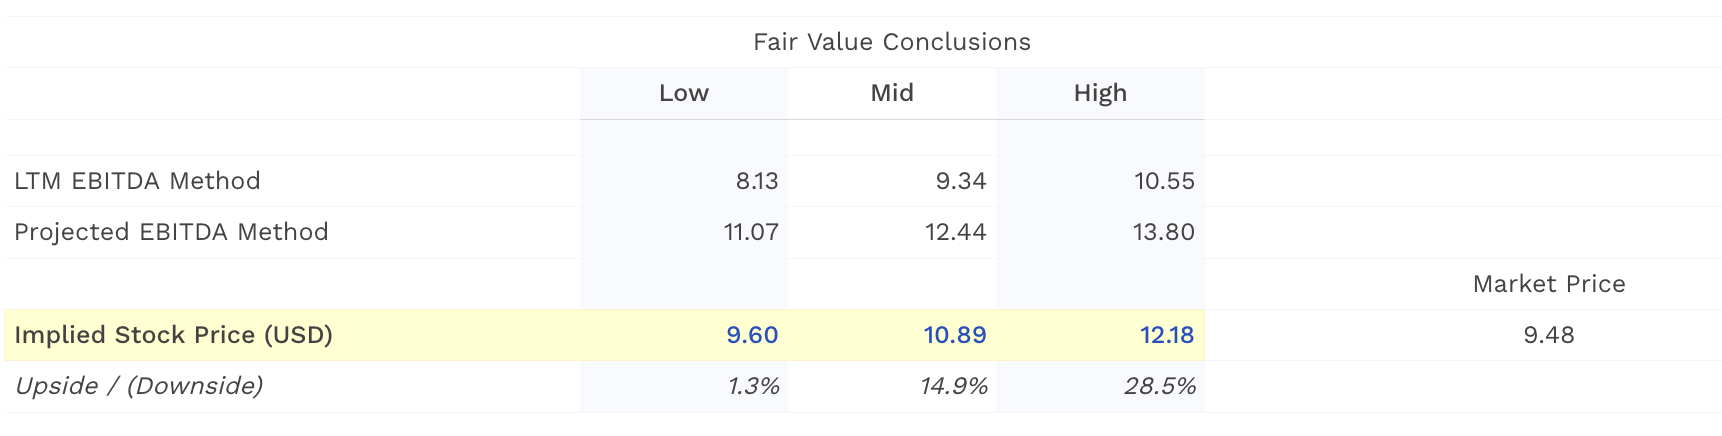
After examining both LTM and forward EBITDA methods, we have an implied stock price range from $8.13 to $13.80. The current market price is $9.48, offering an upside/downside from -14.2% to 45.6%. Given the fair value of $10.89, the stock offers an upside of 14.9%.
Therefore, the recommended action would be to 'Hold' Costamare Inc. shares. The company appears to be fairly valued at the moment, but given the risks and upside potential, holding offers the most balanced approach.
Earnings Commentary
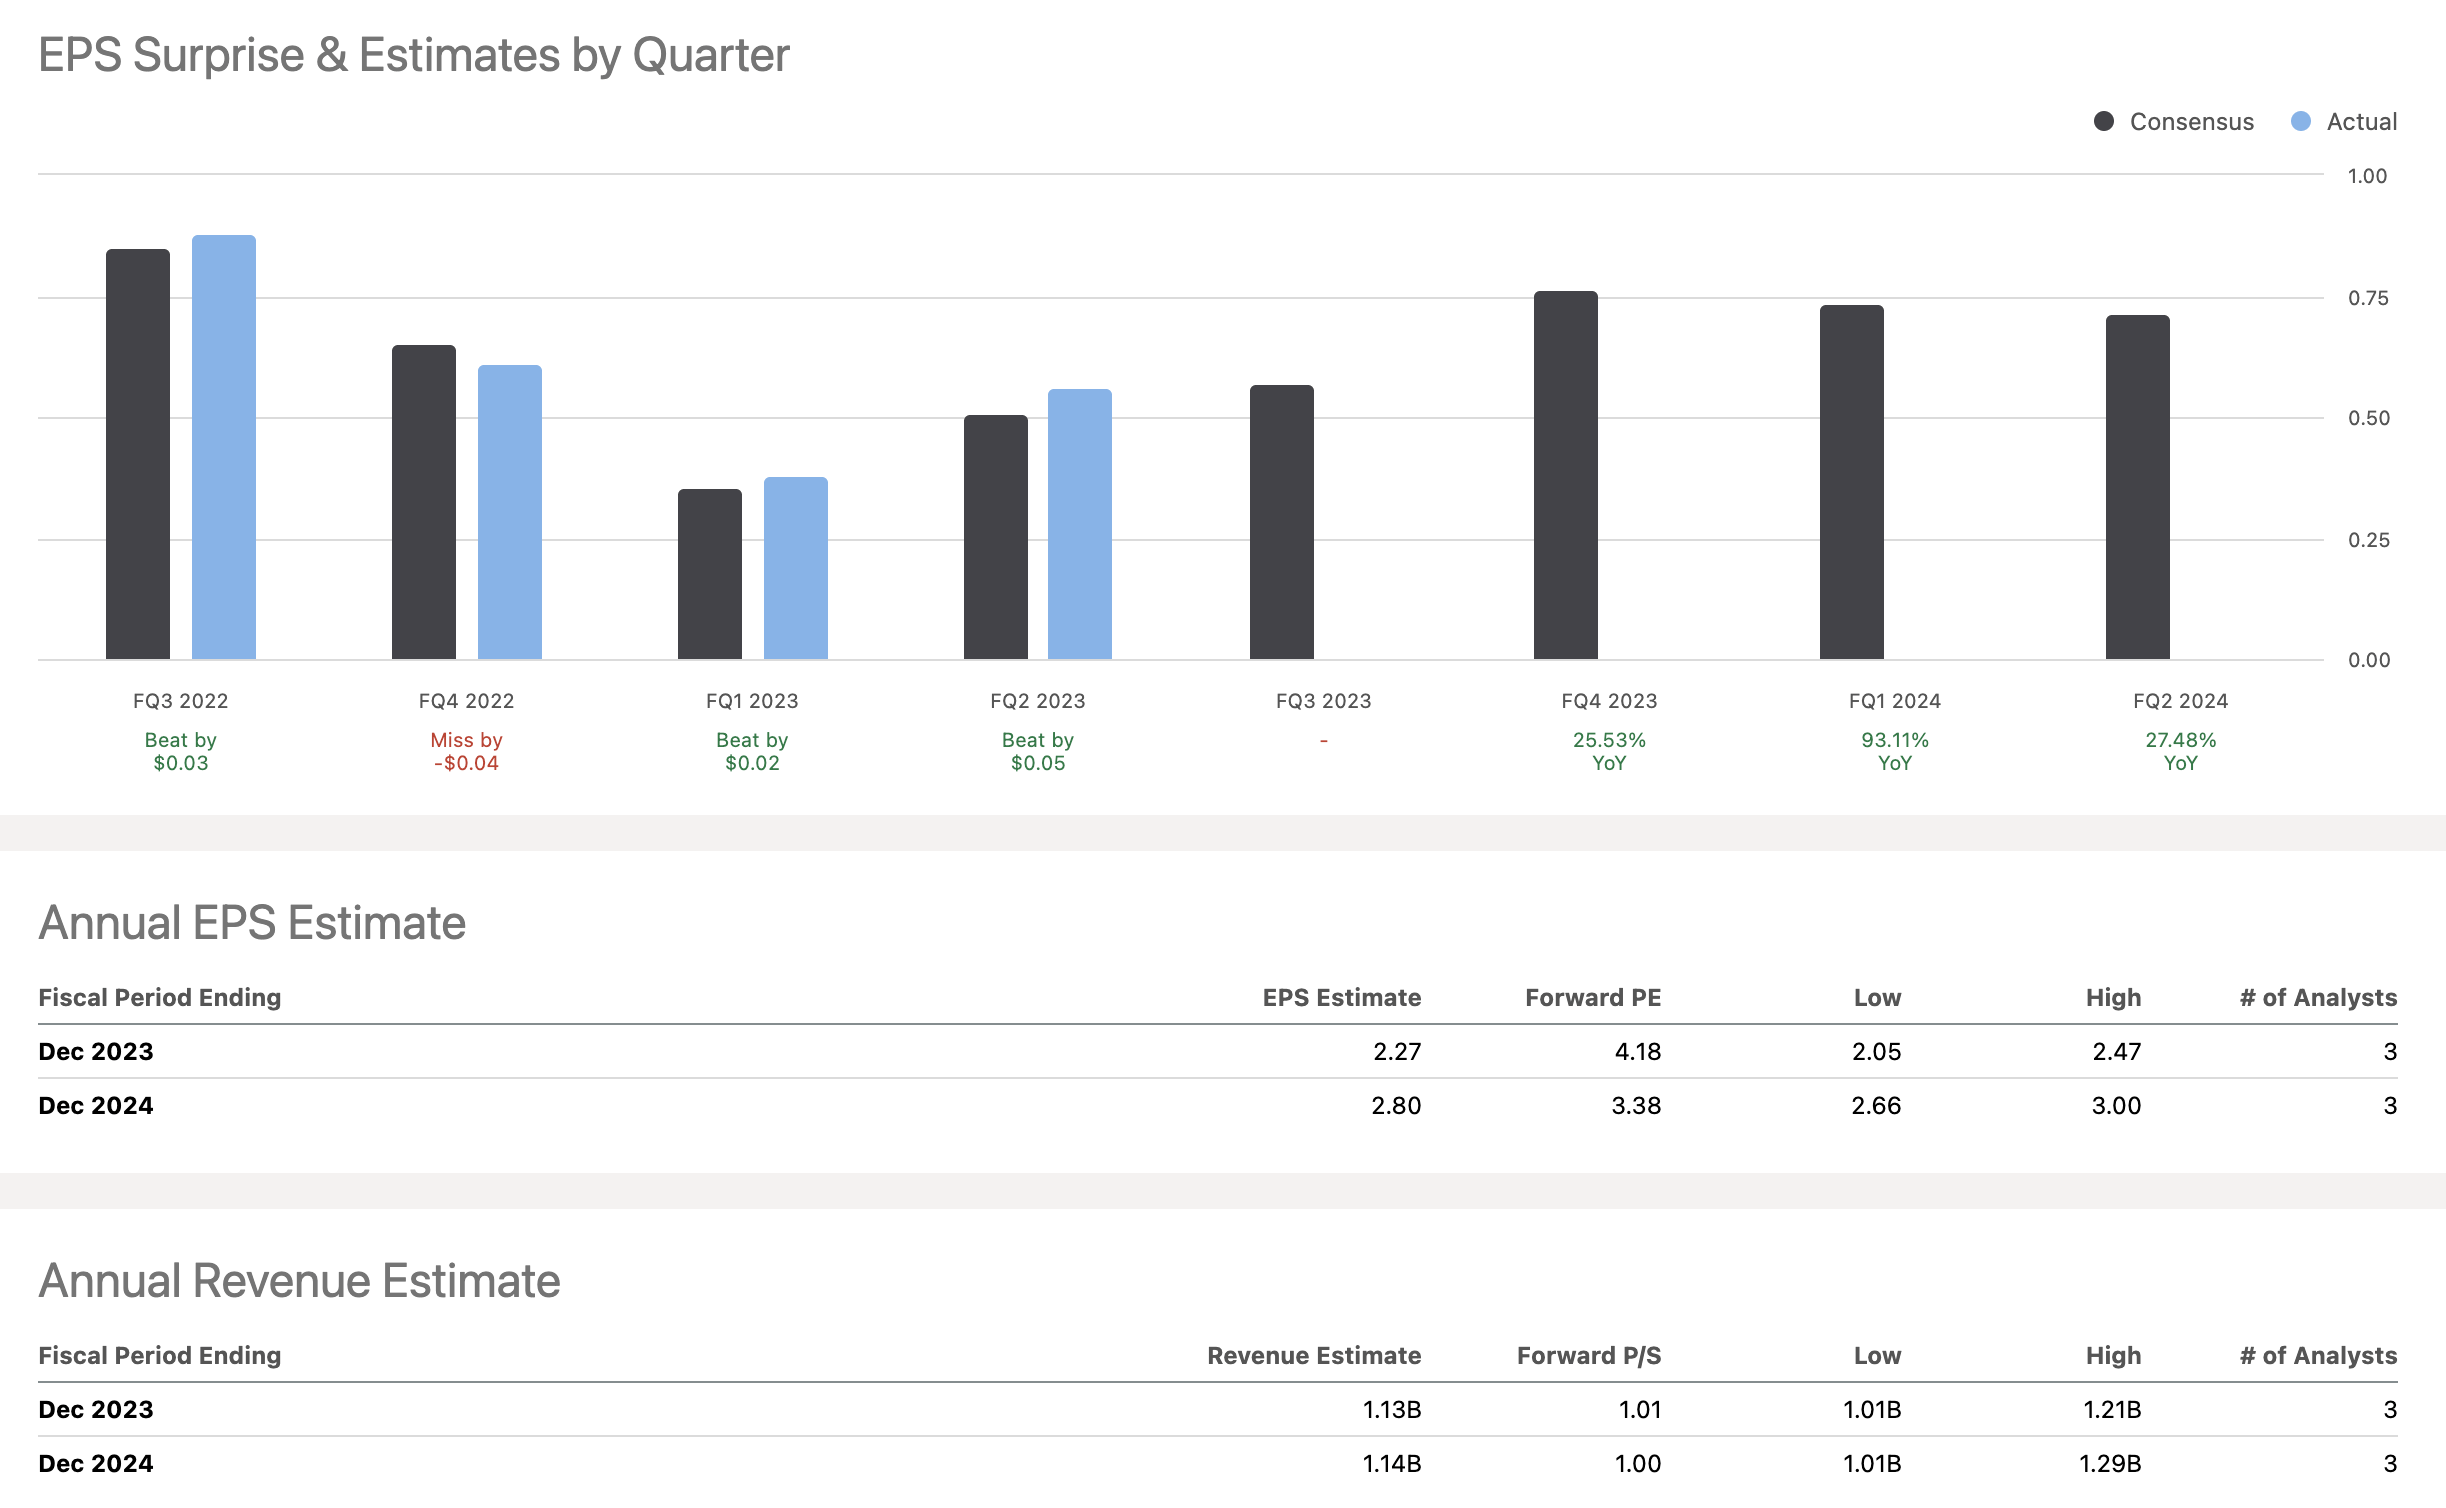
Starting with the Revenue Forecast for the period ending on September 30, 2023, the low forecast for this period is at $227.9 million, the median forecast stands at $271.887 million, and the high forecast is at $315.874 million. The average forecast for this time frame is also $271.887 million. This average suggests that analysts are optimistic about the company's ability to generate substantial revenue, with the median and average numbers being quite close at around $271.9 million.
Now, shifting our focus to Earnings Per Share ((EPS)), for the period ending September 30, 2023, the low forecast is at 0.37, the median is at 0.58, and the high is at 0.76, with an average forecast of 0.57.
If we look at these revenue and EPS forecasts together, it's evident that there's an expectation of robust revenue generation for the period ending September 30, 2023. The EPS figures, while showing some variability, are still largely positive, pointing to expectations of profitability. The higher median and average revenue forecasts could suggest that analysts expect a solid operating environment for the company, possibly based on industry trends or specific business strategies the company might have in place.
In summary, the financial forecast data, backed by multiple analysts, suggests a generally positive outlook for the company's revenue and earnings per share for the period ending September 30, 2023. The median and average forecasts for both metrics are optimistic, although the range in EPS forecasts indicates that there's less consensus on the company's profitability.
Investment Recommendation
Based on the analysis, my recommendation is to 'Hold.' The company reported a robust Net Income of $63.2 million and an Adjusted Net Income of $68.6 million in Q2 2023, supported by a strong liquidity position of $1,059 million. This financial health is further validated by a Shareholder Yield of 6.56%, driven primarily by a Dividend Yield of 4.96% and a Buyback Yield of 3.42%.
Despite these strengths, the company exhibits red flags, such as a negative Debt Paydown Yield of -1.82% and a Cash Conversion Cycle that has increased from 17.22 to 21.16 days, signaling potential liquidity concerns. Voyage revenue grew 10% YoY, but this was offset by an 11.7% decrease in net income and a 44.8% quarterly drop, indicating underlying cost management issues. The balance sheet shows an 8.4% growth in Total Assets and a corresponding rise in Total Liabilities. A liquidity ratio of 1.68 and a moderate leverage position with a long-term debt-to-total assets ratio of 0.396 indicate financial stability, but a 56% surge in Current Liabilities warrants close monitoring. External factors like market oversupply in the Order Book and a $176 million debt refinancing could impact the company negatively.
This investment is more suited for a long-term, conservative investor willing to monitor the company's debt levels and order book closely. Given the mix of strong financial health, good liquidity, but potential risks in debt management and market oversupply, a 'Hold' recommendation is advised.
For further details see:
Costamare: A Complex Yet Promising Long-Term Hold