CTRA - Coterra Energy: A Little Too Gassy For My Liking
2023-09-26 04:47:57 ET
Summary
- Coterra Energy's second quarter 2023 results show a struggle with disappointing natural gas prices, but oil prices have risen significantly.
- The company's production is primarily natural gas, making it highly sensitive to price fluctuations and increasing investment risk.
- I recommend buying CTRA stock between $26 and $25.7, with possible lower support at around $25.
Introduction
Houston-based Coterra Energy ( CTRA ) released its second quarter 2023 results on May 4, 2023.
Note: I have followed CTRA quarterly since October 2017 (Cabot Oil). This new article updates my article published on June 12, 2023.
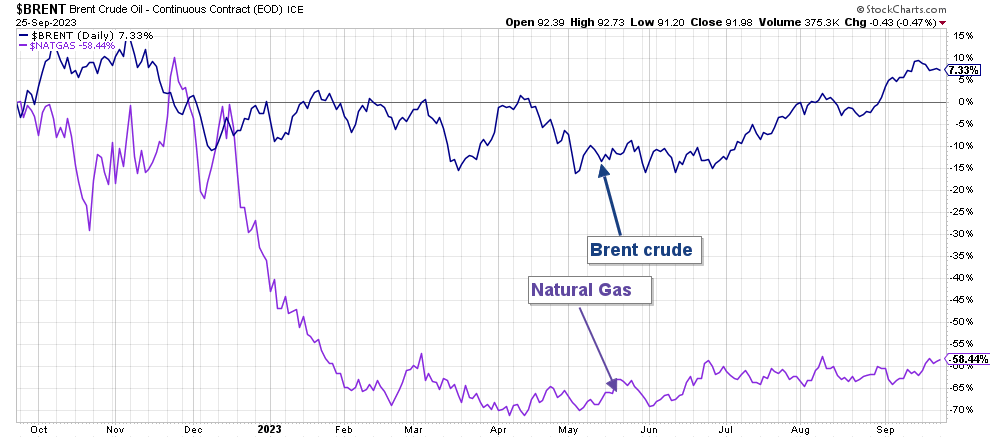
Coterra Energy is struggling with a bearish trend in natural gas prices, even if they are now up slightly from their low in May. On the other hand, oil prices have risen significantly from their lows in July.
CTRA 1-Year Chart Brent versus NG Prices (Fun Trading StockCharts)
1 - Presentation
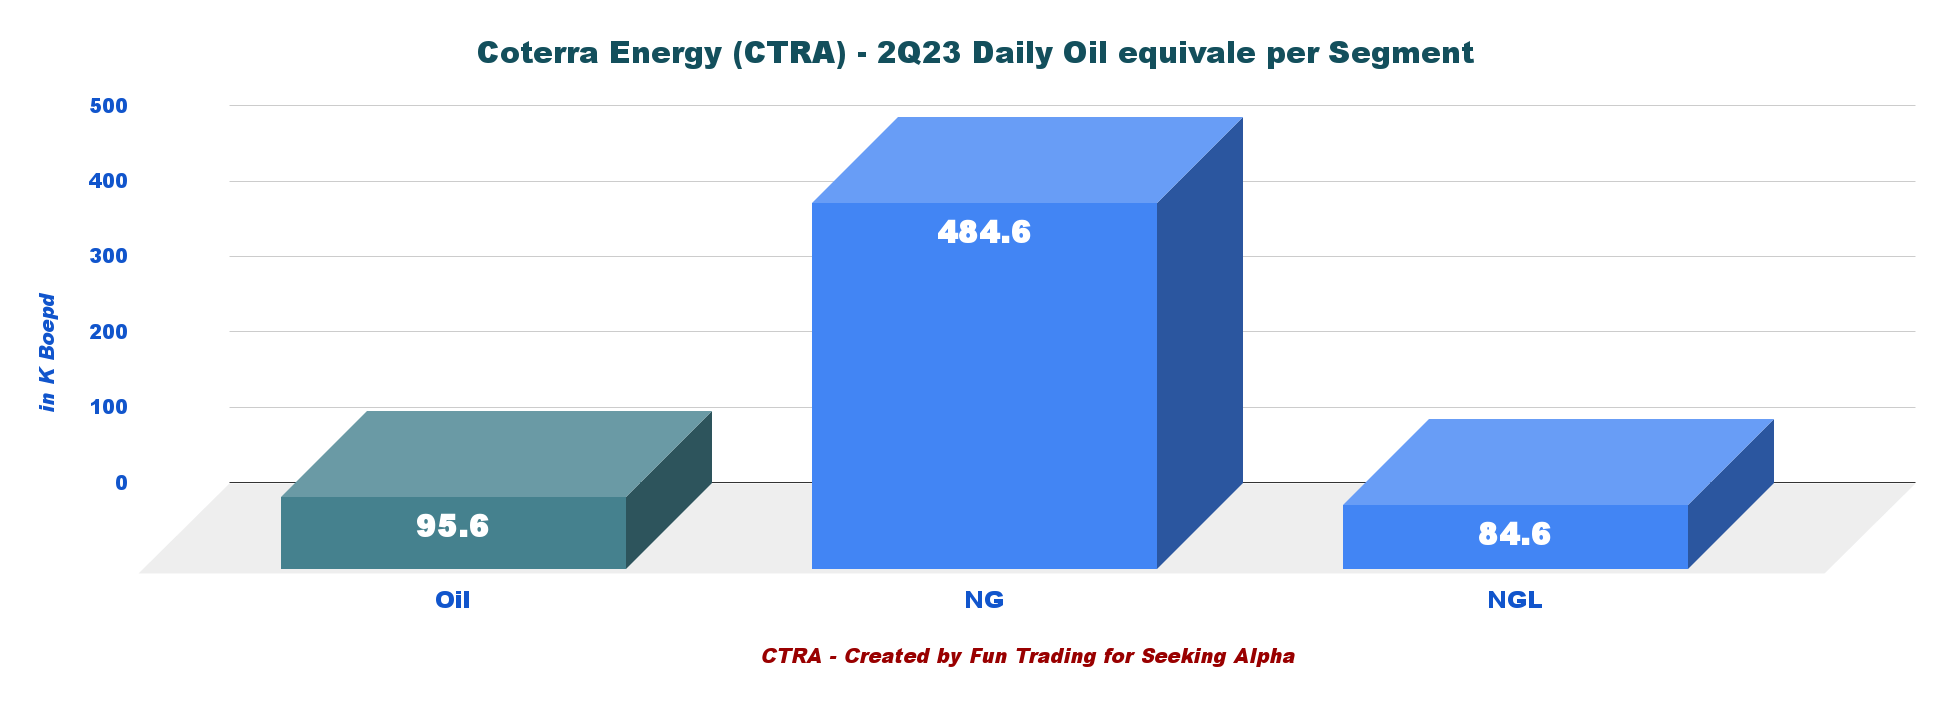
The company's production is primarily natural gas, representing 72.9% of the total output, leaving only 15.4% for oil.
CTRA Q2'23 Production per Segment (Fun Trading)
Thus, the company is highly sensitive to the price of natural gas, which is a weakness that should be considered seriously before investing in the stock long-term. On the other hand, CTRA is a US oil & gas producer.
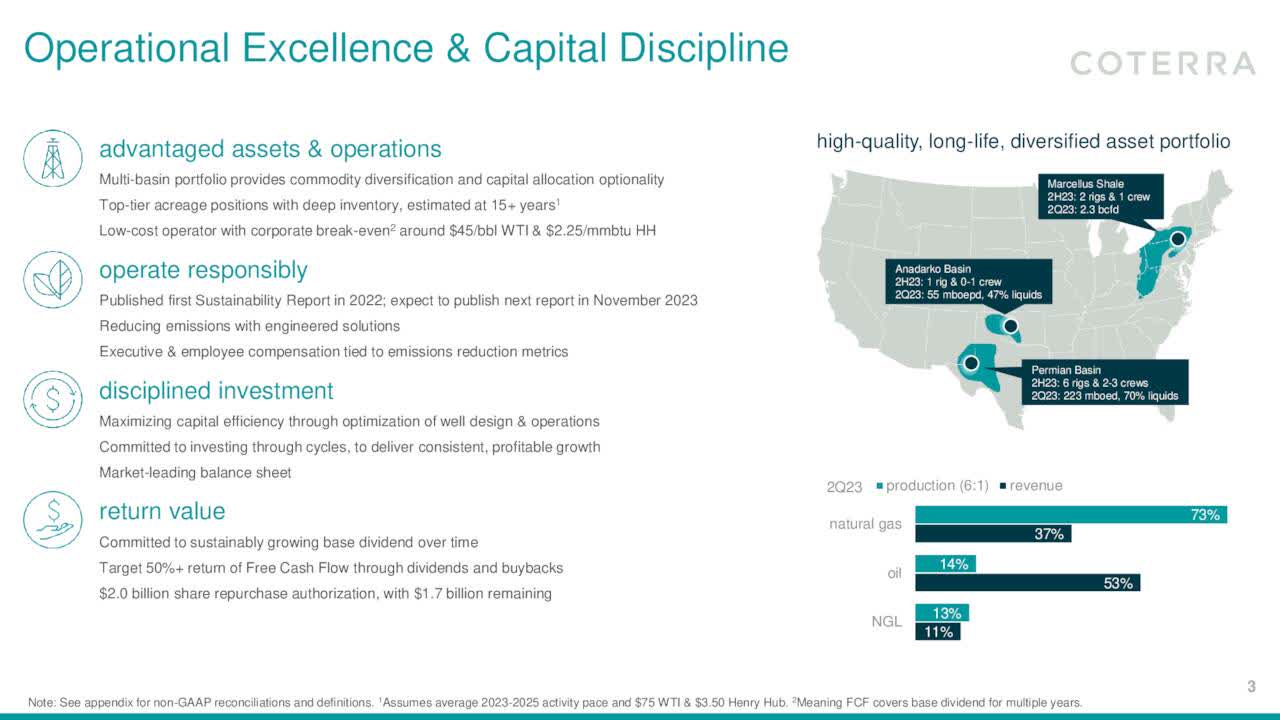
The company exclusively produces Oil, NGL, and natural gas from three US basins ( Marcellus , Permian , and Anadarko ).
CTRA Map Assets Presentation (CTRA Presentation)
2 - Stock performance
I cover Coterra Energy and Chesapeake Energy ( CHK ) in this segment. Both companies dropped significantly from their high in 2022. CTRA outperformed CHK on a one-year basis and is now up nearly 1% YoY .
3 - Investment Thesis
Coterra Energy reported a weak second-quarter revenue due to lower commodity prices. The company's top-tier assets and solid balance sheet are a plus, but the stock is prone to wild swings due to its high gas production, reaching 72.9% of the total input in Q2'23, increasing the risk of hiccups along the way.
The issue with gas-oriented E&P like Coterra Energy is their revenues' unpredictability and high volatility, which strongly affect free cash flow and dividends.
A look at history shows that the Natural Gas segment is periodically rocked by periods of busts and limited successes, which makes an investment in this segment quite risky.
CEO Tom Jorden said in the c onference call :
With top-tier assets, a pristine balance sheet and few contractual service commitments, we have tremendous flexibility for 2024 and beyond. Now as ever, our mission is to generate consistent profitable growth. Having outstanding oil and natural gas assets with a low cost of supply
Thus, I recommend a long-term CTRA position combined with active short-term trading that I increase to 60% to take advantage of the sector's weakness and increase overall risks as natural gas prices are still below $3.
Coterra Energy CEO Tom Jorden said in the conference call:
We had an excellent quarter driven by production beats on oil, natural gas and natural gas liquids. Volumes on all 3 commodities exceeded the high end of our guidance. Our production beat was primarily driven by well productivity that exceeded our expectations. This was true in the Marcellus, Anadarko and the Permian.
Coterra Energy - Balance Sheet History ending Q2'23: The Raw Numbers
| COG |
| Q2'22 |
| Q3'22 |
| Q4'22 |
| Q1'23 |
| Q2'23 |
| Total Revenues in $ Million |
| 2,572 |
| 2,520 |
| 2,280 |
| 1,777 |
| 1,185 |
| Net Income in $ Million |
| 1,229 |
| 1,196 |
| 1,632 |
| 677 |
| 209 |
| EBITDA $ Million |
| 2,023 |
| 1,965 |
| 1,754 |
| 1,255 |
| 684 |
| EPS diluted in $/share |
| 1.52 |
| 1.50 |
| 1.32 |
| 0.88 |
| 0.27 |
| Cash from operations in $ Million |
| 879 |
| 1,771 |
| 1,484 |
| 1,494 |
| 646 |
| Capital Expenditure in $ Million |
| 474 |
| 460 |
| 505 |
| 484 |
| 597 |
| Free Cash Flow in $ Million |
| 405 |
| 1,311 |
| 979 |
| 1,010 |
| 49 |
| Cash and cash equivalent $ Million |
| 1,059 |
| 778 |
| 673 |
| 973 |
| 841 |
| Total Debt (incl. current) In $ Million |
| 3,105 |
| 2,282 |
| 2,181 |
| 2,176 |
| 2,171 |
| Dividend per share in $ per share |
| 0.65 ($0.15 + $0.50) |
| 0.68 ($0.15 + $0.53) |
| 0.57 ($0.37 + $0.20) |
| 0.20 |
| 0.20 |
| The share outstanding diluted in Million |
| 808 |
| 797 |
| 781 |
| 768 |
| 760 |
| Gas Production |
| Q2'22 |
| Q3'22 |
| Q4'22 |
| Q1'23 |
| Q2'23 |
| Gas Equivalent Production in K Boepd |
| 631.7 |
| 641.2 |
| 631.7 |
| 634.9 |
| 664.8 |
| NG price per Mcf |
| 5.78 |
| 6.37 |
| 4.87 |
| 3.31 |
| 1.65 |
Source: Company filings .
Trends, Charts, and Commentary: Revenues, Free Cash Flow, and Gas Production
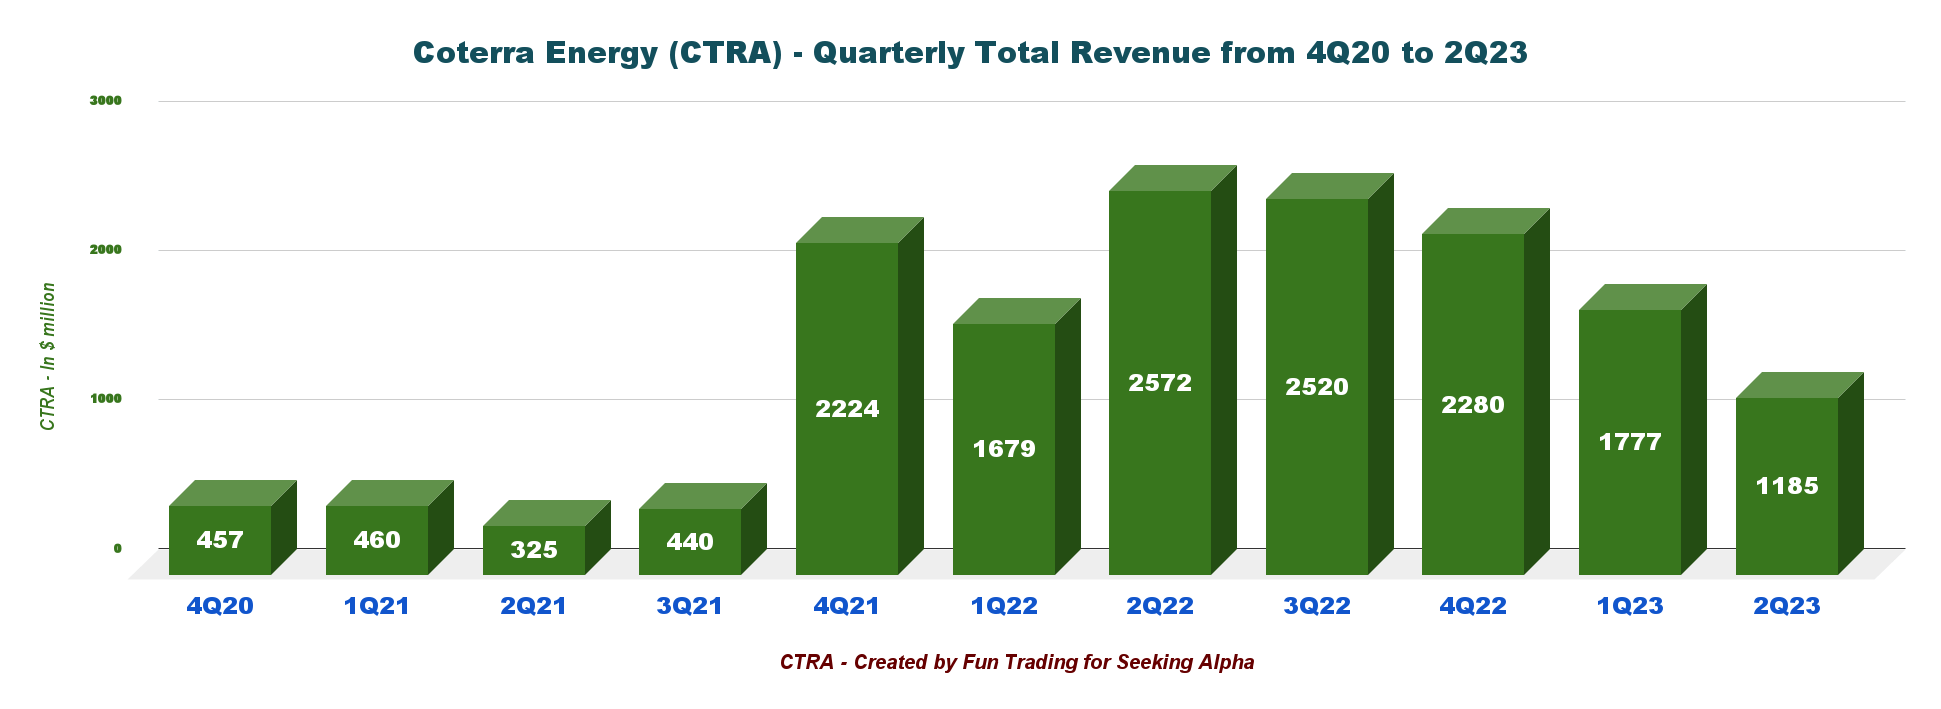
1 - Total Revenues were $1,185 million in Q2'23
CTRA Quarterly Revenues History (Fun Trading)
Coterra Energy recorded quarterly revenues of $1,185 million for the second quarter of 2023, down from $2,572 million in Q2'22 and down 33.3% sequentially.
The net income was $209 million in Q2'23, or $0.27 per diluted share, down 30.9% sequentially. Cash Flow From Operating Activities totaled $646 million in Q2'23 compared to $1,494 million the prior quarter.
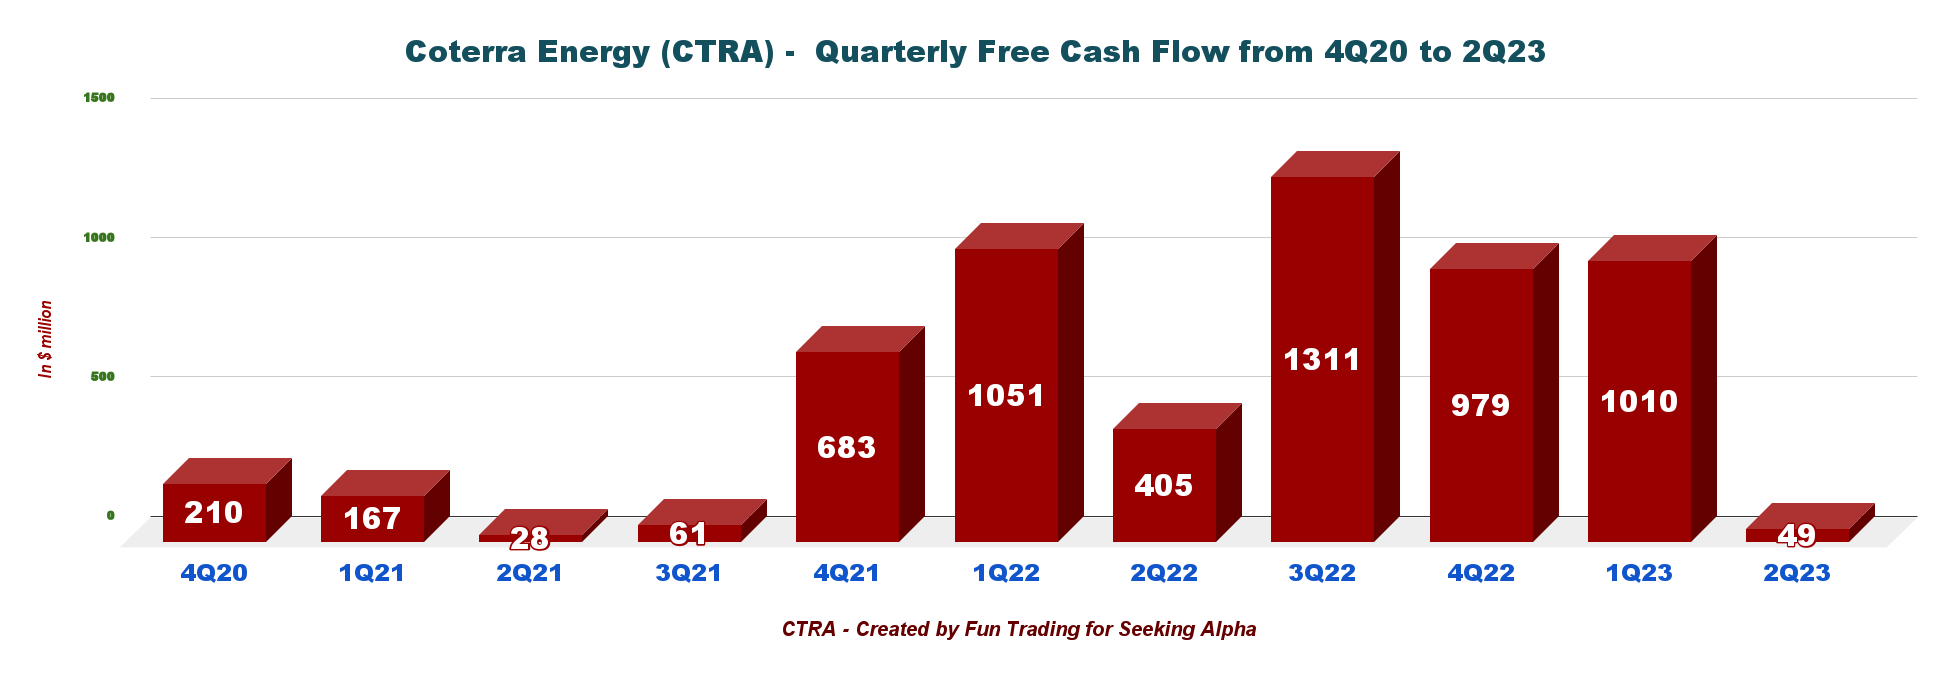
2 - Free cash flow was $49 million in Q2'23
CTRA Quarterly Free Cash Flow History (Fun Trading)
Note: The generic free cash flow is the cash from operations minus CapEx. The company has a different way of calculating the free cash flow. CTRA indicates $113 million in Q2'23 (non-GAAP).
CTRA's free cash flow was $49 million in Q2'23. The trailing 12-month free cash flow TTM was $3,349 million .
Coterra's Board of Directors approved a quarterly dividend of $0.20 per share this quarter, a big slide from the preceding quarter.
During the quarter, the Company repurchased 2.4 million shares for $57 million at an average price of $23.55 per share, leaving $1.7 billion remaining on the $2.0 billion share repurchase authorization as of June 30, 2023.
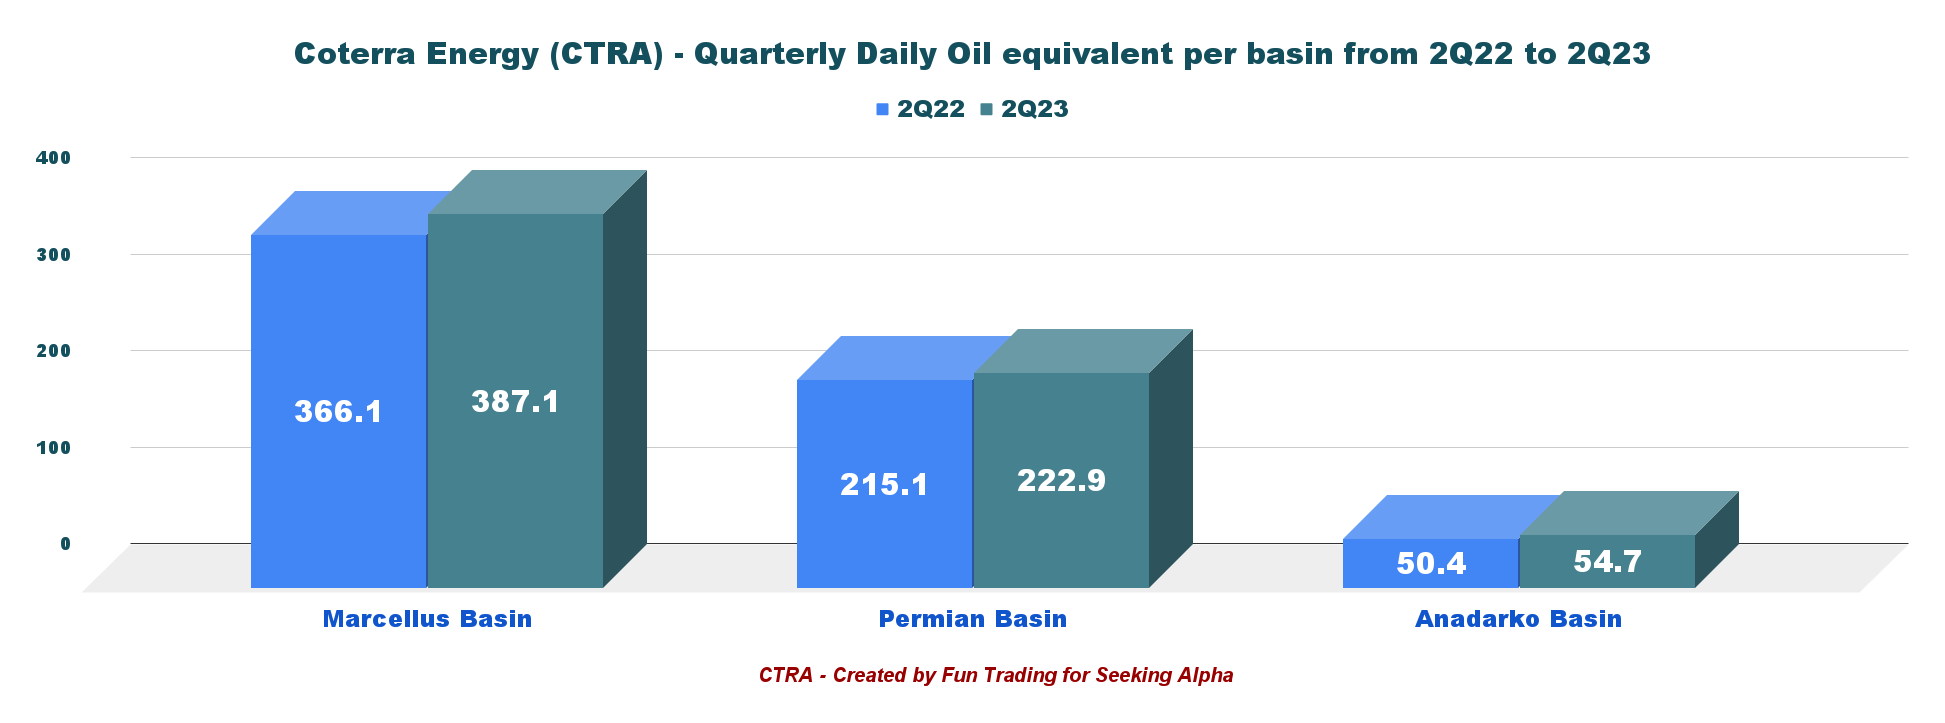
3 - Quarterly Oil Equivalent production
Coterra Energy operates in three different basins in the USA. Production was higher YoY, as shown in the chart below.
CTRA Quarterly Production 2Q22 versus Q2'23 (Fun Trading)
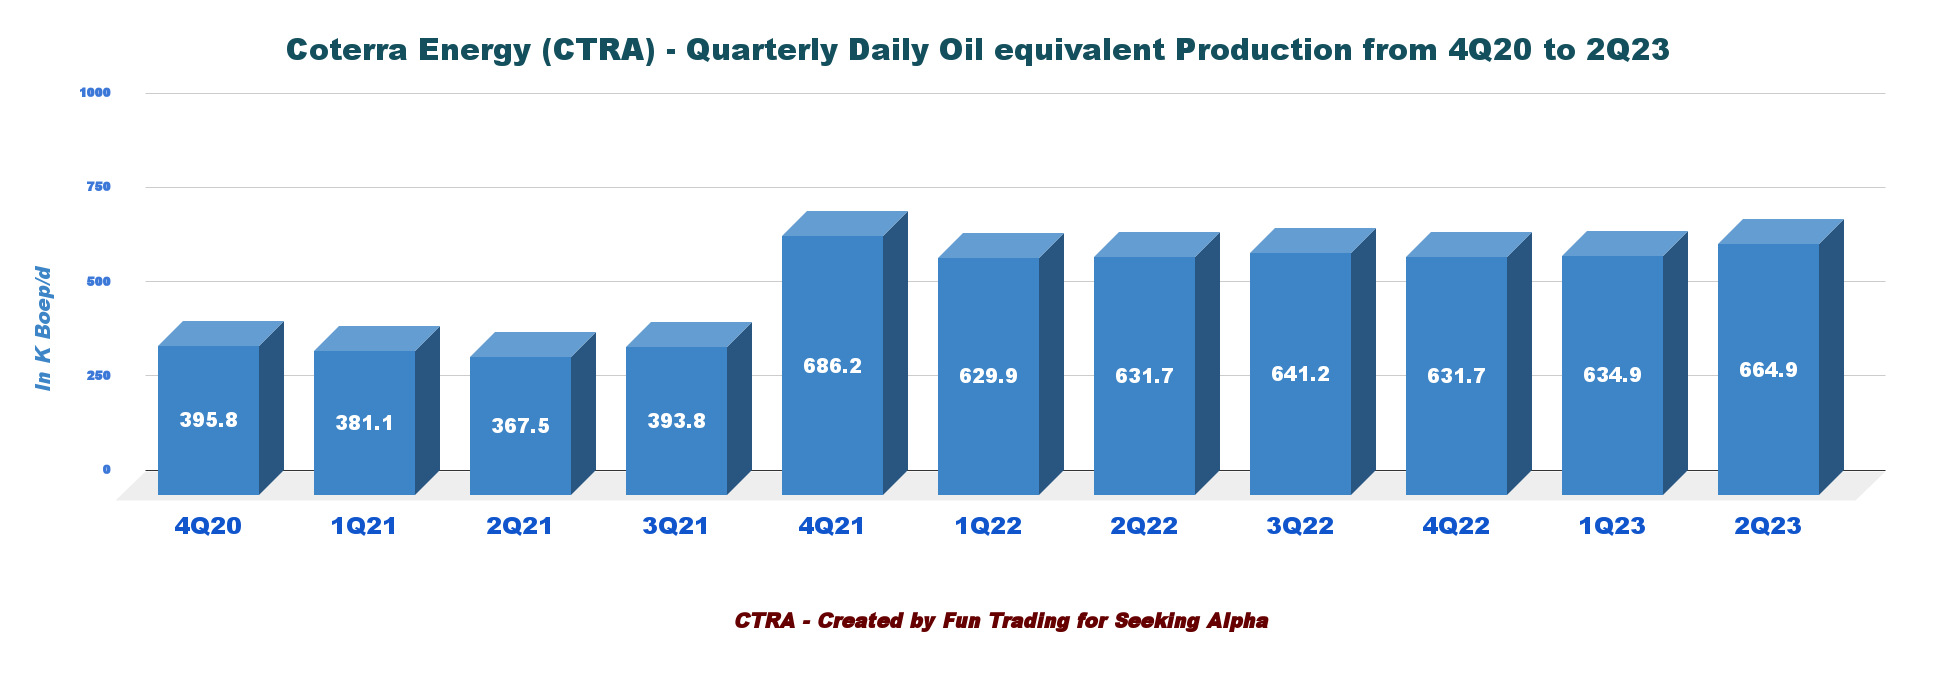
Coterra Energy produced 664.9K Boepd in Q2'23, up from 631.7K Boepd in Q2'22. Unit operating cost totaled $8.27 per BOE in Q2'23, within the company's annual guidance range of $7.30-$9.40 per BOE.
CTRA Quarterly Daily Oil Equivalent Production History (Fun Trading)
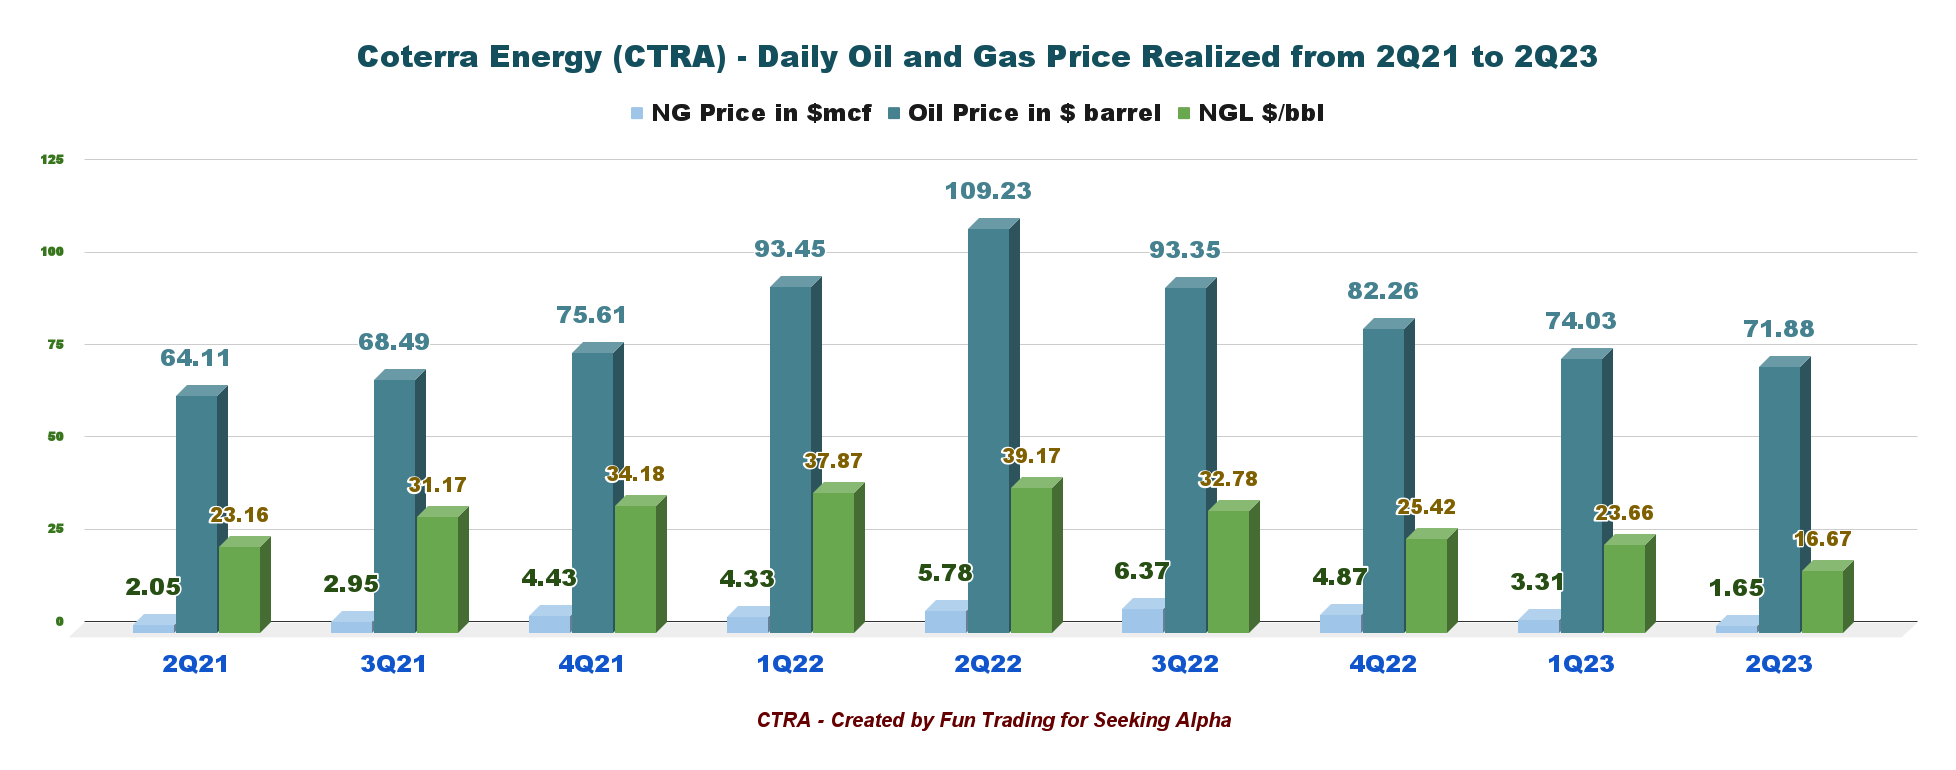
The average realized natural gas price increased to $1.65/Mcf from the year-ago quarter's $5.78. The oil price was $71.88 per barrel , and NGL was $16.67 per barrel equivalent . Those prices exclude the effect of commodity derivatives
We can easily see how commodity prices have affected revenues and free cash flow.
CTRA Quarterly Oil, NGL, NG Prices History (Fun Trading)
4 - Net Debt is $1,330 million as of Q2'23
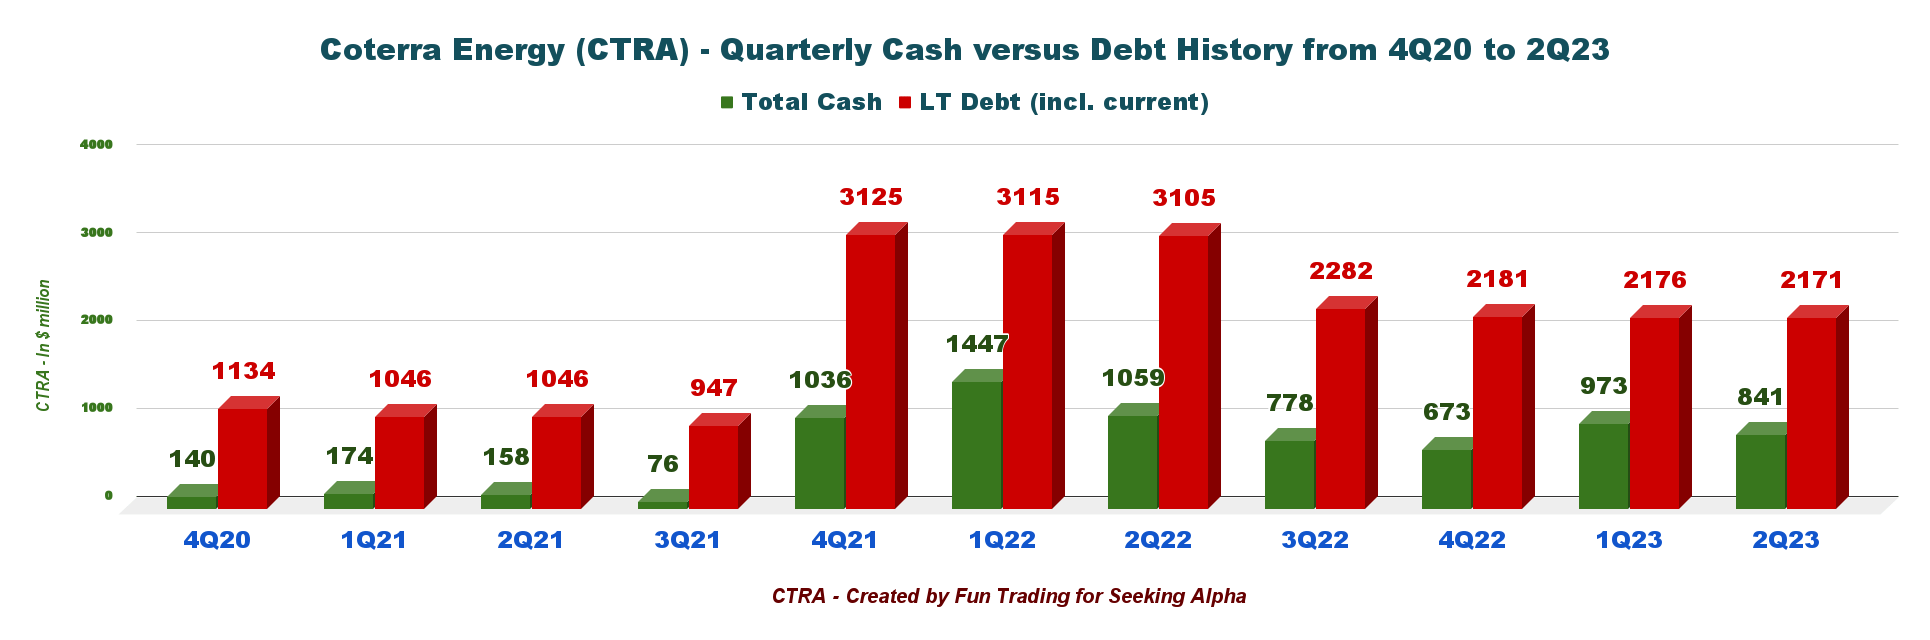
CTRA Quarterly Cash versus Debt History (Fun Trading)
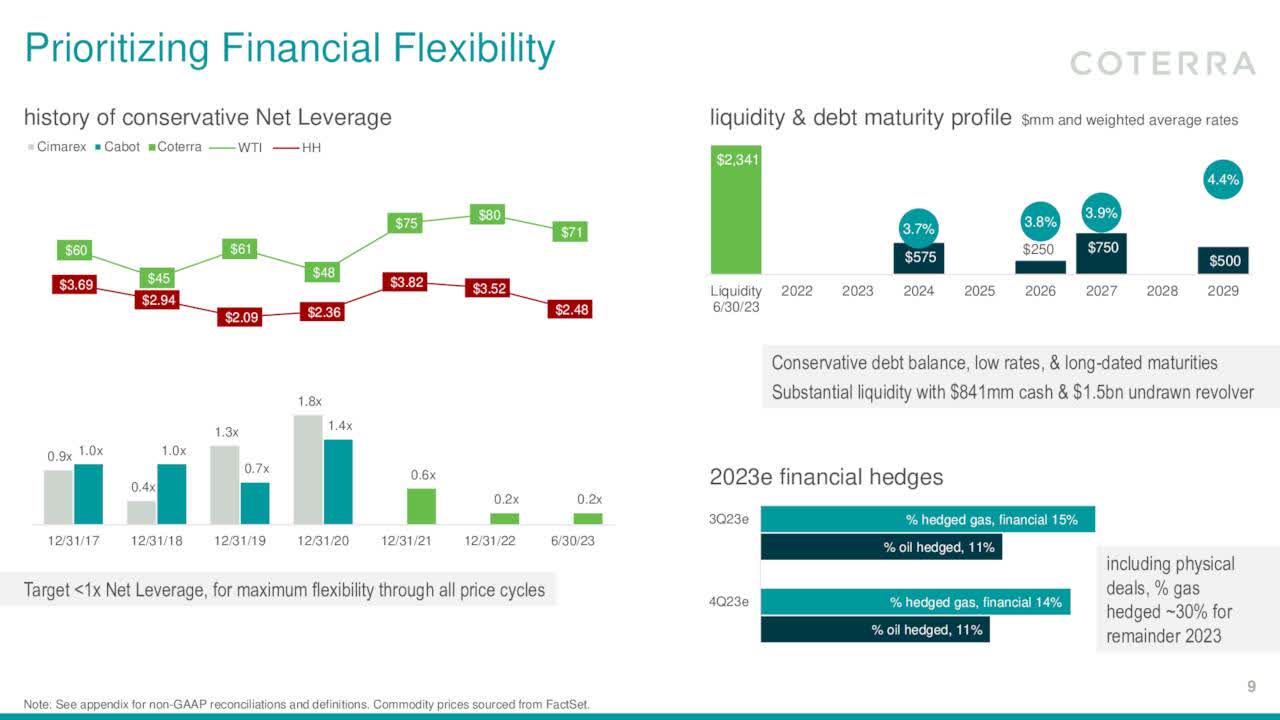
On June 30, 2023, Coterra Energy indicated a total debt of $2,171 million (including current) and cash on hand of $841 million . CTRA has No debt outstanding under its $1.5 billion five-year revolving credit facility and no near-term debt maturities.
Liquidity is $2.341 billion . The company also indicates its 2023 Hedge with about 15% NG hedged and 17% Oil hedged in Q3'23.
Coterra's net debt to trailing twelve months Adjusted EBITDAX ratio at June 30, 2023 was 0.2x .
CTRA Balance Sheet (CTRA Presentation)
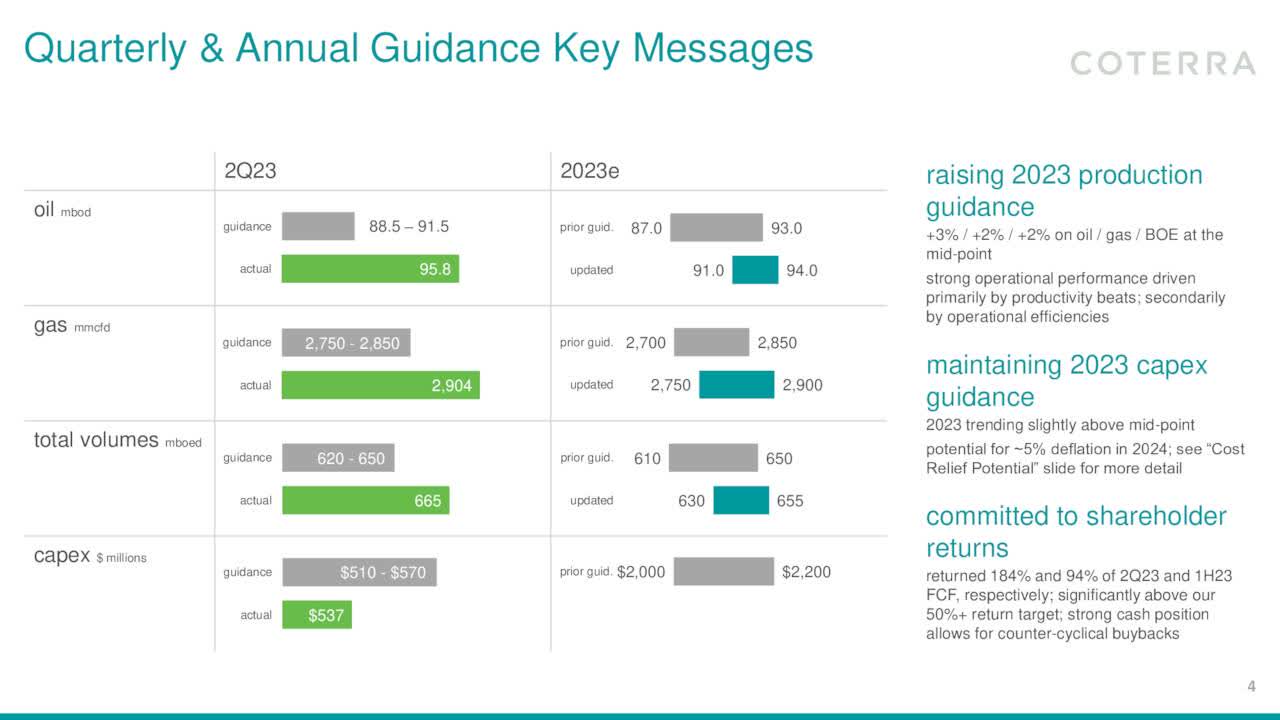
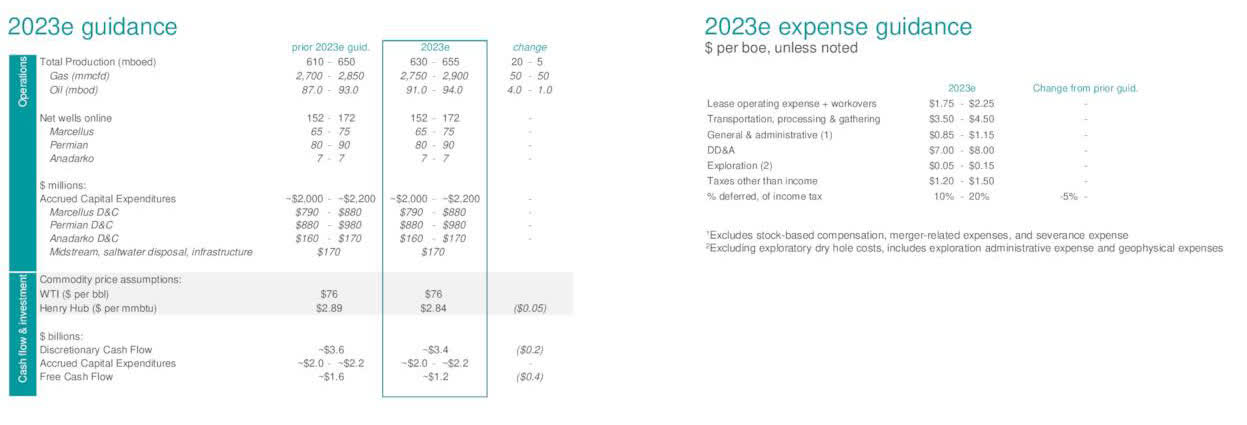
5 - 2023 Outlook raised
For 2023, Coterra Energy forecasts a 630-655K Boepd production, up from 610-650K Boepd indicated in the prior quarter.
CapEx is expected to be between $2 billion and $2.2 billion , unchanged from the preceding quarter.
CTRA 2023 Guidance (CTRA Presentation)
The company also indicated a Q3'23 outlook with oil and NG prices estimated at $76 per barrel and $2.84 per Mcf.
Third-quarter 2023 production and CapEx:
- Total production volumes of 625-655K Boepd, down 3.8% sequentially.
- Oil production of 88.0-91.0K Bopd
- Natural gas production of 2,775-2,875 MMcfpd
- Expect capital expenditures (accrual basis) of $540 - $610 million
CTRA Annual Guidance (CTRA Presentation)
Technical Analysis Short Term and Commentary
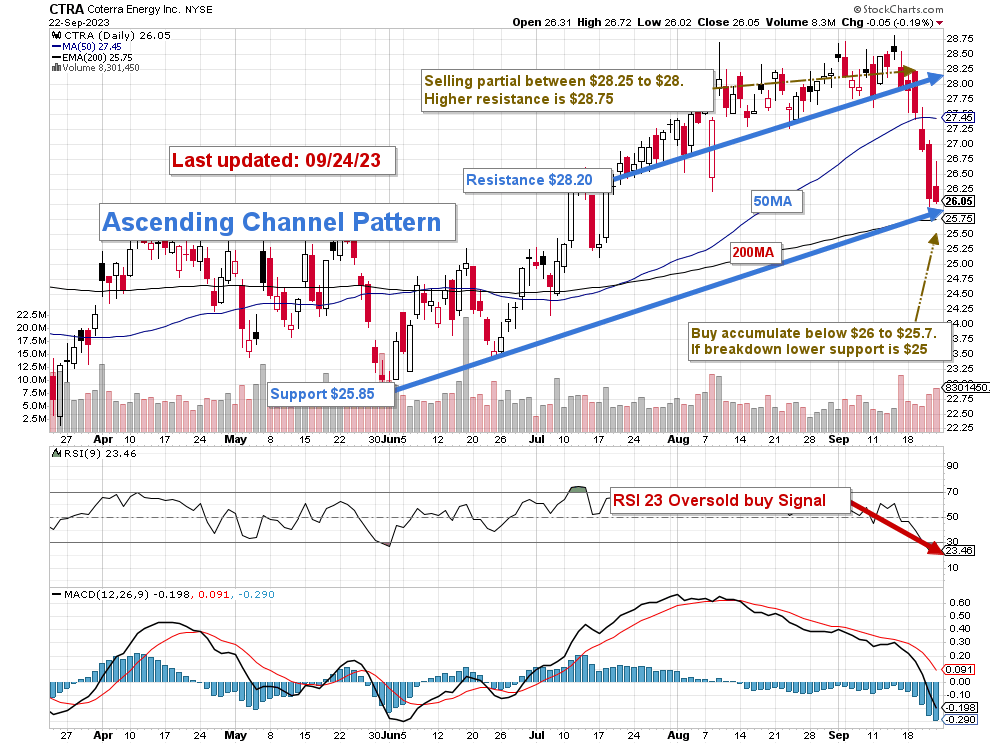
CTRA TA Chart (Fun Trading StockCharts)
Note: The chart is adjusted for the dividend.
CTRA forms an ascending channel pattern with resistance at $28.20 , support at $25.85 , and mid-resistance/support at $27.25 (50MA). RSI is 23 , a strong buy signal that suggests we have now reached a possible solid support.
Ascending channel patterns or rising channels are short-term bullish in that a stock moves higher within an ascending channel, but these patterns often form within longer-term downtrends as continuation patterns. The ascending channel pattern is often followed by lower prices, but only after a downside penetration of the lower trend line.
The trading strategy is to sell about 60% of your position between $28.25 and $28 , with a potential higher resistance of $28.75 . Conversely, I recommend buying and accumulating CTRA between $26 and $25.7 , with possible lower support at around $25 .
Warning: The TA chart must be updated frequently to be relevant. It is what I am doing in my stock tracker. The chart above has a possible validity of about a week. Remember, the TA chart is a tool only to help you adopt the right strategy. It is not a way to foresee the future. No one and nothing can.
For further details see:
Coterra Energy: A Little Too Gassy For My Liking