CTRA - Coterra Energy: Lower Natural Gas Prices Could Hurt The Stock The Next Quarter
2023-06-12 04:35:13 ET
Summary
- Coterra Energy recorded quarterly revenues of $1,777 million for the first quarter of 2023, up from $1,679 million in 1Q22 but down 22.1% sequentially.
- Coterra Energy produced 634.9K Boep/d in 1Q23, up from 631.7K Boep/d in 4Q22.
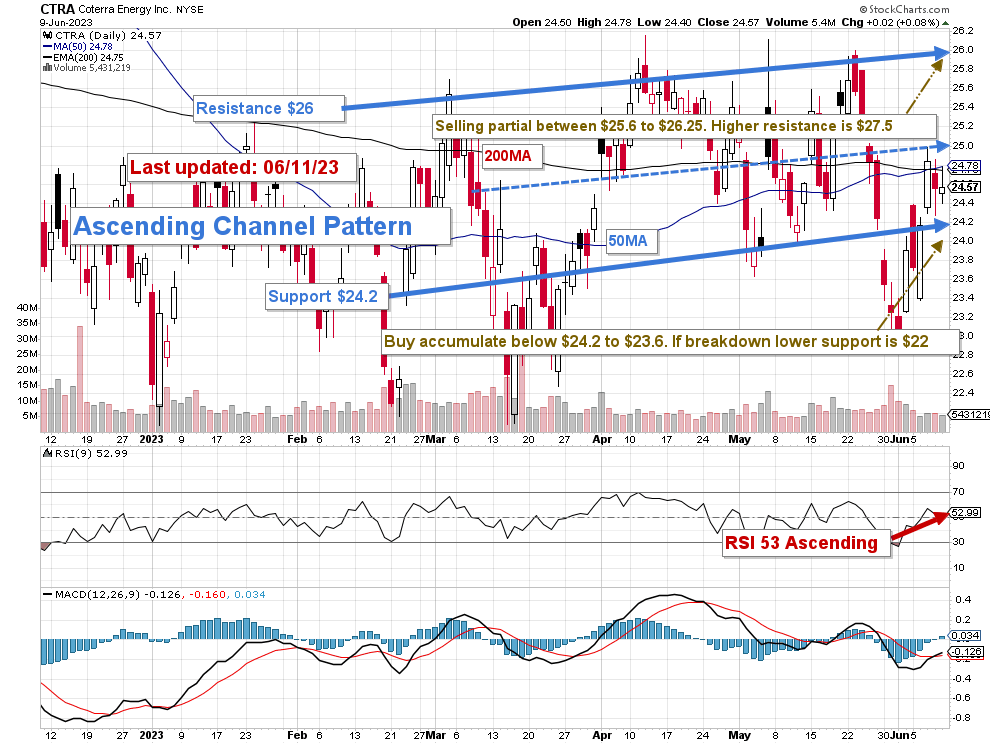
- I recommend buying and accumulating CTRA between $24.2 and $23.6, with possible lower support at around $22.
Introduction
Houston-based Coterra Energy ( CTRA ) released its first-quarter 2023 results on May 4, 2023.
Note: I have followed CTRA quarterly since October 2017 (Cabot Oil). This new article updates my article published on February 6, 2023.
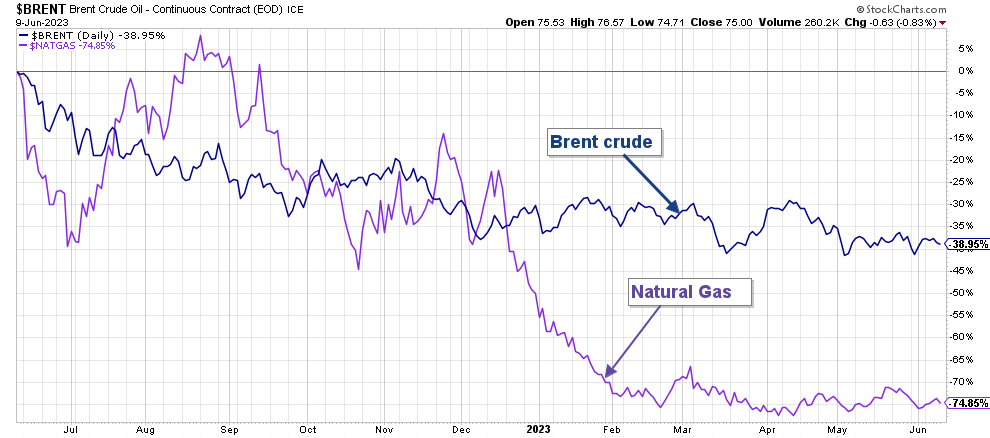
After a great 2022, Coterra Energy struggled with a bearish trend in oil and especially natural gas prices. Oil and natural gas prices have dropped significantly since their peak in 2022, as shown in the chart below.
CTRA 1-Year Chart Brent versus NG (Fun Trading StockCharts)
1 - Presentation
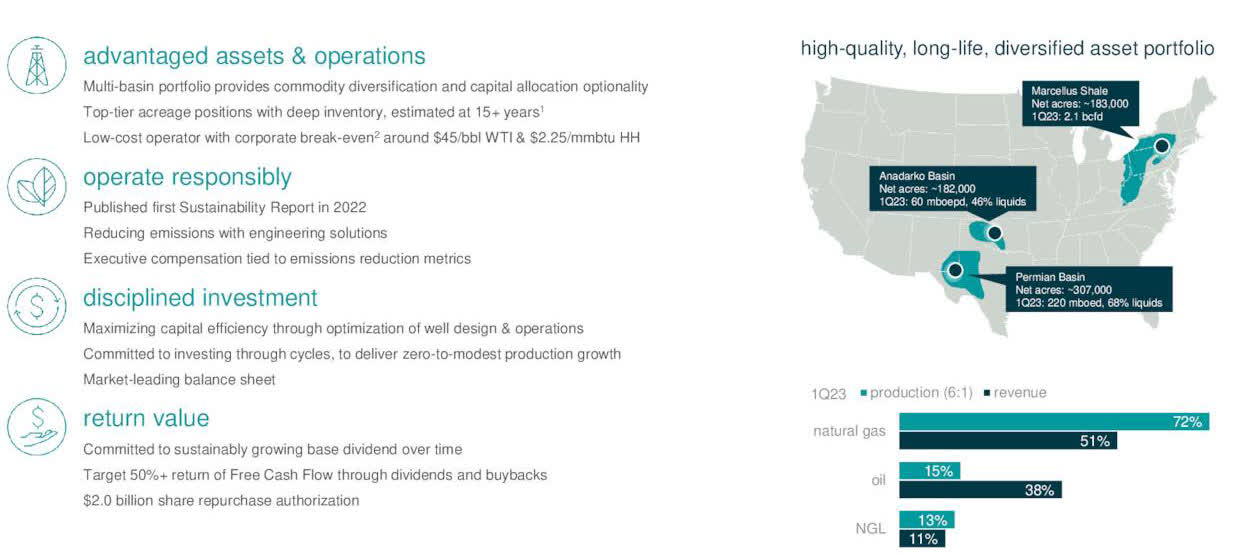
The company's production is primarily natural gas and natural gas liquid, representing 85.4% of the total output, leaving only 14.6% for oil. Thus, the company is mainly highly sensitive to the price of natural gas.
CTRA Map Presentation (CTRA Presentation)
The company exclusively produces Oil, NGL, and natural gas from three US basins ( Marcellus , Permian , and Anadarko ).
2 - Stock performance
I cover Coterra Energy and Chesapeake Energy ( CHK ) in this segment. Both companies dropped significantly from their high. CTRA underperformed CHK on a one-year basis and is now down nearly 30% YoY.
3 - Investment Thesis
The investment thesis has changed for Coterra Energy as oil and gas prices continue to correct from the exceptional year 2022.
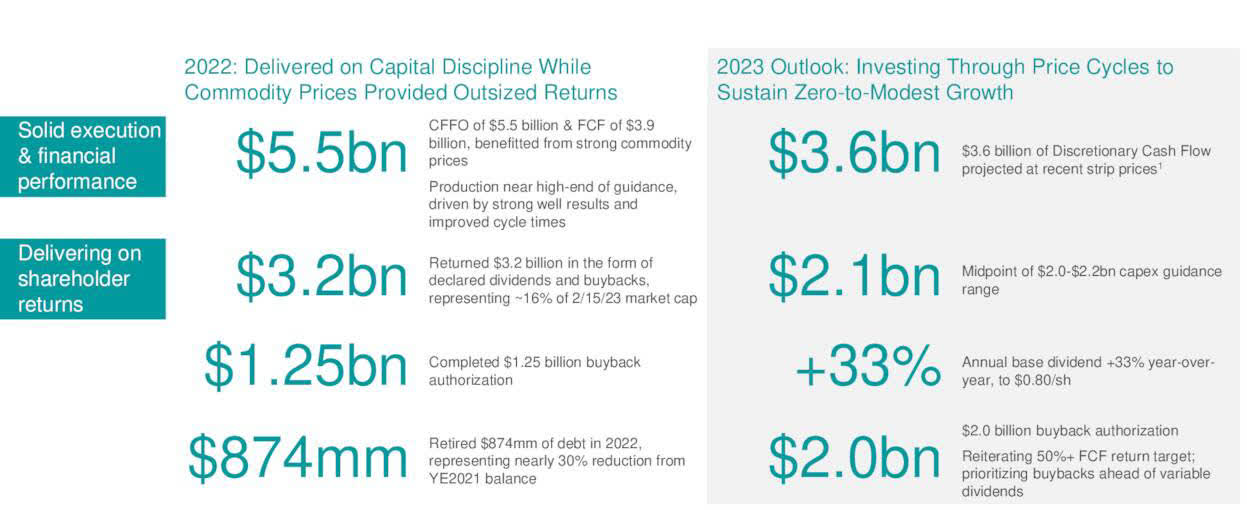
However, as we will see later in this article, Coterra managed a solid quarter with over $1 billion in free cash flow despite natural gas prices averaging $3.31 per Mcf, showing strong resilience, good management, and a sound strategy. The company completed a $1.25 billion buyback and retired $874 million in Debt in 2022.
Thus, I recommend a long-term CTRA position combined with active short-term trading that I increase to 60% to take advantage of the sector's weakness and slightly increase overall risks as natural gas prices are now well below $3.
Coterra Energy CEO Tom Jorden said in the conference call:
Coterra had an excellent first quarter. We delivered on all fronts, Production at the high end of our guidance, capital within our targeted front-loaded cadence and significant progress on our buyback. These results were driven by outstanding asset performance, a recurring trend you should expect from Coterra.
Coterra Energy - Balance Sheet History ending 1Q23: The Raw Numbers
| COG |
| 1Q22 |
| 2Q22 |
| 3Q22 |
| 4Q22 |
| 1Q23 |
| Total Revenues in $ Million |
| 1,679 |
| 2,572 |
| 2,520 |
| 2,280 |
| 1,777 |
| Net Income in $ Million |
| 608 |
| 1,229 |
| 1,196 |
| 1,632 |
| 677 |
| EBITDA $ Million |
| 1,159 |
| 2,023 |
| 1,965 |
| 1,754 |
| 1,255 |
| EPS diluted in $/share |
| 0.74 |
| 1.52 |
| 1.50 |
| 1.32 |
| 0.88 |
| Cash from operations in $ Million |
| 1,322 |
| 879 |
| 1,771 |
| 1,484 |
| 1,494 |
| Capital Expenditure in $ Million |
| 271 |
| 474 |
| 460 |
| 505 |
| 484 |
| Free Cash Flow in $ Million |
| 1,051 |
| 405 |
| 1,311 |
| 979 |
| 1,010 |
| Cash and cash equivalent $ Million |
| 1,447 |
| 1,059 |
| 778 |
| 673 |
| 973 |
| Total Debt (incl. current) In $ Million |
| 3,115 |
| 3,105 |
| 2,282 |
| 2,181 |
| 2,176 |
| Dividend per share in $ per share |
| 0.60 |
| 0.65 ($0.15 + $0.50) |
| 0.68 ($0.15 + $0.53) |
| 0.57 ($0.37 + $0.20) |
| 0.20 |
| The share outstanding diluted in Million |
| 814 |
| 808 |
| 797 |
| 781 |
| 768 |
| Gas Production |
| 1Q22 |
| 2Q22 |
| 3Q22 |
| 4Q22 |
| 1Q23 |
| Gas Equivalent Production in K Boepd |
| 629.9 |
| 631.7 |
| 641.2 |
| 631.7 |
| 634.9 |
| NG price per Mcf |
| 4.33 |
| 5.78 |
| 6.37 |
| 4.87 |
| 3.31 |
Source: Company filings.
Trends, Charts, and Commentary: Revenues, Free Cash Flow, and Gas Production
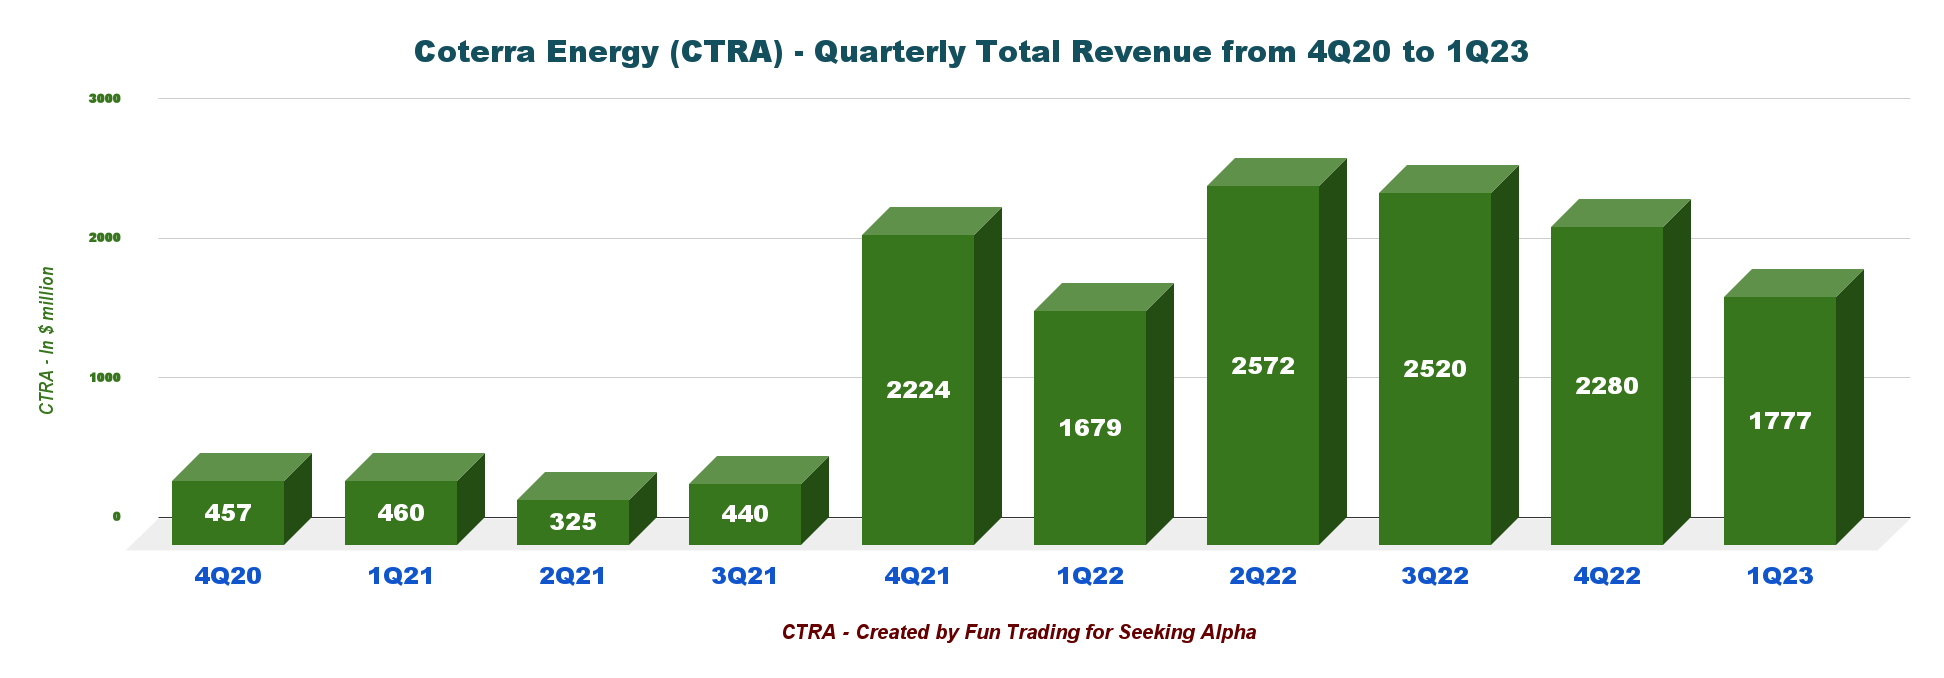
1 - Total Revenues were $1,777 million in 1Q23
CTRA Quarterly Revenue History (Fun Trading)
Coterra Energy recorded quarterly revenues of $1,777 million for the first quarter of 2023, up from $1,679 million in 1Q22 but down 22.1% sequentially.
The net income was $677 million in 1Q23, or $0.88 per diluted share, down 58.5% sequentially.
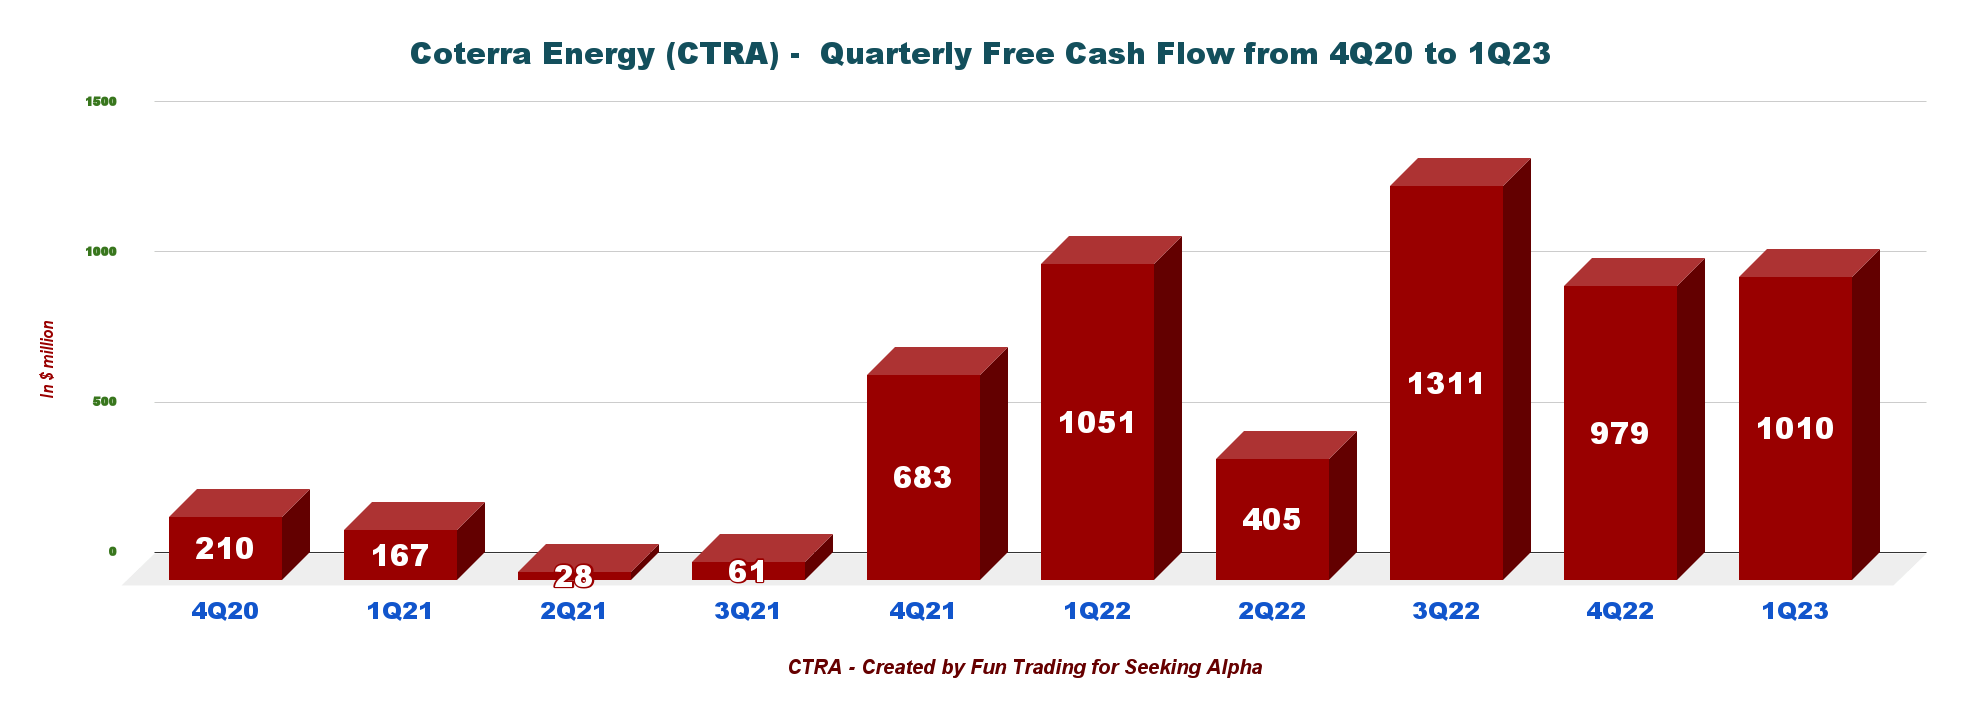
2 - Free cash flow was $1,010 million in 1Q23
CTRA Quarterly Free Cash Flow History (Fun Trading)
Note: The generic free cash flow is the cash from operations minus CapEx. The company has a different way of calculating the free cash flow. CTRA indicates $556 million in 1Q23 (non-GAAP).
CTRA's free cash flow was $1,010 million in 1Q23. The trailing 12-month free cash flow TTM was $3,705 million.
Coterra's Board of Directors approved a quarterly dividend of $0.20 per share this quarter, a big slide from the preceding quarter.
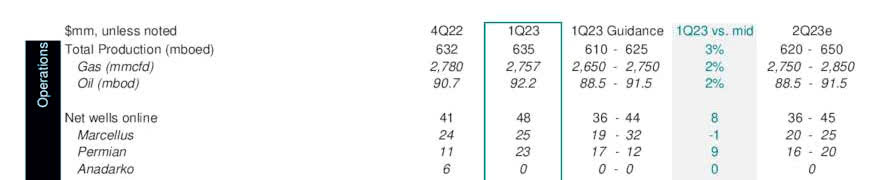
3 - Quarterly Oil Equivalent production
Coterra Energy operates in three different basins in the USA. Production was solid and comparable to 4Q22.
CTRA Quarterly Production per Basin 4Q22 versus 1Q23 (Fun Trading)
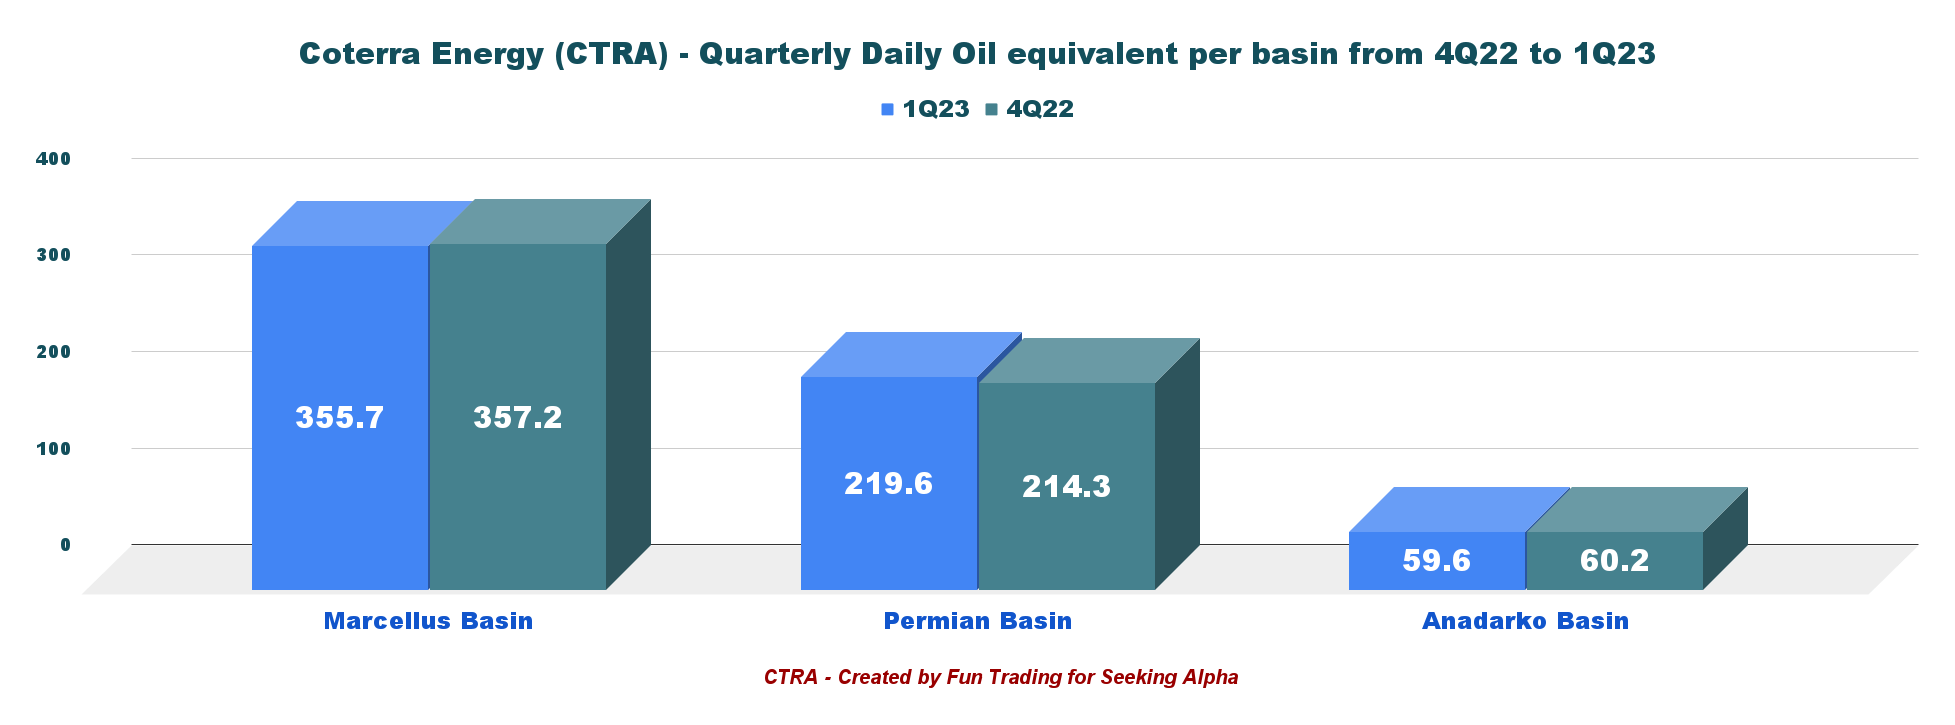
Coterra Energy produced 634.9K Boep/d in 1Q23, up from 631.7K Boep/d in 4Q22.
CTRA Quarterly Production History (Fun Trading)
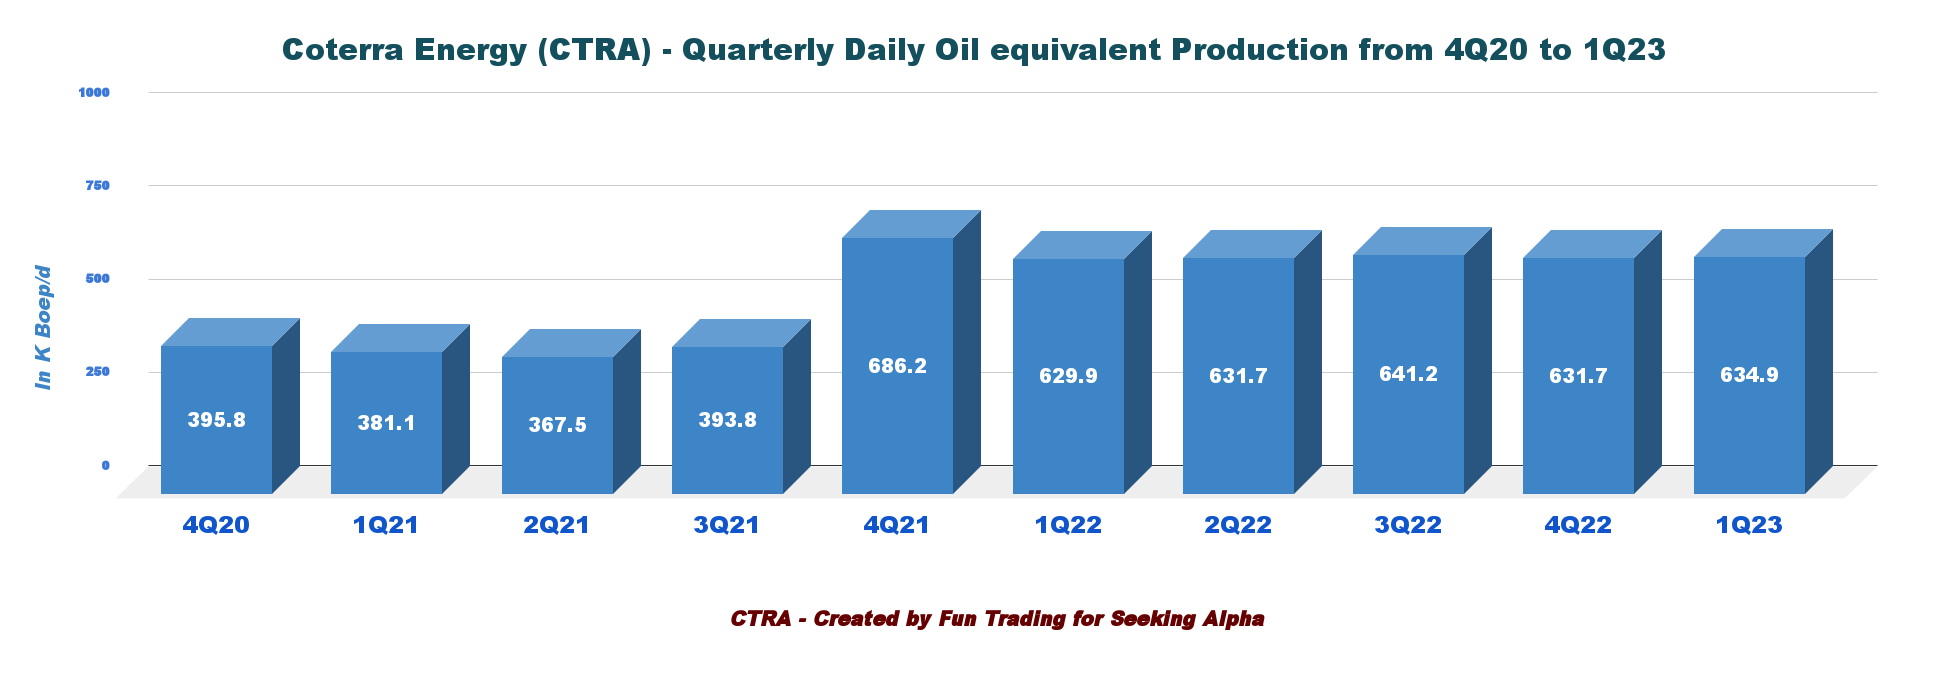
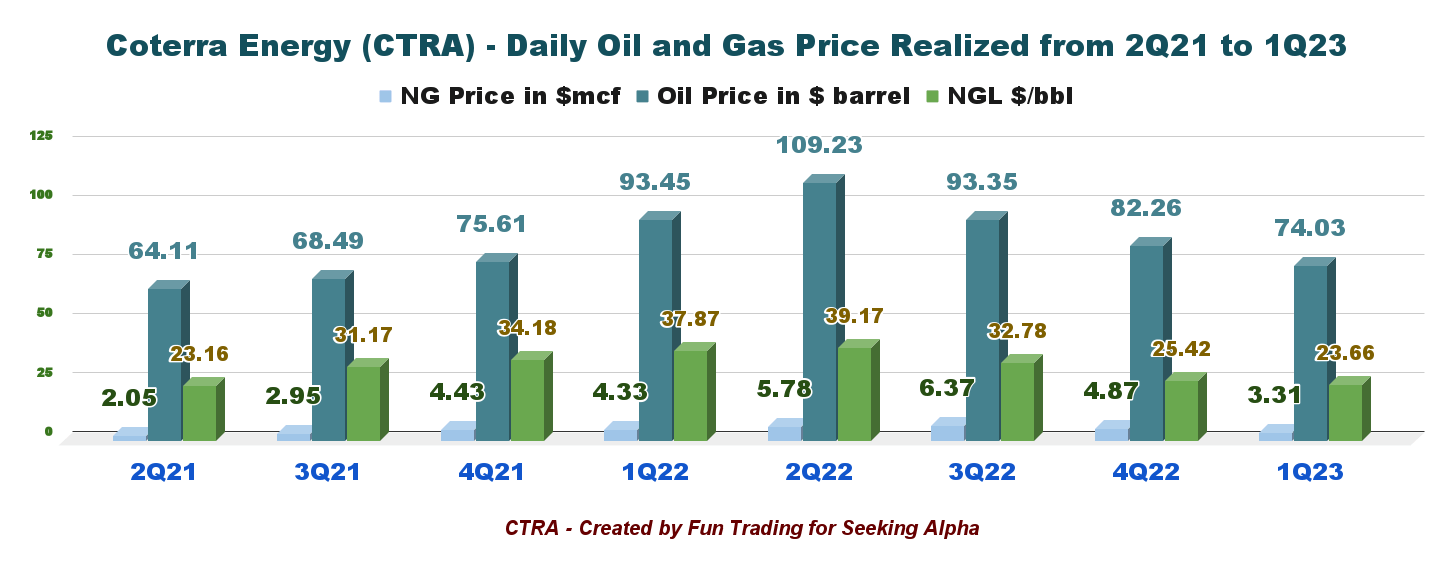
The average realized natural gas price increased to $3.31/Mcf from the year-ago quarter's $4.33. The oil price was $74.03 per barrel , and NGL was $23.66 per barrel equivalent.
4 - Net Debt is $1.203 billion as of 1Q23
CTRA Quarterly Cash versus Debt History (Fun Trading)
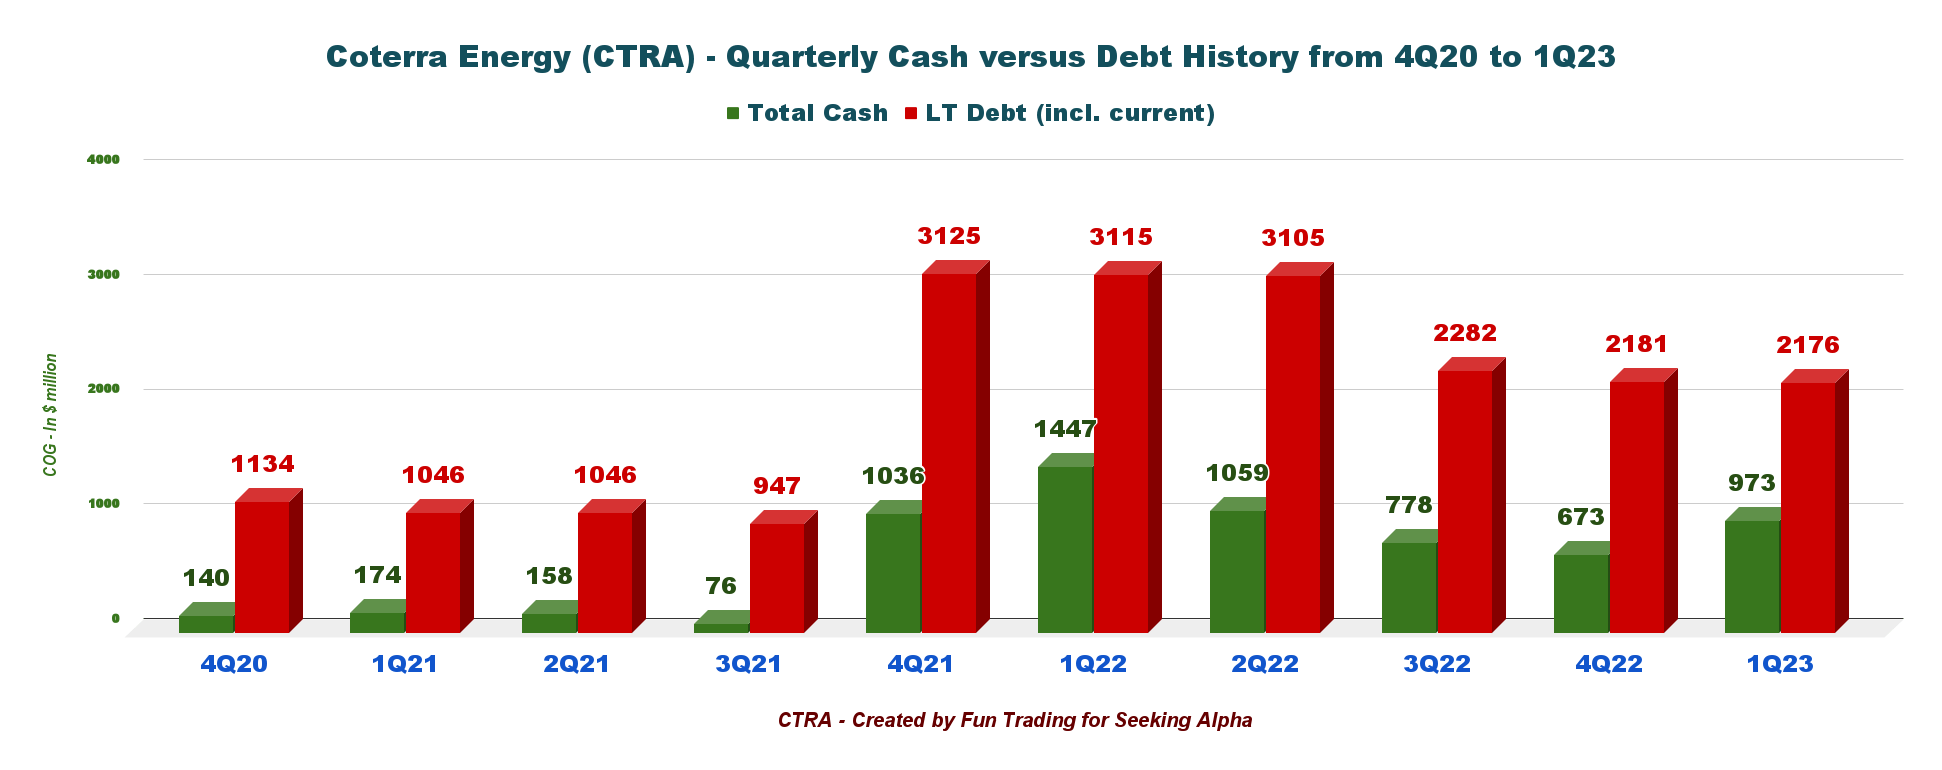
On March 31, 2023, Coterra Energy indicated a total debt of $2,176 million (including current) and cash on hand of $973 million.
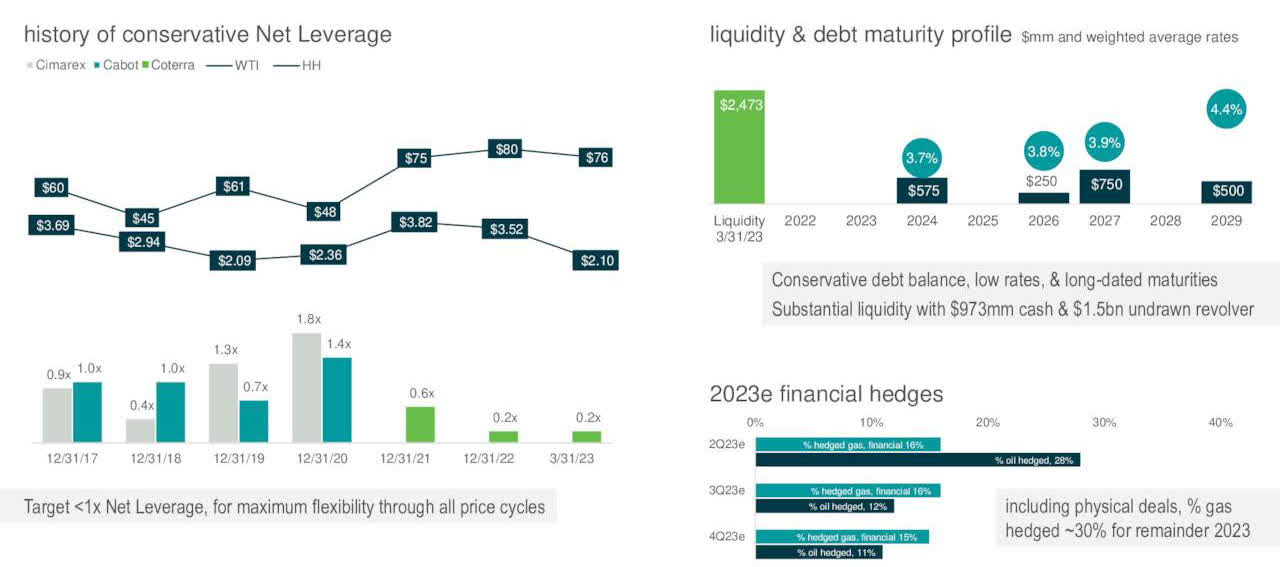
Liquidity is $2.473 billion. The company is also indicating its 2022 Hedge summary below:
CTRA Balance Sheet (CTRA Presentation)
5 - 2023 Outlook
For 2023, Coterra Energy forecasts production of 610-650K Boep/d .
CapEx is expected to be between $2 billion and $2.2 billion.
CTRA 2023 Guidance (CTRA Presentation)
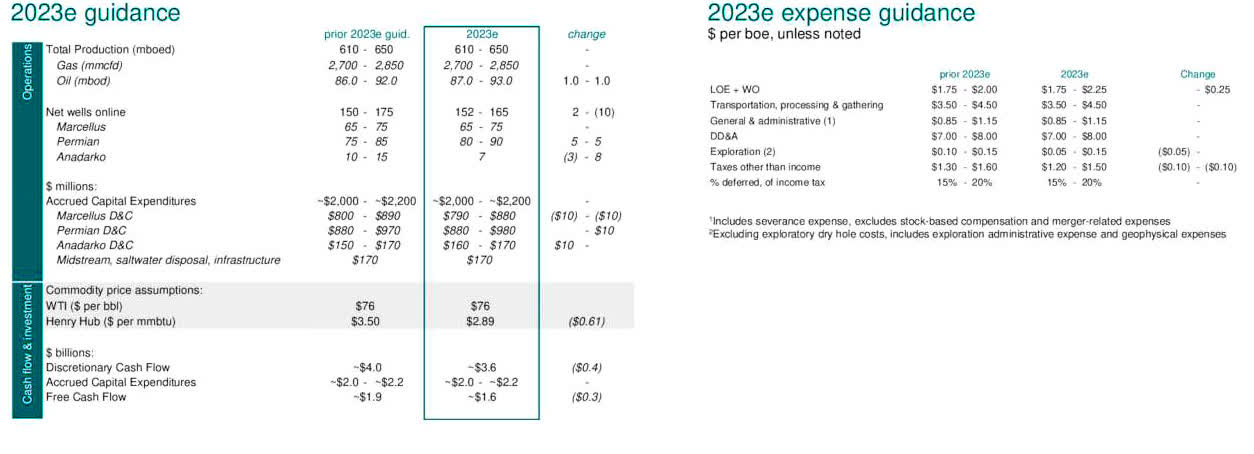
The company also indicated a 2Q23 outlook with oil and NG prices estimated at $77 per barrel and $2.23 per Mcf. Production for 2Q23 will be between 620K and 650K Boep/d, unchanged sequentially, with oil production between 88.5K and 91.5K Bop/d .
Technical Analysis Short Term and Commentary
CTRA TA Chart Short-Term (Fun Trading StockCharts)
Note: The chart is adjusted for the dividend.
CTRA forms an ascending channel pattern with resistance at $26, support at $24.2, and mid-resistance/support at $25.
Ascending channel patterns or rising channels are short-term bullish in that a stock moves higher within an ascending channel, but these patterns often form within longer-term downtrends as continuation patterns. The ascending channel pattern is often followed by lower prices, but only after a downside penetration of the lower trend line.
The trading strategy is to sell about 60% of your position between $25.6 and $26.25, with potential higher support at $27.5. Conversely, I recommend buying and accumulating CTRA between $24.2 and $23.6, with possible lower support at around $22.
Warning: The TA chart must be updated frequently to be relevant. It is what I am doing in my stock tracker. The chart above has a possible validity of about a week. Remember, the TA chart is a tool only to help you adopt the right strategy. It is not a way to foresee the future. No one and nothing can.
For further details see:
Coterra Energy: Lower Natural Gas Prices Could Hurt The Stock The Next Quarter