CPNG - Coupang: Good Company At An Expensive Price
Summary
- Dubbed the “Amazon of South Korea”, Coupang is the leading e-commerce player in the country. In just 12 years since its launch, the company has grown leaps and bounds.
- With a trifecta of product proliferation, expansion of service offerings and international expansion, Coupang is well poised to maintain a healthy revenue CAGR of 19% over the next 6 years.
- My DCF model results in an intrinsic value of $12/share, which makes the CPNG stock overpriced by ~30% vs. its current price of $15.65 as of February 10, 2023.
- Coupang is a classic tale of a good company but at an expensive price. I believe it would be prudent to enter the stock at a price below $10/share.
Company Overview
Coupang ( CPNG ) is the leading e-commerce provider in South Korea. It started operations as a marketplace seller in 2010 and then, added the first party seller model (owning inventory) in 2013. The company started its own delivery service, called “Rocket delivery”, in 2014. In 2019, Coupang launched its loyalty program ((WOW)) as well as its food delivery service “Coupang Eats” (similar to Uber Eats). Coupang went public in the US in March 2021 at a valuation of ~$60 billion, up significantly from $9 billion at its last fundraising round in 2018.
Dubbed the “Amazon of South Korea”, Coupang bears an uncanny resemblance to its larger counterpart. This is most evident in its focus on customer experience, product categories it has ventured into, investing in its own delivery service, offering a loyalty program, and venturing into fintech and video content as well. This resemblance is not surprising given the large number of ex-Amazonians in senior leadership positions at Coupang. In fact, in some ways, one can argue that Coupang has been innovating ahead of Amazon (AMZN), in offering services like 1-day delivery on 100% of orders, boxless packaging options, and frictionless returns.
While its core focus remains on the South Korean market, Coupang has started to venture outside the country. The company now aligns its business under two operating segments - product commerce (Korean retail & marketplace) and growth initiatives (Coupang Eats, Coupang Play, international, fintech). Driven by a general growth of the retail market in Korea, an increasing e-commerce market share, and an ARPU increase from its core customer base, Coupang is experiencing strong top-line growth. The company seems to have a clear focus on execution and turning cash flow positive, and has lately been ahead of its internal targets towards achieving profitability.
While the company is doing great, its stock appears expensive at the moment. Hence, I recommend to hold off at the moment and await a prudent entry point.
Valuation Storyline
For valuing Coupang, I would focus on four key factors here – total addressable market ((TAM)) and revenue growth, operating margins, re-investments required to generate growth, and cost of capital. My thoughts on each of these dimensions are provided below. Note that though the vast majority of Coupang’s sales are in Korean Won, it reports its financial results in USD. This valuation has also been done in USD, using a USD/KWN exchange rate of 1,155 KWN per USD (average exchange rate 2017-2022).
Total Addressable Market and revenue growth
Coupang has demonstrated a disciplined growth mindset. The company has been growing its topline astonishingly well for the past 6 years, going from revenues of $1,675 million in 2016 to $20,333 million in the trailing twelve-month ((TTM)) period, at a CAGR of 51.6%.
I believe Coupang’s future revenue growth is likely to come from its expansion across three vectors. The first dimension is product expansion. Coupang is likely to launch additional product categories and expand its selection of private label goods, which typically generate higher gross margins. Secondly, the company is likely to continue expanding its service offerings. Quick commerce, fintech (wallet, Buy Now Pay Later), Coupang Eats, and Coupang Play are some of the areas of focus. Finally, it will double down on its geographic expansion outside South Korea, targeting South-east Asian countries like Taiwan, Japan, Singapore, Malaysia, and Indonesia.
Korean e-commerce market size was at $181 billion in 2022 , and is expected to register a CAGR of 11% over the next 6 years. This would translate into a market size of $340 billion by 2028. The current market share of Coupang in the Korean e-commerce market is ~11%. With the product and service offering expansion mentioned above, it is assumed that Coupang will increase its strength in the Korean market and reach a 15% market share by 2028. The Korean e-commerce market is somewhat fragmented and has recently seen inroads from Shopify (SHOP), Meta Platforms (META), and other players. On the international front, it is assumed that Coupang will expand into Taiwan, Japan, Singapore, Malaysia and Indonesia, gaining 3% share in Taiwan, 2% in Singapore and 1% in the rest by 2028. This would equate to revenues of $4.9 billion from these markets by 2028. Assuming 3% of its total revenues coming from other revenue streams (same as current), this would translate into revenues of ~$57 billion by 2028. This would also equate to a 19% top-line CAGR for the next 6 years, which is expected to be the high growth period for Coupang. Revenue growth is projected to be at 30% for the next 12 months, with the growth rate slowing over the next 6 years to hit the risk-free rate of 3.7% for 2029 and beyond.
Operating margins
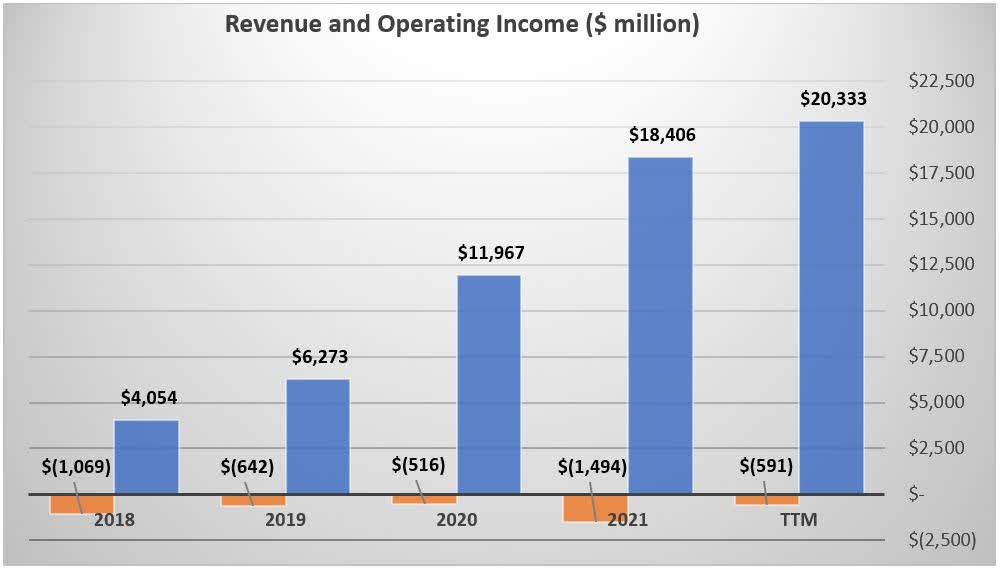
Coupang is one of the few start-ups which have demonstrated strong top-line growth in tandem with a clear focus on profitability. Though still negative, the operating margins have improved from -26.4% in 2018 to -2.9% in TTM. I assume that the company will continue to grow its margins steadily given additional accretive offerings and an entrenched customer base. This is likely to translate into gross margin expansion to 29% from the current 23% by 2028 as well as a decrease in operating expenses to 21% from the current 23.7% by 2028. Together, this means the company's operating margins will steadily improve to reach 8% by 2028, which is almost 2X industry median. Figure 1 below depicts the historic revenues and operating income for Coupang.
Figure 1: Revenue and Operating Income
Created by author from company's 10-K filings
Re-investments required
To achieve the above-outlined growth, Coupang will have to continue investing, primarily in technology and infrastructure, both domestically and internationally. However, I believe the rate of investment required domestically will gradually decline given the large Korean footprint already in place, and the underutilization of the current fresh infrastructure. Therefore, I expect that the company's re-investment needs in net capex will gradually reduce from the current 2.9% of revenues to 2% of revenues by 2028. Similarly, its re-investment needs in non-cash working capital will decrease from the current 8.8% of revenues to 7.5% by 2028. Finally, given its strong focus on driving earnings and free cash flows, I assumed a terminal return on capital of 15%, which is almost 2X the industry average.
Cost of capital
A bottoms-up model was used to estimate the cost of capital. Using a risk-free rate of 3.7%, an implied equity premium of 5.55%, a country risk premium of 0.6%, an unlevered beta of 1.18 for online and grocery retailers, and the current debt/equity ratio of 7.7%, the cost of equity for Coupang comes out to be 11.4%. Given its relative small debt currently, it is assumed that Coupang will have a stable grade credit rating of BB, which translates to a default spread of 3.1% and a resulting pre-tax cost of debt of 7.5%. Using current weights of its market value of debt and equity, its current weighted average cost of capital ((WACC)) comes out to be 11%.
For its terminal WACC, Coupang's cost of equity is assumed to move to the industry median of 10.8% while its cost of debt remains unchanged. This yields a terminal WACC of 10.4%. It is also assumed that the WACC decreases gradually from 11% currently to 10.4% by 2028.
A list of key assumptions used in the valuation model are summarized in Table 1 below.
Table 1: Key Valuation Assumptions
| Variable |
| Initial |
| Terminal |
| Rationale |
| Revenue growth rate |
| 30% |
| 3.7% |
| 11% CAGR of Korean e-commerce market, international expansion and new service offerings. Growth gradually slowing to risk-free rate by 2029. |
| Period of high growth |
| 6 years |
| -- |
| Revenues go to 3X current by year 7 |
| Operating margin |
| -0.7% |
| 8.0% |
| Margins improve with efficiency gains from infrastructure/tech investments and economies of scale. |
| Net Capex % of revenue |
| 2.9% |
| 2.0% |
| Re-investments primarily in infrastructure and technology, at gradually decreasing levels Re-investments primarily in infrastructure and technology, at gradually decreasing levels |
| Working capital % of revenue |
| 8.8% |
| 7.5% |
| Terminal return on capital |
| -- |
| 15% |
| 2X industry median given the company's focus on driving cash flows |
| WACC |
| 11.0% |
| 10.4% |
| Bottoms-up calculation using industry median cost of equity for terminal value |
Source: Author's assumptions
Based on these assumptions, I conducted a discounted cash flow ((DCF)) valuation for Coupang. Details of the valuation are presented in Table 2 below.
Table 2: DCF Valuation Model for Coupang ($ Million)
| Year --> |
| TTM |
| 2023 |
| 2024 |
| 2025 |
| 2026 |
| 2027 |
| 2028 |
| Terminal |
| Net Revenue |
| $20,333 |
| $26,433 |
| $33,204 |
| $40,253 |
| $47,033 |
| $52,894 |
| $57,165 |
| $59,274 |
| Net revenue growth rate |
| 30.0% |
| 25.6% |
| 21.2% |
| 16.8% |
| 12.5% |
| 8.1% |
| 3.7% |
| Gross Margins |
| 20.8% |
| 23.0% |
| 24.2% |
| 25.4% |
| 26.6% |
| 27.8% |
| 29.0% |
| 29.0% |
| Operating Expenses |
| 23.7% |
| 23.2% |
| 22.6% |
| 22.1% |
| 21.5% |
| 21.0% |
| 21.0% |
| Operating Margin |
| -2.9% |
| -0.7% |
| 1.0% |
| 2.8% |
| 4.5% |
| 6.3% |
| 8.0% |
| 8.0% |
| EBIT |
| ($591) |
| ($197) |
| $333 |
| $1,108 |
| $2,118 |
| $3,306 |
| $4,573 |
| $4,742 |
| EBIT (1 - Tax Rate) |
| ($591) |
| ($197) |
| $333 |
| $1,108 |
| $1,810 |
| $2,665 |
| $3,476 |
| $3,604 |
| Re-investment |
| $1,294 |
| $1,471 |
| $1,597 |
| $1,647 |
| $1,604 |
| $1,464 |
| $887 |
| FCFF |
| ($1,490) |
| ($1,138) |
| ($489) |
| $163 |
| $1,061 |
| $2,012 |
| $2,717 |
| Cost of capital |
| 11.0% |
| 10.9% |
| 10.8% |
| 10.7% |
| 10.6% |
| 10.4% |
| 10.4% |
| Terminal Value |
| $40,229 |
| PV of operating assets |
| $21,031 |
| ($1,342) |
| ($924) |
| ($358) |
| $108 |
| $636 |
| $22,912 |
| - MV of debt |
| ($2,144) |
| + Cash |
| $3,060 |
| - Value of outstanding options |
| ($508) |
| Value of equity |
| $21,439 |
| # of outstanding shares |
| 1792.5 |
| Value of equity/share |
| $12.0 |
Source: Author's calculations
My model results in an intrinsic value of $12 per share for the Coupang stock. The stock was trading at $15.65 at close on February 20, 2023. Therefore, it seems overpriced by ~30% to its intrinsic value.
Simulation Results
As is obvious, the results from the DCF model are highly dependent on the key assumptions outlined earlier. Changing these assumptions and the associated storylines would results in materially different valuation results. Amongst the key variables, the initial revenue growth rate, the terminal operating margins, and the terminal return on capital are the ones the model is quite sensitive to. Hence, it is prudent that the model be tested under differing values of these variables to observe the extent to which they influence the intrinsic value per share.
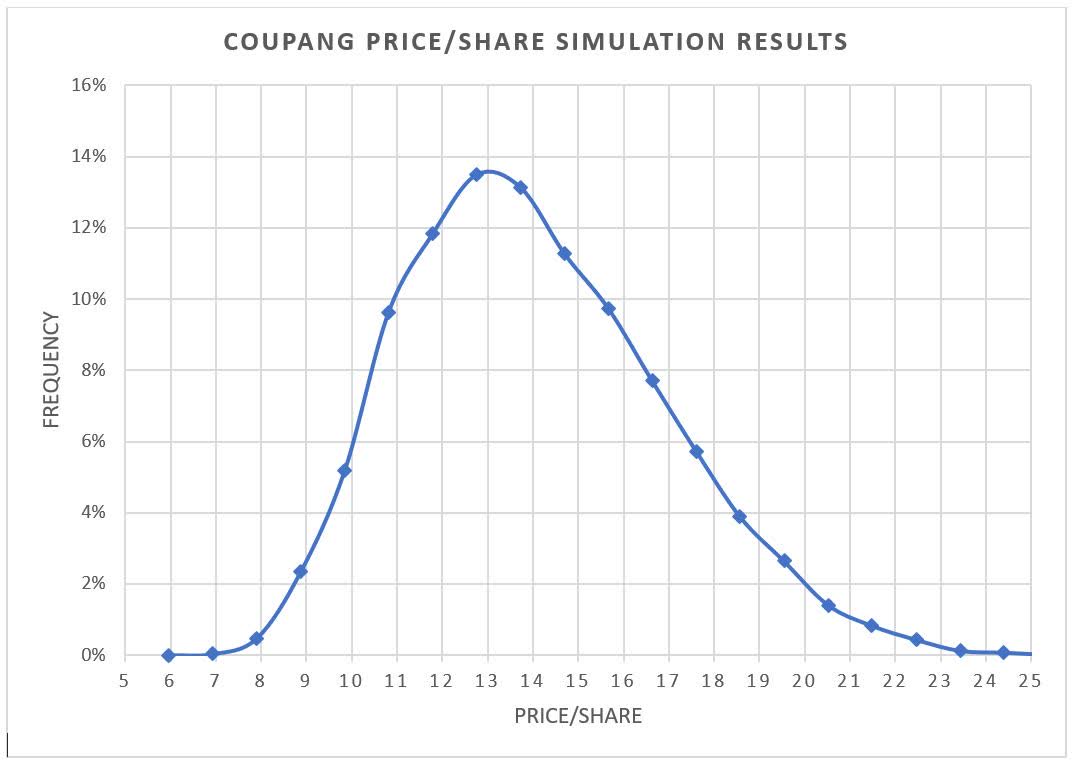
Monte Carlo simulations were run on the DCF model with these three inputs as variables. In this exercise, values of the input variables are picked from an assumed distribution and the corresponding output is noted. This process is repeated thousand times and a frequency histogram of the output variable is plotted. This helps to visualize the range of output variables. For initial revenue growth, a normal distribution with a mean of 30% and a standard deviation of 3.33% was used. For terminal operating margins, a triangular distribution with a min of 6%, baseline of 8%, and a max of 10% was used. For the terminal return on capital, a triangular distribution with a min of 10%, baseline of 15% and a max of 20% was used. With these inputs, 10,000 iterations of the model were completed. The results from this simulation are plotted in Figures 2 and 3 below.
Figure 2: Frequency Plot of Intrinsic Valuation from Monte Carlo Simulation
Author's analysis
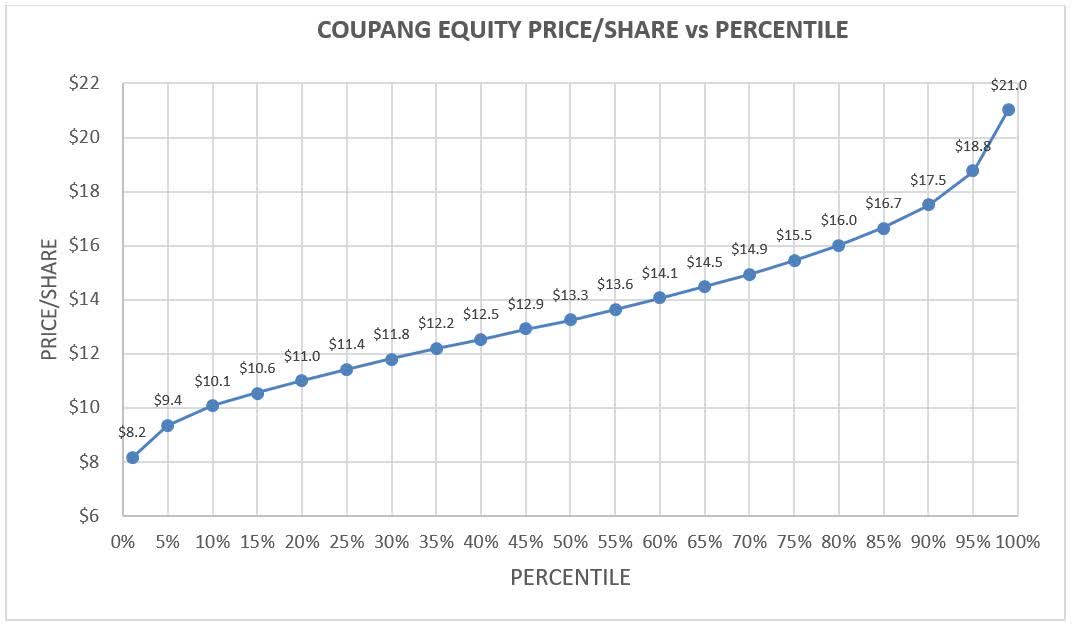
Figure 3: Frequency Plot of Intrinsic Valuation from Monte Carlo Simulation
Author's analysis
As evident from these plots, the range for intrinsic value goes from the 20 th percentile of $11 to the 80 th percentile of $16. The current price of $15.65 lies at around the 75 th percentile, translating into a 75% chance that the stock is overpriced currently.
The Anti-thesis
As with any analysis, the valuation output is a function of the storyline and the corresponding inputs. So, could there be a different set of inputs which make the stock underpriced? Of course, there are. For example, one can fathom a scenario wherein the initial revenue growth rate is at 40%, terminal operating margins reach 13%, and terminal return on capital gets to 25%. This could occur under a combination of strong top-line growth (due to venturing into other geographies not considered here, launching additional product categories or service offering), vastly reduced operating expenses (due to significant gains from fulfillment automation and economies of scale) and reduced re-investment needs (due to high utilization of existing infrastructure and less spend on technology). Under this very optimistic scenario, revenues grow to over $75 billion by 2028 and terminal Free Cash Flow jumps to almost $6.6 billion. This yields a value of $31.8 for the stock, which is over 2X the current price.
On the other extreme, there could be scenarios wherein the rate of revenue growth is lower than expected and the company does not reach the target operating margins. Delays in new product or service launches and/or restrictive geographical expansion could cause this decline in top-line growth. Additionally, increasing competition, specifically in South Korea, from the likes of Amazon, Shopify, Meta and others, could cause erosion of market share and even more dampening of pricing power. Furthermore, its expansion outside of South Korea may not yield assumed results due to the presence of strong local players as well as international behemoths in these markets. Under a very pessimistic scenario of a 20% initial revenue growth, 2% terminal operating margin, and a 10% terminal return on capital, the stock value could fall to $0.
Conclusion
Coupang has got several tailwinds working for it. It is expanding its addressable market, has shown strong top-line growth which is poised to continue, and continues to improve its operating margins. Given its strong leadership, focus on a differentiated customer experience and financial discipline, CPNG stock deserves to be in one’s portfolio.
However, based on an intrinsic value of $12/ share, the stock is currently overpriced, trading at $15.65. Considering a suitable margin of safety to the intrinsic value, a prudent level to enter into a long position, in my view, would be below $10 (10 th percentile of DCF simulation results). Coupang is currently a story of a good company trading at a high price, notwithstanding the 75% decline from its IPO price of $63.5. However, if one is currently long this stock, there is not a strong reason to get out of the position. It may be worthwhile to hold as the valuation may increase in the near future. At this time, however, Coupang does not appear to be taking off.
For further details see:
Coupang: Good Company At An Expensive Price