IWD - COWZ December Reconstitution: 21 Substitutions And A Bold Bet On Energy Prices
2023-12-19 15:44:14 ET
Summary
- COWZ recently underwent a quarterly reconstitution, substituting 21 stocks, or approximately one-quarter of the portfolio by weight. As expected, free cash flow yield and valuations remain attractive.
- An unexpected find was an improvement in earnings momentum, as measured by last quarter earnings surprises and a stronger EPS Revision Score.
- However, earnings growth, after excluding unpredictable Energy stock forecasts, is virtually flat. COWZ is primarily a value play, and historically, it's hit or miss.
- To illustrate, COWZ was a bottom-quartile performer from 2018-2020 before its high Energy sector exposure led to a #1 ranking in 2021-2022. Simply put, investors should be prepared for bottom-quartile performance again if oil prices retreat.
- COWZ's attractive fundamentals but inconsistent history make it difficult to rate. I'm pleased with this quarter's improved fundamentals, but am cautious about its 28% Energy sector exposure. Therefore, I've kept my rating on COWZ to a "hold".
Investment Thesis
I've covered the Pacer US Cash Cows 100 ETF ( COWZ ) numerous times, most recently in June , when I rated the ETF a "hold" on account of its inconsistent returns, excessive concentration in Energy stocks, but still high-quality selections with attractive valuations. However, today's article aims to detail the results of its latest reconstitution, where 21 substitutions were made to achieve the best free cash flow yield possible. That is the driving metric for COWZ, which has amassed a staggering $17.87 billion in assets under management in its seven-year history. With a relatively high 0.49% expense ratio, COWZ is Pacer's cash cow, leading to the development of several other ETFs captured in a fund of funds product with the appropriate ticker HERD .
My findings reveal what I've come to appreciate about COWZ: a 12.55x forward P/E and a 9.24/10 profit score supported by 15.34% free cash flow margins. In addition, unlike in June, COWZ appears to sport a healthy growth rate and earnings momentum metrics. However, investors must realize these attractive fundamentals are primarily due to a high allocation to Energy stocks. Therefore, despite improvements from six months ago, I reiterate my initial view that COWZ is only suitable as a complementary fund, and if investors are bullish on Energy stocks, dedicated sector ETFs like XLE will serve just as well.
COWZ Overview
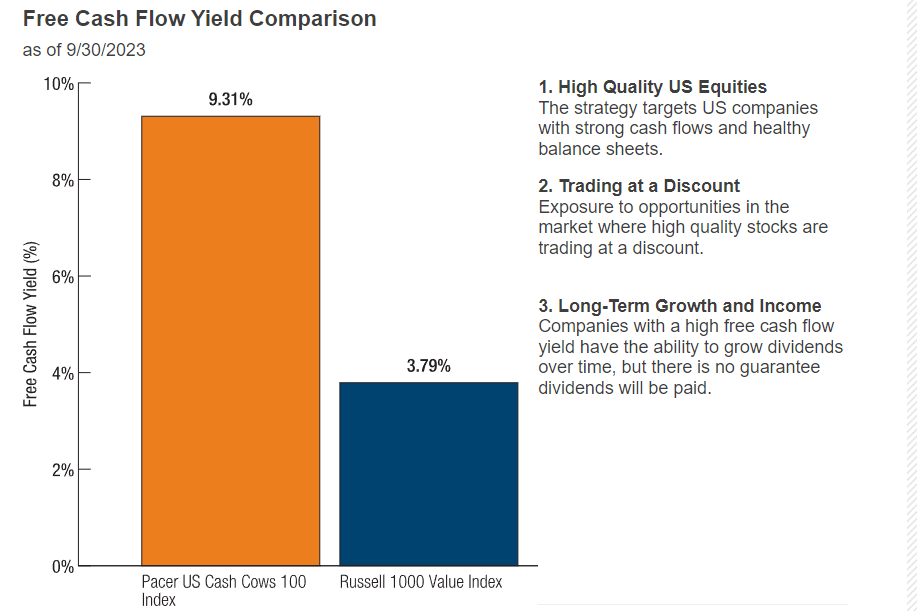
COWZ tracks Pacer's US Cash Cows 100 Index, selecting large-cap Russell 1000 stocks based on their free cash flow yields. Free cash flow is a company's cash flow from operations minus capital expenditures, and yield is calculated as a percentage of the company's enterprise value (market cap plus debt less cash). As shown in the graphic below, the result is a portfolio of high-quality stocks trading at a discount.
Pacer ETFs
While this graphic is as of September 30, 2023, the current portfolio has a weighted average 8.20% free cash flow yield, more than twice as high as the benchmark Russell 1000 Value Index.
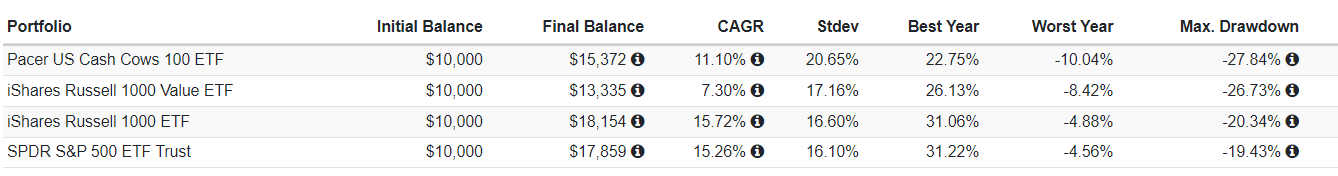
One consistent criticism I've had of COWZ is its reliance on trailing metrics, which was the basis for my prediction that the Index would be slow to unwind its energy holdings even as inflation peaked. That's been the case over the last year, but admittedly, the strategy held up reasonably well since my initial review in March 2022. COWZ gained an annualized 4.24%, slightly better than the iShares Russell 1000 ETF ( IWB ) and the SPDR S&P 500 ETF ( SPY ), and 3.22% better than the iShares Russell 1000 Value ETF ( IWD ).
Portfolio Visualizer
The downside is higher volatility, evidenced by the fund's 23.06% annualized standard deviation figure. COWZ is risky, and while it may serve as a nice complement to broad market ETFs like SPY, it might not appeal to conservative investors.
COWZ's full track record is also impressive. Since January 2017, it's up an annualized 13.30% vs. 7.92%, 12.85%, and 13.11% for IWD, IWB, and SPY.
Portfolio Visualizer
Still, I highlighted in June how COWZ's returns were inconsistent. In summary, COWZ ranked #19, #27, #30, and #27 in a 30-ETF sample between 2017 and 2020 before ranking #1 in 2021 and 2022. This example highlights why backtests are overutilized because investors surely would not be impressed with these figures from January 2017 to December 2020.
Portfolio Visualizer
COWZ's AUM skyrocketed in 2022, illustrating how many investors are performance chasers. It's not difficult to obtain a list of the top-performing ETFs over one-, three--, and five-years, but that's only a rudimentary analysis. Investors should understand how consistent an ETF's returns are and why it performed well in certain years and not so well in others. In COWZ's case, the answer is Energy in 2021-2022 as inflation concerns became real. If oil prices collapse, as is likely in a recession, you can expect bottom-quartile performance like from 2018-2020.
COWZ Analysis
COWZ Reconstitution Summary: 21 Additions
COWZ made 21 additions this quarter, 19 of those with market capitalizations below $60 billion. The two exceptions were QUALCOMM ( QCOM ) and Booking Holdings ( BKNG ), with current weights of 2.09% each. The 15 others were mainly across the Consumer Discretionary and Industrial sectors.
- 3M ( MMM ): 2.03% (Industrials)
- HP ( HPQ ): 1.57% (Technology)
- Devon Energy ( DVN ): 1.47% (Energy)
- Vistra Energy ( VST ): 1.15% (Utilities)
- Coupang, Inc. ( CPNG ): 1.04% (Consumer Discretionary)
- SYNNEX ( SNX ): 0.78% (Technology)
- Molson Coors Brewing ( TAP ): 0.73% (Consumer Staples)
- Owens Corning ( OC ): 0.68% (Industrials)
- Carlisle Cos. ( CSL ): 0.54% (Industrials)
- Core & Main ( CNM ): 0.49% (Industrials)
- Skechers U.S.A. ( SKX ): 0.48% (Consumer Discretionary)
- AGCO ( AGCO ): 0.47% (Industrials)
- Mohawk Industries ( MHK ): 0.46% (Consumer Discretionary)
- Juniper Networks ( JNPR ): 0.45% (Technology)
- Newell Brands ( NWL ): 0.39% (Consumer Discretionary)
- EMCOR Group ( EME ): 0.36% (Industrials)
- Incyte ( INCY ): 0.35% (Health Care)
- NewMarket ( NEU ): 0.26% (Materials)
- Crane NXT ( CXT ): 0.14% (Industrials)
Technology, Industrials, and Consumer Discretionary additions by weight total 4.90%, 4.72%, and 4.46%, respectively. Free cash flow margins for the top three additions by weight (QCOM, BKNG, MMM) are impressive at 27.41%, 31.79%, and 26.32%, respectively.
COWZ Reconstitution Summary: 21 Deletions
To keep the 100-stock portfolio, the Index removed 21 stocks, mainly from the Consumer Staples (4.20%) and Health Care (3.93%) sectors.
- McKesson ( MCK ): 2.29% (Health Care)
- Kroger ( KR ): 1.84% (Consumer Staples)
- Archer-Daniels-Midland ( ADM ): 1.82% (Consumer Staples)
- XP Inc. ( XP ): 1.74% (Financials
- Pfizer ( PFE ): 1.64% (Health Care)
- Live Nation Entertainment ( LYV ): 0.85% (Communication Services)
- Fox Corp. ( FOXA ): 0.73% (Communication Services)
- Ovintiv ( OVV ): 0.69% (Energy)
- APA Corp. ( APA ): 0.69% (Energy)
- NetApp ( NTAP ): 0.65% (Technology)
- US Foods ( USFD ): 0.54% (Consumer Staples)
- Southwestern Energy ( SWN ): 0.47% (Energy)
- Nordstrom ( JWN ): 0.46% (Consumer Discretionary)
- Antero Resources ( AR ): 0.37% (Energy)
- F5 Networks ( FFIV ): 0.35% (Technology)
- Boyd Gaming ( BYD ): 0.34% (Consumer Discretionary)
- Cocentrix ( CNXC ): 0.30% (Industrials)
- Genpact ( G ): 0.26% (Industrials)
- Polaris ( PII ): 0.22% (Consumer Discretionary
- Teradata ( TDC ): 0.15% (Technology)
- Hawaiian Electric Industries ( HE ): 0.15% (Utilities)
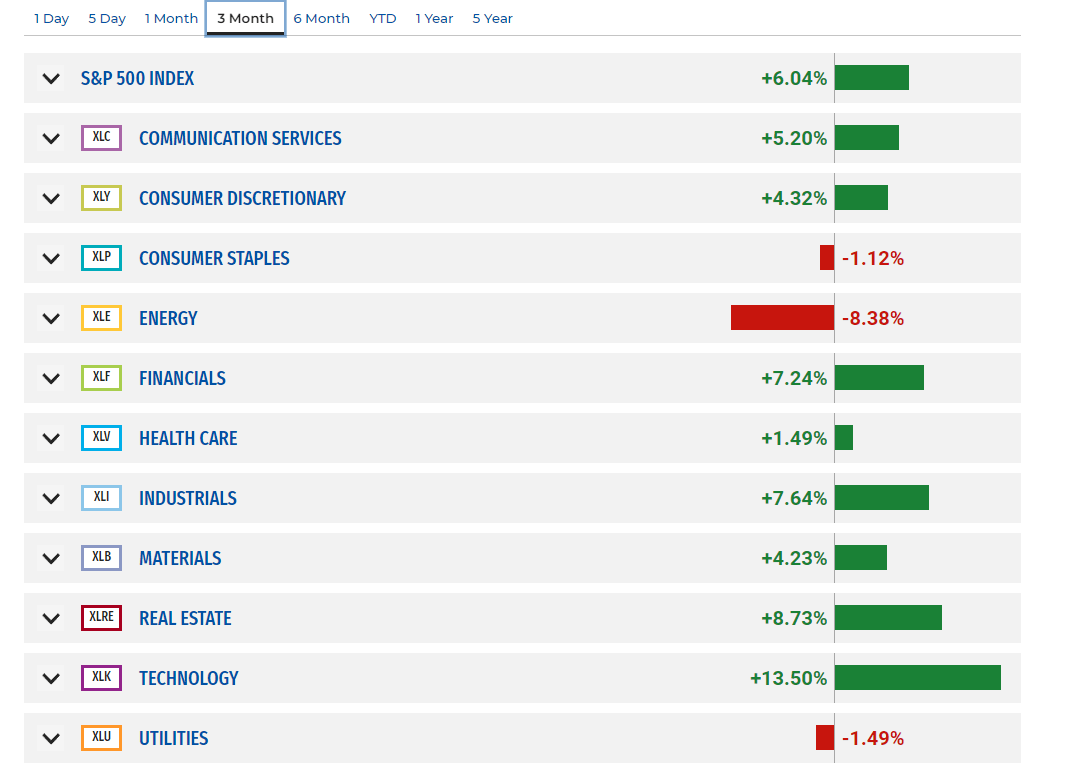
The weightings listed for these deletions are as of December 13, 2023, and notably, only include a few Energy holdings. Per the State Street Sector Tracker , Energy was the worst-performing large-cap sector over the last three months, and even though WTI Crude Oil futures are down approximately $18/barrel from their $90 price three months ago, COWZ kept Energy exposure relatively steady at 27%.
State Street
To hedge their bets, you might want to consider other recently launched free-cash-flow-focused ETFs, undoubtedly to capture some of COWZ's market share. To be sure, these ETFs aren't without issues, even though their selection processes are different and typically incorporate forward-looking metrics, something I criticized COWZ for in early 2022.
- VictoryShares Free Cash Flow ETF ( VFLO )
- Global X U.S. Cash Flow Kings 100 ETF ( FLOW )
- Amplify Cash Flow Dividend Leaders ETF ( COWS )
Generally, I view these alternatives as "different" and not necessarily better solutions. There are always tradeoffs, and it sometimes takes deeper analysis to find them beyond what standard Fund Fact documents offer. For example, VFLO is even more concentrated than COWZ, with only 50 holdings and 55% of assets in two sectors (Energy and Health Care). FLOW's estimated sales and earnings per share growth rates are relatively weak, while COWS substantially sacrifices quality to pursue value. Though it trades at just 6.98x trailing cash flow, its free cash flow margins are 5% less than COWZ.
Sector Exposures
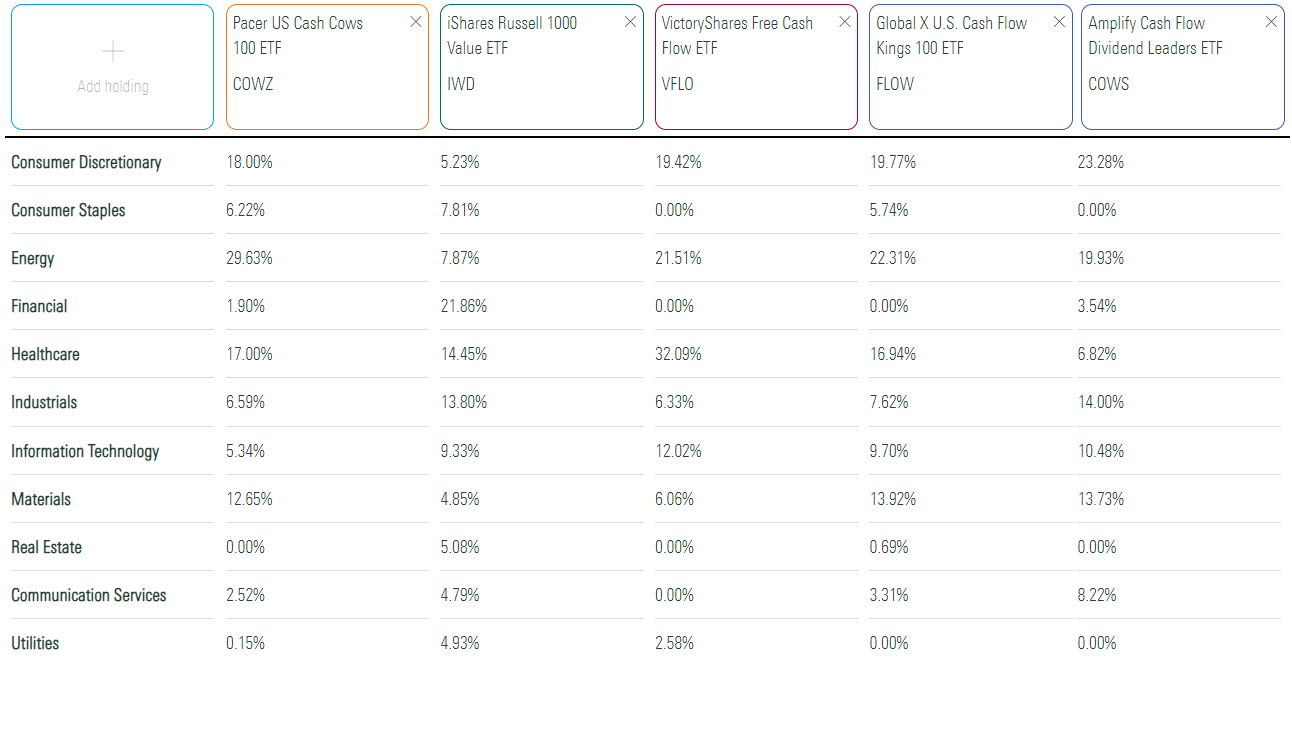
The following table highlights COWZ's sector exposures compared to IWD, VFLO, FLOW, and COWS. Please note that Morningstar's figures do not yet reflect the latest reconstitution, but it's somewhat close. The most significant changes are:
- A decrease to Consumer Staples (6.22% to 2.97%)
- A decrease to Energy (29.63% to 27.85%)
- An increase to Industrials (6.59% to 10.06%)
- An increase to Technology (5.34% to 9.44%)
Morningstar
VFLO, FLOW, and COWS have less Energy sector exposure, so they might be more appropriate depending on your view of the sector. COWS appears to be the most diversified, but as discussed earlier, its quality could be better. There's a cost to diversification, and it's up to each reader to decide what that is. Hopefully, the fundamental analysis below will help you decide.
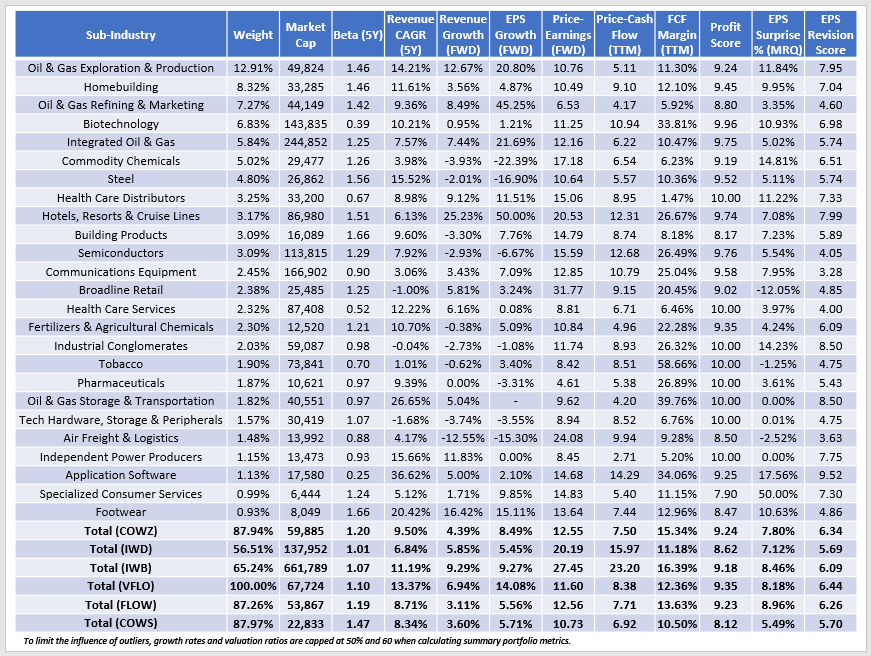
COWZ Sub-Industry Fundamentals
Here's a more detailed look at COWZ at the sub-industry level. COWZ's top 25 sub-industries comprise 87.94% of the portfolio, which is high but no worse than what VFLOW, FLOW, and COWS feature. Naturally, IWD and IWB are better diversified broad-market funds.
The Sunday Investor
A few observations:
1. One thing I appreciate about COWZ is its high-quality selections. Its 15.34% free cash flow margin is almost as good as IWB, where Apple ( AAPL ), Microsoft ( MSFT ), and Alphabet ( GOOGL ) have margins between 20-24% and comprise 16.42% of the Russell 1000 Index. However, they're not in COWZ due to their high valuations (30.12x, 33.10x, and 23.08x forward P/E, respectively). Some investors have started to think more about their exposure to "Magnificent 7" stocks, and COWZ consistently avoids this group (exposure is 0% today). Along with a 9.24/10 overall profit score based on individual Seeking Alpha Profitability Grades, COWZ could work to complement a broad-market fund without sacrificing quality.
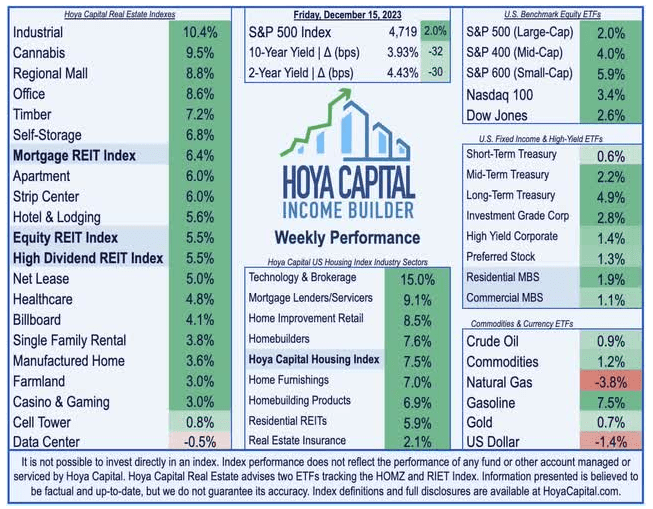
2. Although COWZ is no less diversified than its peers, I'm still concerned with its high exposure to the Energy sector. Notice how extremely high growth rates are assigned to all the oil and gas sub-industries, and as much as I prefer a mix of forward- and backward-looking metrics, these estimates aren't worth much. COWZ's net estimated EPS growth rate is 8.49%, but excluding Energy, it's just 1.14%. Therefore, despite an earlier suggestion in Pacer's graphic, COWZ is not a good "long-term growth" ETF. Instead, it's mostly a value play and, arguably, a deep-value play. That said, COWZ might benefit from a high allocation to Homebuilding stocks. As noted here , with mortgage rates dipping below 7% and a softer Fed outlook, the Hoya Capital Housing Index rallied 7.5% last week, with Home Improvement Retail and Homebuilders rallying 8.5% and 7.6%, respectively.
Hoya Capital
3. COWZ's valuation metrics align with the other three cash-flow-focused ETFs, trading at 12.55x forward earnings and 7.50x trailing cash flow. COWS offers an even cheaper valuation, but as discussed earlier, it has quality problems and is not an ETF I recommend. Not included above, but COWZ's value score is only 5.61/10, which underscores how U.S. equity prices are generally elevated. Still, COWZ's value score ranks within the top 10% of the 870 U.S. Equity ETFs I track, with several small/mid-cap value and large-cap dividend ETFs ranking slightly better. Examples are the WisdomTree U.S High Dividend Fund ( DHS ) and the First Trust Morningstar Dividend Leaders ETF ( FDL ).
4. COWZ has a 6.34/10 EPS Revision Score, a dramatic improvement over June's 5.14/10 score and an indicator that sentiment is improving. Its constituents delivered a 7.80% earnings surprise last quarter, in line with the 8.46% for the broader market, as IWB represents, and the distribution is well spread among most sub-industries. This is a bonus for me, as there isn't anything in the methodology that would suggest a bias toward stocks with positive recent results or Wall Street sentiment. If anything, I expect the opposite, as stocks often trade cheaply for good reasons.
Investment Recommendation
COWZ's fundamentals have improved since my last review in June. After the latest quarterly reconstitution, the ETF trades at 12.55x forward earnings and has 15.34% free cash flow margins, which support relatively high value and quality scores among its peers. EPS Revisions are up, and COWZ is a nice complement to broad market funds, given its zero exposure to the Magnificent 7 stocks that have dominated markets in 2023.
Fundamentally, I have two cautionary points that may or may not apply to you. First, COWZ has been slow to unwind its Energy sector exposure despite hitting peak inflation, leaving investors vulnerable if oil prices decline. Second, COWZ's estimated earnings growth is only 1.14% after excluding Energy, which is 4.31% and 8.13% slower than IWD and IWB. High concentration and slow growth are the main tradeoffs for this high-quality, cheaply-valued portfolio, and I ask readers to remember that COWZ was a bottom-quartile performer in 2018-2020. Simply put, it's an inconsistent ETF, and investors should limit their exposure to COWZ accordingly. Thank you for reading, and I look forward to answering your questions in the comments below.
For further details see:
COWZ December Reconstitution: 21 Substitutions And A Bold Bet On Energy Prices