IWB - COWZ: What We Like And What We Dislike About This ETF
2023-10-02 13:05:21 ET
Summary
- Pacer US Cash Cows 100 ETF focuses on the top 100 stocks from Russell 1000 with high free cash flow yield.
- We highlight some attractive themes of this ETF.
- We close with some thoughts on why COWZ may not be an optimal bet at this juncture.
Introduction
At the outset, we'd like to state that we are currently neutral on the Pacer US Cash Cows 100 ETF ( COWZ ), a $15bn sized fund that focuses on the top 100 stocks from the Russell 1000 which score highly on the free cash flow ((FCF)) yield metric. We hope, through the commentary that follows, investors will get a better sense of why we have a mixed perspective on this product. Let's first start with what we like about COWZ followed by some less appealing facets of the product.
What We Like
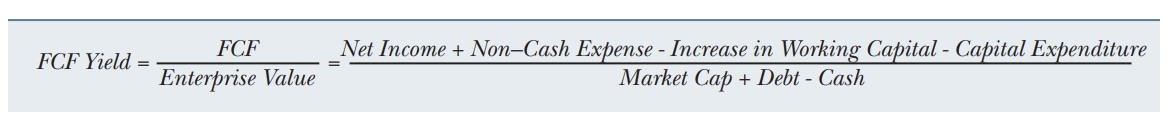
A lot of ETFs try to use an optimal combination of various fundamental screeners to arrive at the most optimal portfolio, but COWZ only sticks to one tried and tested gauge, the FCF yield (FCF as a function of the enterprise value). Yes, rather than settling for a static FCF figure at any point in time (COWZ reconstitutes and rebalances its holdings four times a year, and most recently did so at the end of the third week of September, based on the trailing twelve-month FCF yield), we would've preferred an FCF gauge that takes into consideration the progression of this facet over time.
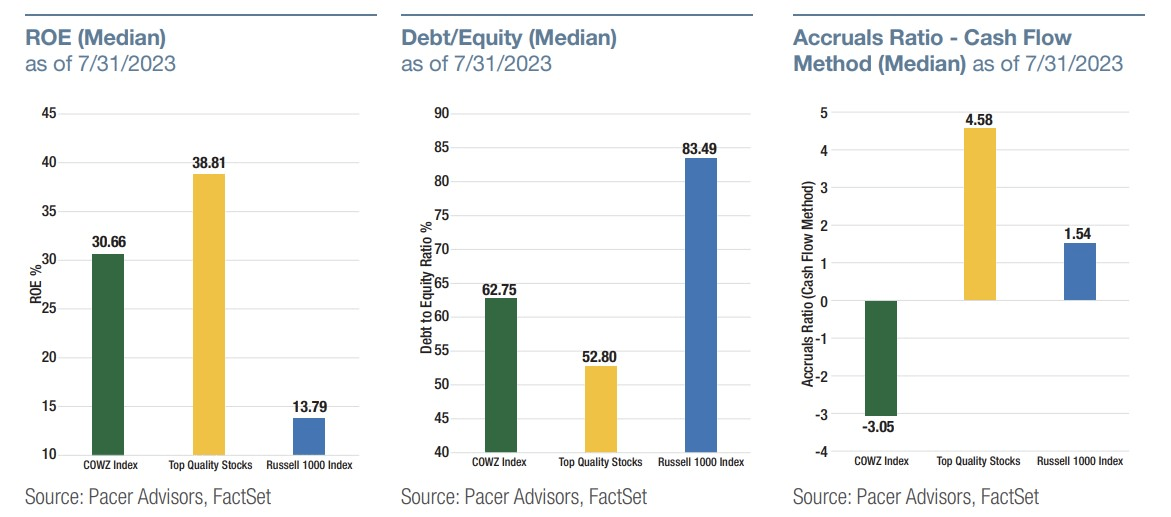
However, do note that if you break down the FCF yield metric into various chunks, one can still get a sense of different qualities of a business, be it the effectiveness with which it generates ample profits for its shareholders ((ROE)), the level of gearing that it undertakes (Debt to equity), or even the relative quantum of non-cash earnings in the profits (as measured by the accruals ratio). Note that COWZ holdings score very highly on all three metrics (except for the accruals ratio, but a lower accruals ratio should be taken well, as it suggests a lower proportion of non-cash items in the bottom line), compared to other large and mid-cap stocks from the Russell 1000.
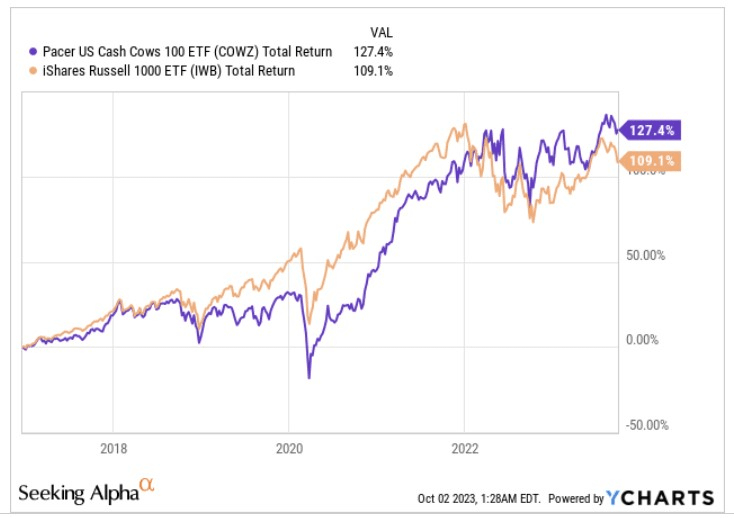
Given how highly these stocks score, it's no surprise to discover that COWZ has also outperformed its benchmark, The Russell 1000 since its inception.
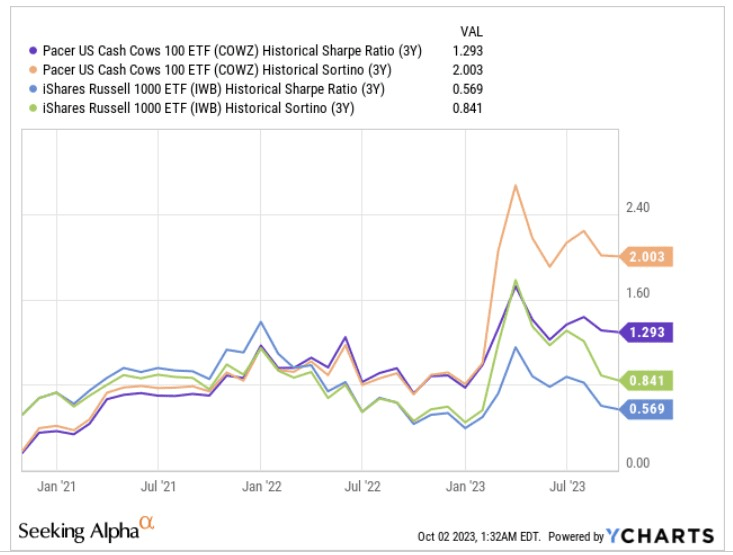
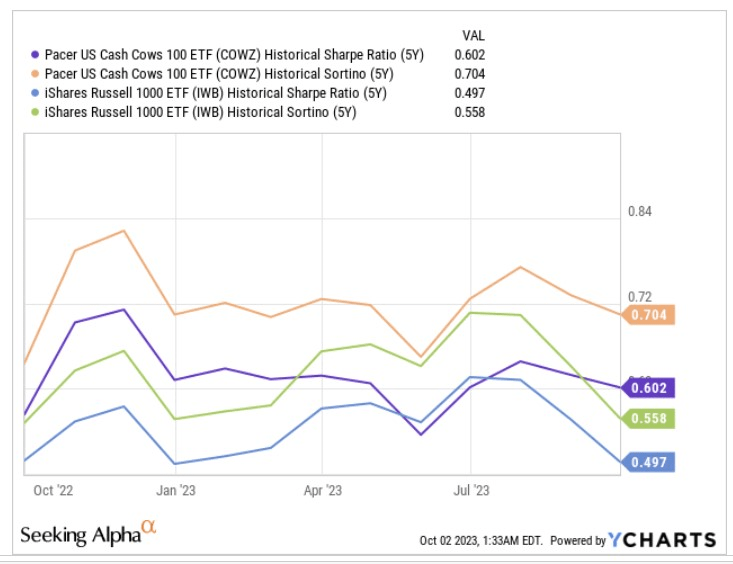
It isn't just the relative quantum of total returns that are worth admiring. This ETF even does a pretty good job when it comes to juggling risk and delivering those returns. The Sharpe ratio provides some context on how effectively a portfolio has been able to generate excess returns over the risk-free rate, after taking into consideration the total per unit risk taken. The Sortino ratio on the other hand gives you a similar numerator effect, but the excess returns are now gauged during periods of only harmful volatility. Note that over the last three years, COWZ has been able to do extremely well on both fronts, particularly when it comes to handling downside deviation. This suggests that when risk sentiment in the market turns, flows typically go to high FCF generators.
If you want to extend the time period in question and focus on things across a 5-year span, again COWZ comes out on top relative to IWB (the Russell 1000 ETF).
Investors should also note that COWZ offers excellent value at current levels, particularly when you consider the degree of long-term earnings growth you could get at that multiple. According to Morningstar, COWZ is priced at a weighted average P/E of just 10x, and you could get earnings growth that is 1.7x that multiple over time. Contrast that with IWB that only offers long-term earnings of 12% but is priced at almost 2x COWZ's corresponding multiple.
Morningstar
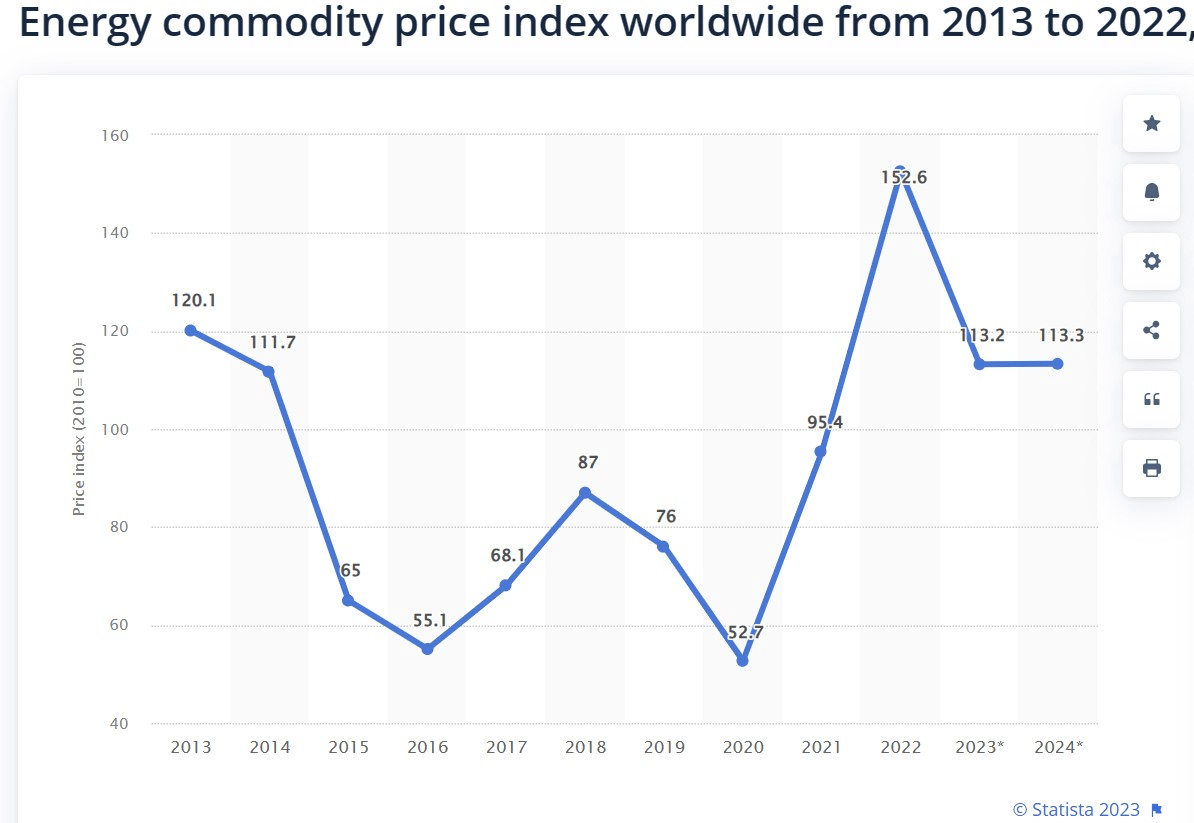
COWZ is also dominated by energy stocks (one-third of the total portfolio), and here it looks like things could be relatively stable. Prices could likely receive support from the fact that we are currently in the midst of transitioning from inventory builds to inventory drawdowns with another 1.2m bpd (barrels per day) of drawdowns expected in Q4 (Source: IEA). OPEC also expects world oil demand in 2024 to be relatively resilient and grow by 2.25m bpd. The energy price commodity index should also be relatively stable for the second year running in 2024.
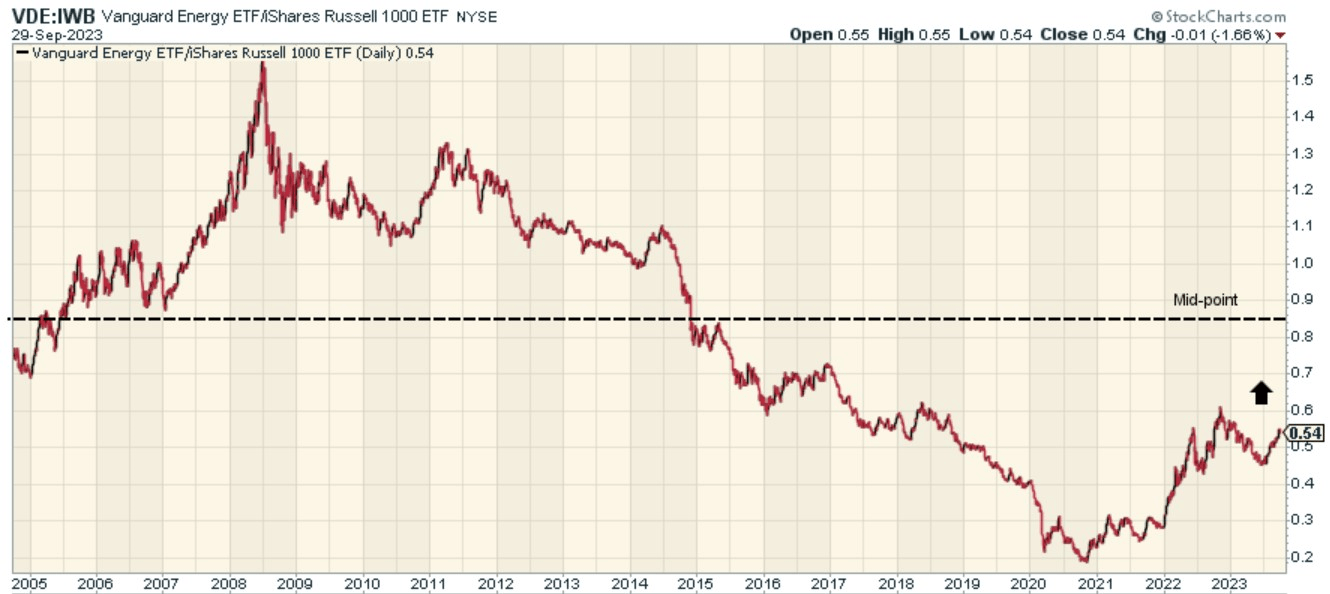
Finally, we'll conclude this section by also talking up the potential for Russell 1000 energy stocks to continue to mean-revert. This is exemplified by the image below which highlights how the relative strength ratio of energy stocks relative to the Russell 1000 is still a long way off the mid-point of its zone.
What We Dislike
To truly get the benefit of owning FCF compounders, one needs to stick around with certain stocks for the long haul, but that is not something that COWZ typically does. While most ETFs only churn one in three stocks every year, COWZ churns out 9 in 10 stocks every year! This can also be inefficient from a tax angle.
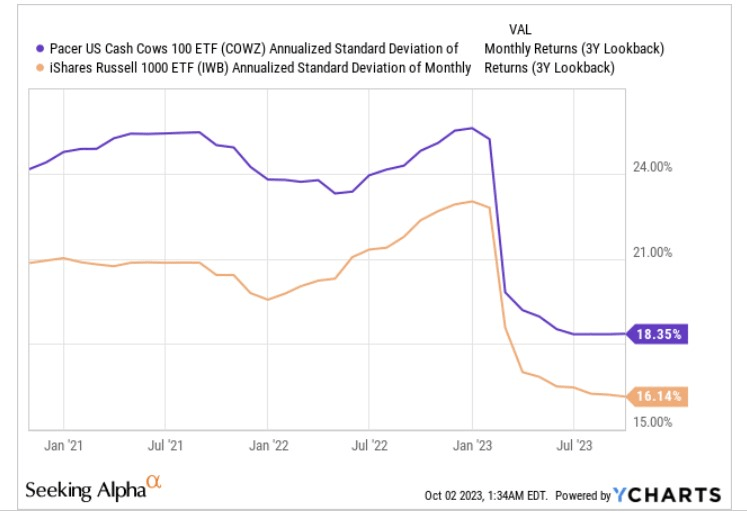
Compared to the Russell 1000 ETF also note that COWZ typically focuses on more volatile stocks and this could put off some of the more conservative investors here; this trend seems to be common whether we look at it from a 3-year or 5-year angle, with the standard deviation of COWZ's monthly returns consistently coming in around 200-300bps more than IWB.
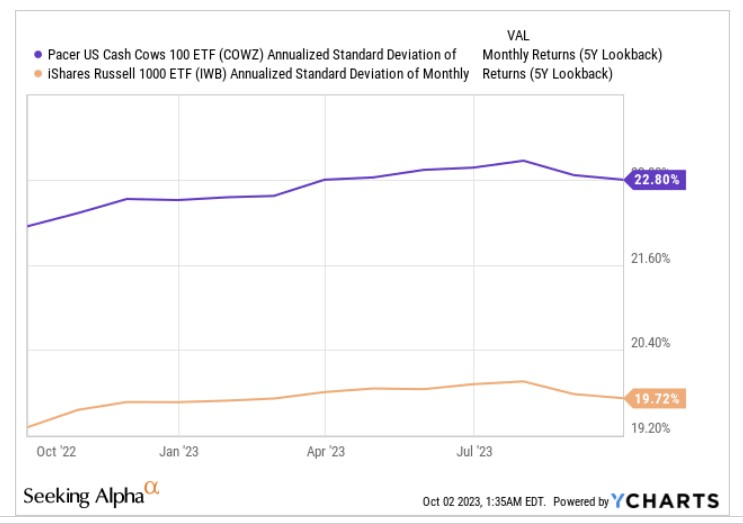
A large part of this could perhaps be explained by COWZ's predilection towards weighting the riskier mid-cap segment of the Russell 1000 index, which accounts for 52% of the total portfolio. On the other hand, IWB's major focus is towards giant and large-caps which account for over three-fourths of the total portfolio.
Then, if one looks at how COWZ's portfolio is positioned relative to the Russell 1000 index, it does not look like those holdings will benefit from ample rotation interest, with the current relative strength ratio perched around 14% off the mid-point of the long-term zone.
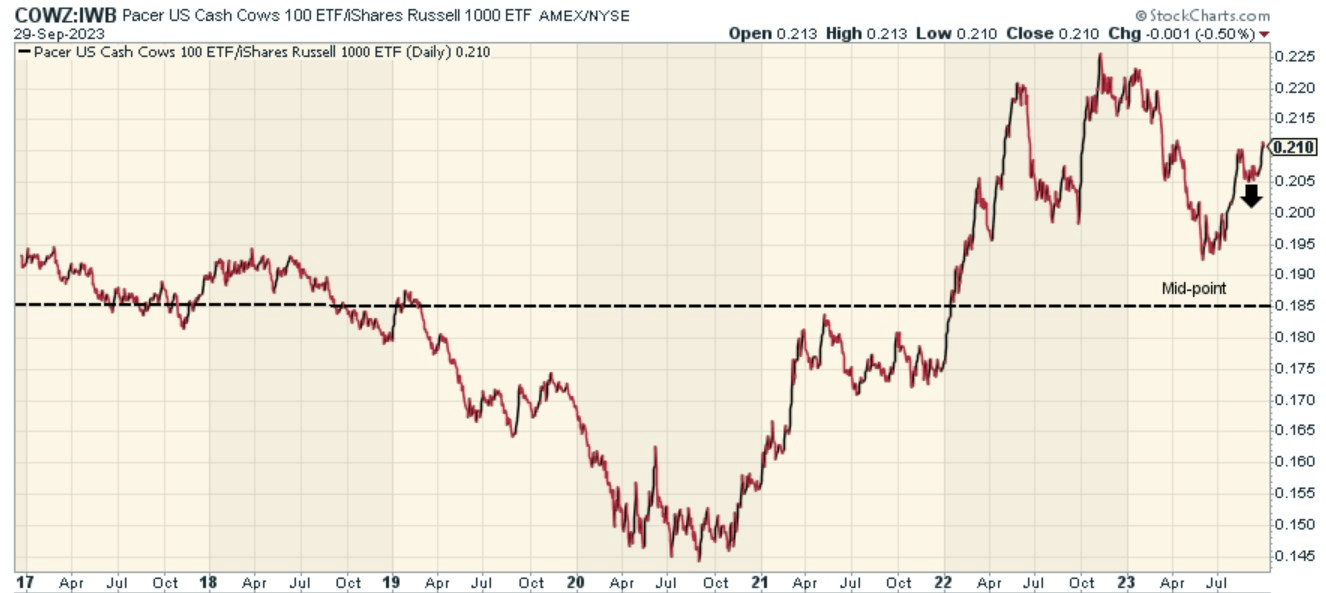
Finally, we're also not convinced that COWZ will benefit from any significant upside momentum so long as there's limited clarity on the Fed's interest rate positioning and a relative preference for the "higher for longer" rhetoric back in June, the expectations were for a figure of 4.6% at the end of FY24, but that has now been scaled up to 5.1% . Now this means the discount rate used to adjust the FCF will continue to remain elevated, dampening the valuation quotient.
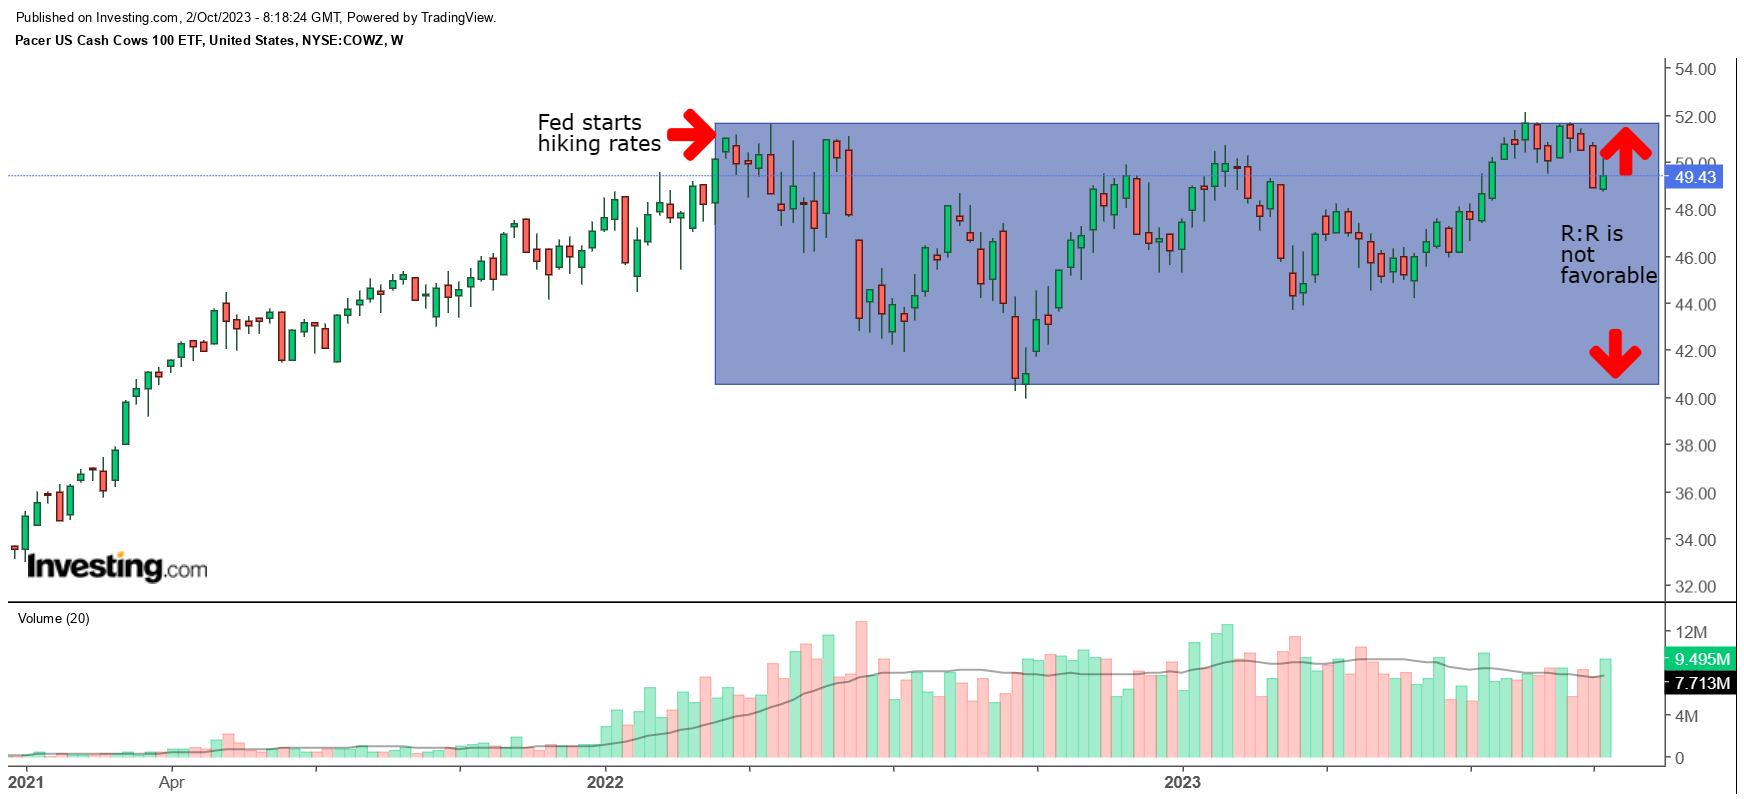
Note that the Fed first hiked rates in mid-March 2022 , and that's also around the time COWZ hit a top as well. Since then, it has continued to chop around within a certain range (highlighted in blue), and despite recent attempts to breakout from this range, it failed again. It's better not to gamble on another breakout now, as within the current range, the risk-reward does not look too alluring. We think investors should wait for a greater pullback down to the sub $42 levels before a long position is considered.
For further details see:
COWZ: What We Like And What We Dislike About This ETF