WRK - CPI Card Group: Too Much Risk At Too High A Price
Summary
- CPI Card Group Inc. is a payment systems company that manufactures and distributes payment card solutions in the U.S.
- The Company is going through a very favorable market moment.
- Revenue grows steadily while profit margins fluctuate.
- High CPI Card Group Inc. debt implies a high risk.
CPI Card Group Inc. ( PMTS ) is going through a very favorable market moment. The long-term revenue growth trend underlines how the company has gone through difficult periods and has come out well in any case.
The last 5 years have seen a strong growth trend also in margins even if at the Quarters level the figure does not imply sufficient stability in absolute terms. Capital turnover, on the other hand, shows a good ability in terms of capital employed.
The EPS fail to convert a stable Free Cash Flow which, indeed, in the last three years, has a downtrend also due to a significant increase in Capex. Even the CapEx trend does not underline, in my opinion, optimal management of investments in the long run (too low in the past and too high today).
A very high level of debt and a slightly overestimated share price valuation make me inclined towards not considering an investment in PMTS positively. My rate is Hold.
Company Overview
CPI Card is a payment systems company that manufactures and distributes payment card solutions in the U.S. The company provides credit, debit, and prepaid cards on the main financial network (along with great brands like Visa, Mastercard, American Express, and Discover).
The customer base is quite diversified and includes the largest issuers of credit and debit cards, but also FinTechs Companies, independent banks, and credit unions or group service providers.
The production is led in plants based in the U.S. with a high-security production network and the products are delivered physically, digitally, and on demand.
The main company product consists of EMV (Europay, MasterCard, and VISA) plastic cards (Contact and Contactless). These cards contain an integrated circuit capable of communicating with all EMV payment systems. From the innovation point of view, the company in 2019 launched an Eco-focused card which to date has sold more than 85 million pieces.
The company is also able to offer card data personalization solutions and instant card issuance solutions on demand through dedicated software [SAS].
64% of the primary components (microchips and antennas) of the cards produced by PMTS come from a single supplier, and 92% of the procurement is based on only 4 suppliers located in Germany, Thailand, South Korea, and Singapore. More than 60% of revenue comes from the top 10 customers, and nearly 20% of revenue comes from the first customer with whom the company has a decades-long business relationship.
Financial & Highlights
Revenue and EBIT
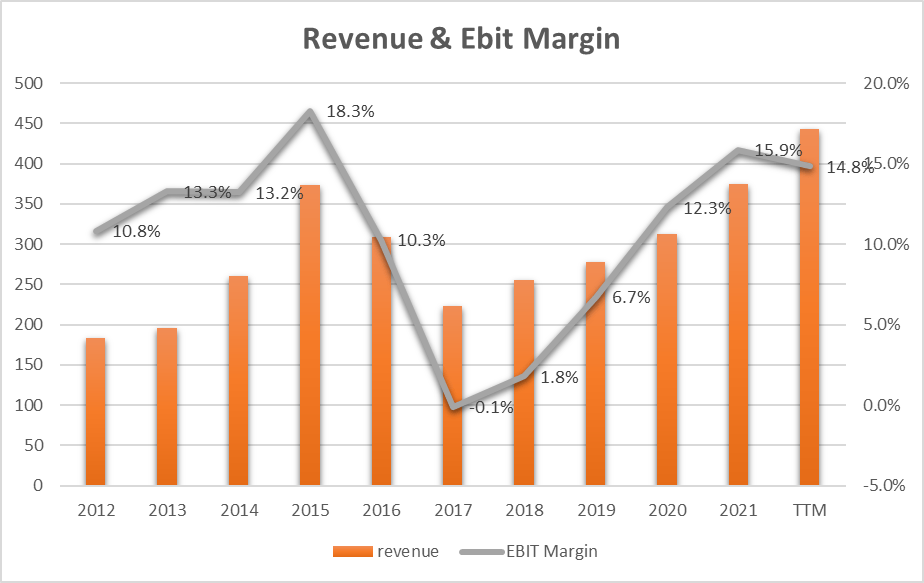
Revenue (orange bar) has grown by 9.2% [CAGR] in the last 10 years, and this certainly represents a positive figure, while the trend is somewhat fluctuating. From the graph, we can see how in 2017 there was a minimum peak with a fast recovery until 2022. The EBIT Margin trend follows that of the Revenue, with the negative peak falling below zero in 2017 (-0.1%). From 2018 to today, we have witnessed an important recovery with a last decline in 2022 (14.8% vs. 15.9% in 2021).
Reading the 2017 10-K Form :
The decrease in EMV revenue was the result of continued market softness in demand for EMV cards, including price erosion and loss of market share. For the year ended December 31, 2017, we sold 70.3 million EMV cards at an average selling price of $0.86 per card compared to 104.5 million EMV cards at an average selling price of $0.95 per card for the year ended December 31, 2016. The decrease in average selling price during the year ended December 31, 2017, compared to 2016 was due to lower prices across our customer base, including increased competition in the large issuer market, partially offset by favorable net pricing impacts of customer mix.
We can underline some important concepts: " loss of market share" and " lower price across customer base ." This trend and related insights paint a troubled corporate picture over the years and are subject to sudden changes capable of significantly changing corporate profitability. The EBIT Margin for 2022 (14.8%) represents a good figure and is the latest in a five-year growth trend.
Going into the details of the Quarters, we can see how the Revenue, in this case, has a stable and growing trend while the overall margin continues to record a fluctuating trend. There is a second negative peak in 2021 Q4 and recovering in the quarters of 2022, but not enough to reach the levels of the previous year.
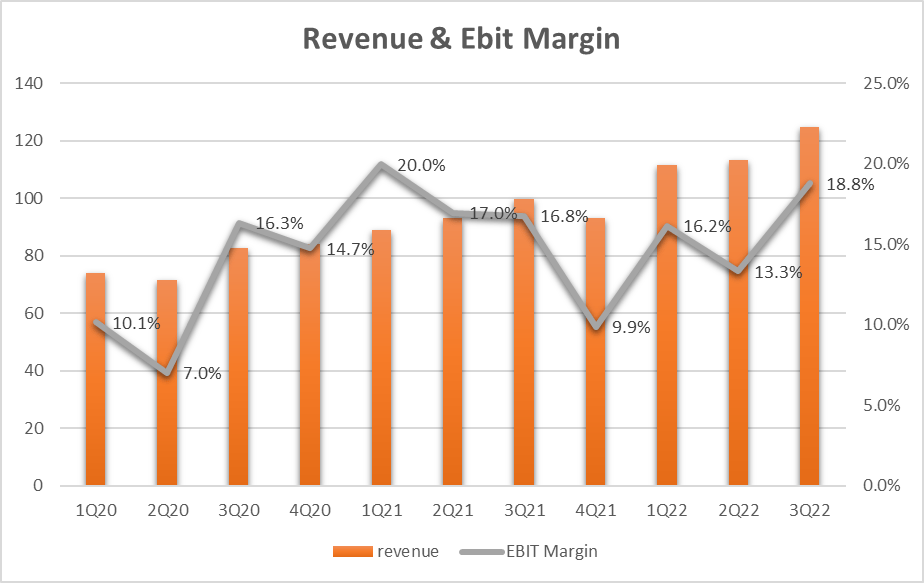
Remaining on the gray line (EBIT Margin), we note how the difference between the positive and negative peaks is of the order of magnitude of 100% in a few months. It went from 7% in Q2-20 to 20% in Q1-21, and then fell back to 9.9% in Q4-21 and back up again to 18.8% in Q3-22. A margin rate that can double or halve in a few quarters!
Analyzing the financial data, we can identify the gross margin as the main cause of the variability in margins and, more precisely, the direct production costs such as, for example, the cost of labor linked to the production units or the cost of the raw materials used in the cards.
A growing revenue trend is, therefore, not able to stabilize the operating margin, which remains linked more to direct production costs. These seem to be linked less to non-volume factors and more to fixed and/or structural factors.
Capital Turnover & Return on Capital Employed
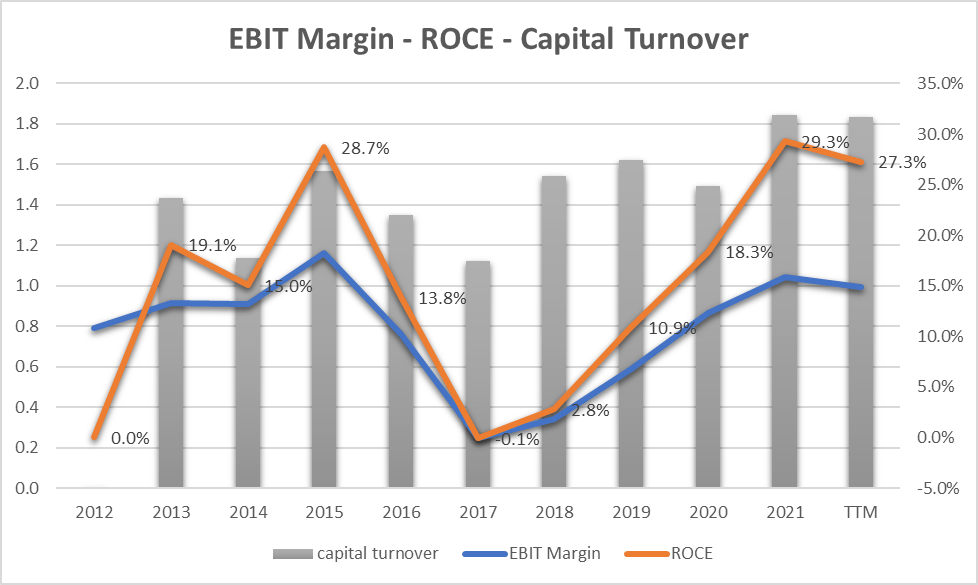
The ROCE trend follows that of the EBIT Margin but is amplified by the Capital Turnover factor (grey bars), which appears to be greater than 1 and with an increasing trend over the years. Capital Turnover underlines a good corporate ability to transform each $1 company employee plus $1 in sales. More precisely in 2021 and 2022, we have a figure of 1.8 which projects the ROCE to 27.3% in 2022.
The spread between the orange and blue line has widened in the last 5 years, and this underlines a good company capacity in the use of capital.
Free Cash Flow and CapEx
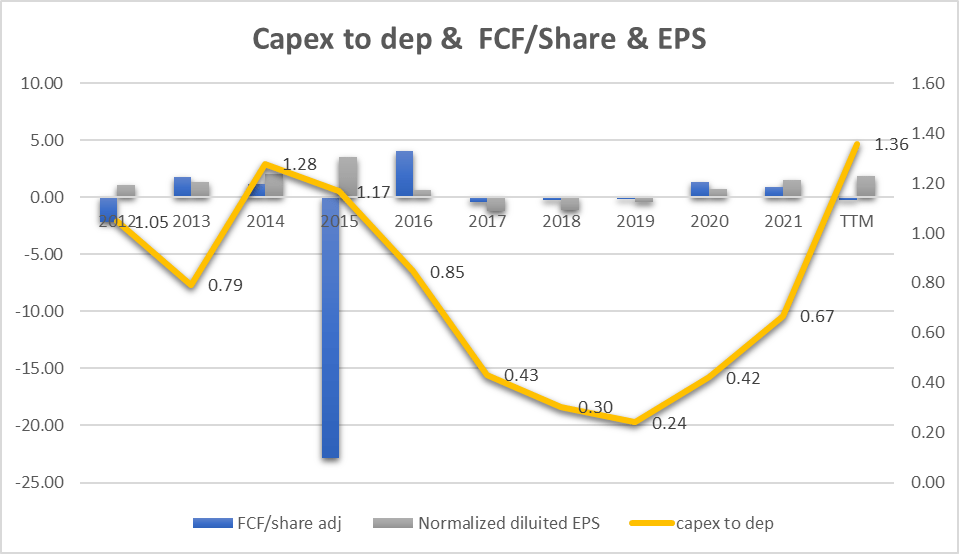
The graph shows the trend of the Free Cash Flow ("FCF") per Share (blue bars) compared with the EPS (grey bars). Except for 2015, when there was an extraordinary payment by the company, we can see how the company is unable to transform earnings into free cash flow constantly. In particular, we can see how in the last three years an increasing trend of the EPS sees a decreasing trend of the FCF. This is mainly due to two factors: an increase in the CapEx, and an increase in the inventory.
An increase in the level of CapEx can be seen as a positive element, and we can also understand why by listening to the latest earnings call :
Customer demand has been very strong, but we would not have been able to deliver against it without the improvements we have made in our business. Specifically, we have invested in equipment and technology and make process changes that allowed us to increase our Secure Card capacity by nearly 50% this year.
The company is investing in increasing production capacity to be able to keep up with market demand and to be able to grow in revenue. However, what is not a positive trend is the ratio between CapEx and depreciation (yellow line of the graph). We can see how the trend fluctuates, and even in the years from 2017 to 2021 the company probably invested too little in assets. This is causing a too-high use of capital in the last year.
In the last earnings call, the company said:
Our capital structure and allocation priorities remain focused on maintaining ample liquidity, investing in the business, including possible strategic acquisitions, de-leveraging the balance sheet, and potentially returning funds to stockholders. Consistent with these priorities, we continue to target further lowering our net leverage ratio over time.
In comparison with my previous analysis, it appears that structural investments in the business may be sustainable while any acquisitions or dividend payments are currently not financially viable.
Debt
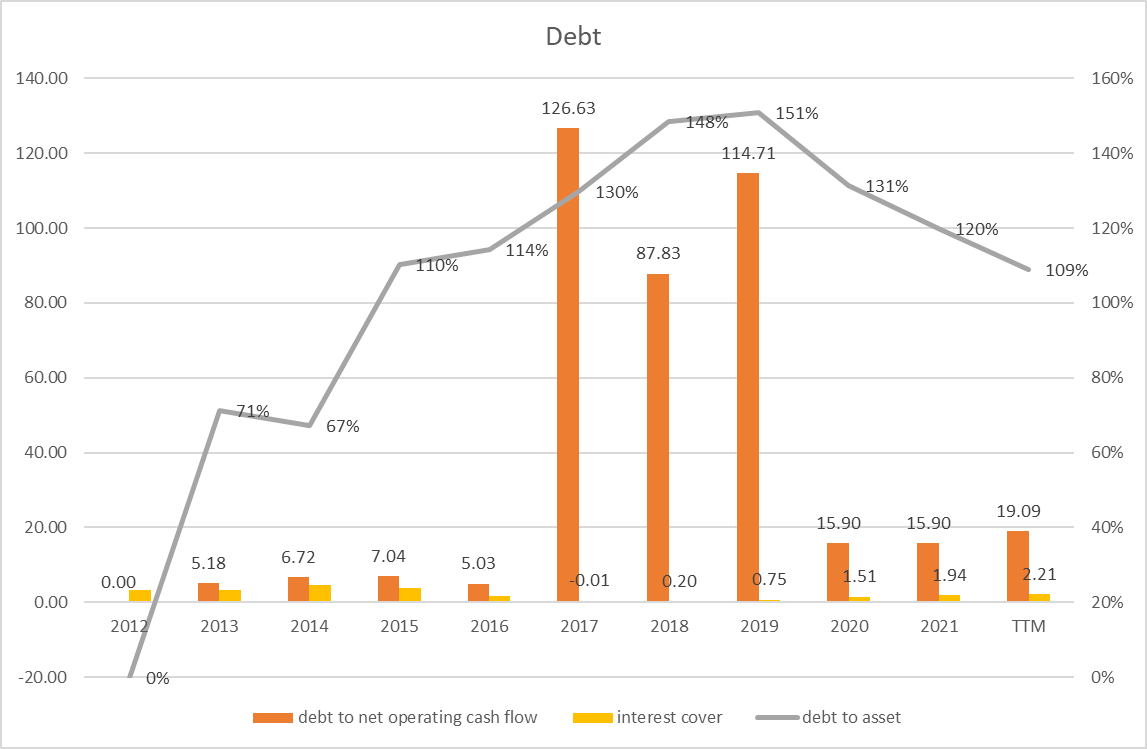
The gray line represents the ratio of total debt to total assets. Although the trend has been downward in the last 4 years, the figure is above 100% and this underlines a high risk.
The orange bars represent how many times the operating cash flow can repay the firm's total debt. Not considering the three years from 2017 to 2019, where the operating cash flow was close to zero (the company did not produce profits), the trend of the last 3 years is growing. The last value of 19.09 indicates that it takes about 19 years of the current operating cash flow to repay total debt. A long period!! Also, interest cover (which is not a measure of debt but a measure of how many times the company's profits can pay interest on the debt) is too low and indicates that the company can pay the interest on debt "only" 2 times.
PMTS Valuation
Assuming that the cash profit remains constant over the long term, I use the EPV (earnings power value) method to calculate the intrinsic share price value.
The method starts with EBIT. The second step is to add depreciation and amortization and then subtract stay-in-business CAPEX.
The result is the Cash Trading Profit
I then subtract the taxes by calculating the amount using the actual tax rate that the company pays.
The result is the After-Tax Cash Trading Profit.
At least to calculate the total company enterprise value, I divide the After-Tax Cash Profit by the interest Rate I define as fine for this kind of Company (PMTS is a risk company, so I decided to use 12%)
The result is the Total Company Earnings Power Value. Dividing the result by the total number of shares, we find the value per single share.
The table below shows the calculation for PMTS
| EBIT |
| 65.70 |
| Dep & amort |
| 14.50 |
| CAPEX |
| -19.70 |
| Cash Trading Profit |
| 60.50 |
| TAX |
| 30.20% |
| TAX |
| -18.271 |
| After TAX cash profit |
| 42.23 |
| Interest Rate |
| 12% |
| EPV |
| 351.9 |
| Share in issue |
| 11.3 |
| EPV per share |
| 31.1 |
$31.1 represents the share price valuation using the EPV method. If we compare the data with the current market price ($35), we see that the current price could be seen as a little bit overrated.
Peers Comparison
To compare PMTS with similar companies in the same Technology Hardware, Storage, and Peripherals industry, I have defined the following peers:
CompoSecure, Inc. (CMPO)
Canaan Inc. (CAN)
Intevac, Inc. (IVAC)
Quantum Corporation (QMCO)
WestRock Company (WRK).
Only WestRock is not in the same Industry field, but is defined as a competitor in the Company Form 10-k.
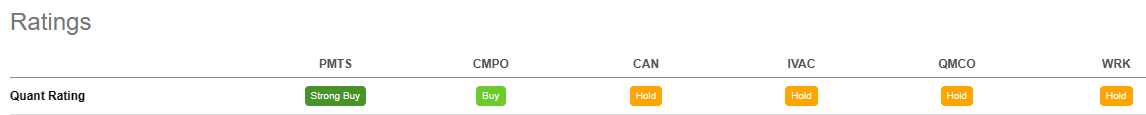
Using Seeking Alpha's Quant Ratings, we have a "Strong Buy" verdict related to the "Hold" or "Buy" rating of the other companies.
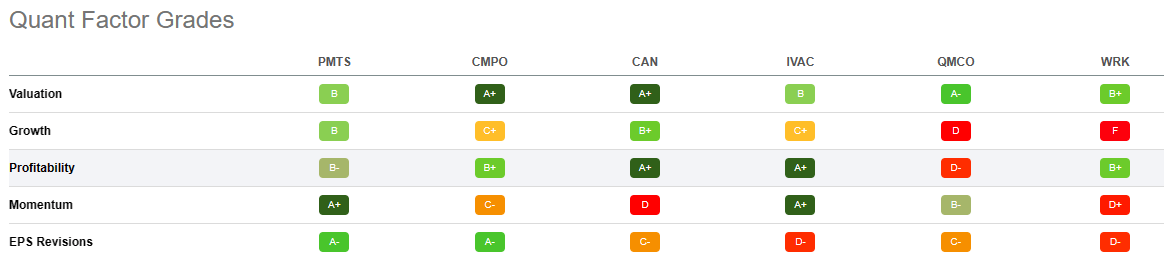
From the Quant Factor Grades point of view, we can see how CPI Card Group is outstanding in Momentum. In EPS Revisions, the grade is "A-" and CMPO (that is a direct competitor) reaches the same grade. Valuation is "B" and CMPO with "A+" could be preferred. In Growth and Profitability, other peers have the best grades.
The comparison of the Quant Factor Grades makes us understand how PMTS does not have outstanding evaluations in every area that can outclass the peers, but overall it has a factors mix that, at the moment, makes it favored over all the other peers.
A high debt level underlines a risky company
Reading the Company 10-K Form :
Our substantial indebtedness and the covenants and restrictions in the agreements governing our indebtedness limit our ability to use our cash flow in certain areas of our business, capitalize on certain business opportunities and pursue our business strategies, all of which could increase if we incur additional debt.
I can only agree that the above represents the major risk of a long-term investment in PMTS. The financial parameters analyzed in the previous paragraphs identify a too-high level of risk both on debt to company assets and, above all, on the ability to repay the debt (even in interest expense) through operating profits.
Conclusion
CPI Card Group Inc. is going through a very positive period also linked to favorable market factors. The revenue has a good increasing trend, while the EBIT grows but in a fluctuating way. Capital turnover probably represents the most positive parameter in terms of value creation for the company. A high rate of risk fueled by too much debt compared to company earnings and assets has led me to consider an investment in CPI Card Group Inc. too risky for my long-term investment approach. My rate is Hold.
For further details see:
CPI Card Group: Too Much Risk At Too High A Price