UBT - CPI Less Shelter Is Only 1.4%
2023-12-13 06:12:00 ET
Summary
- Shelter costs comprise about one-third of the CPI, and shelter costs are driven primarily by housing prices 18 months before.
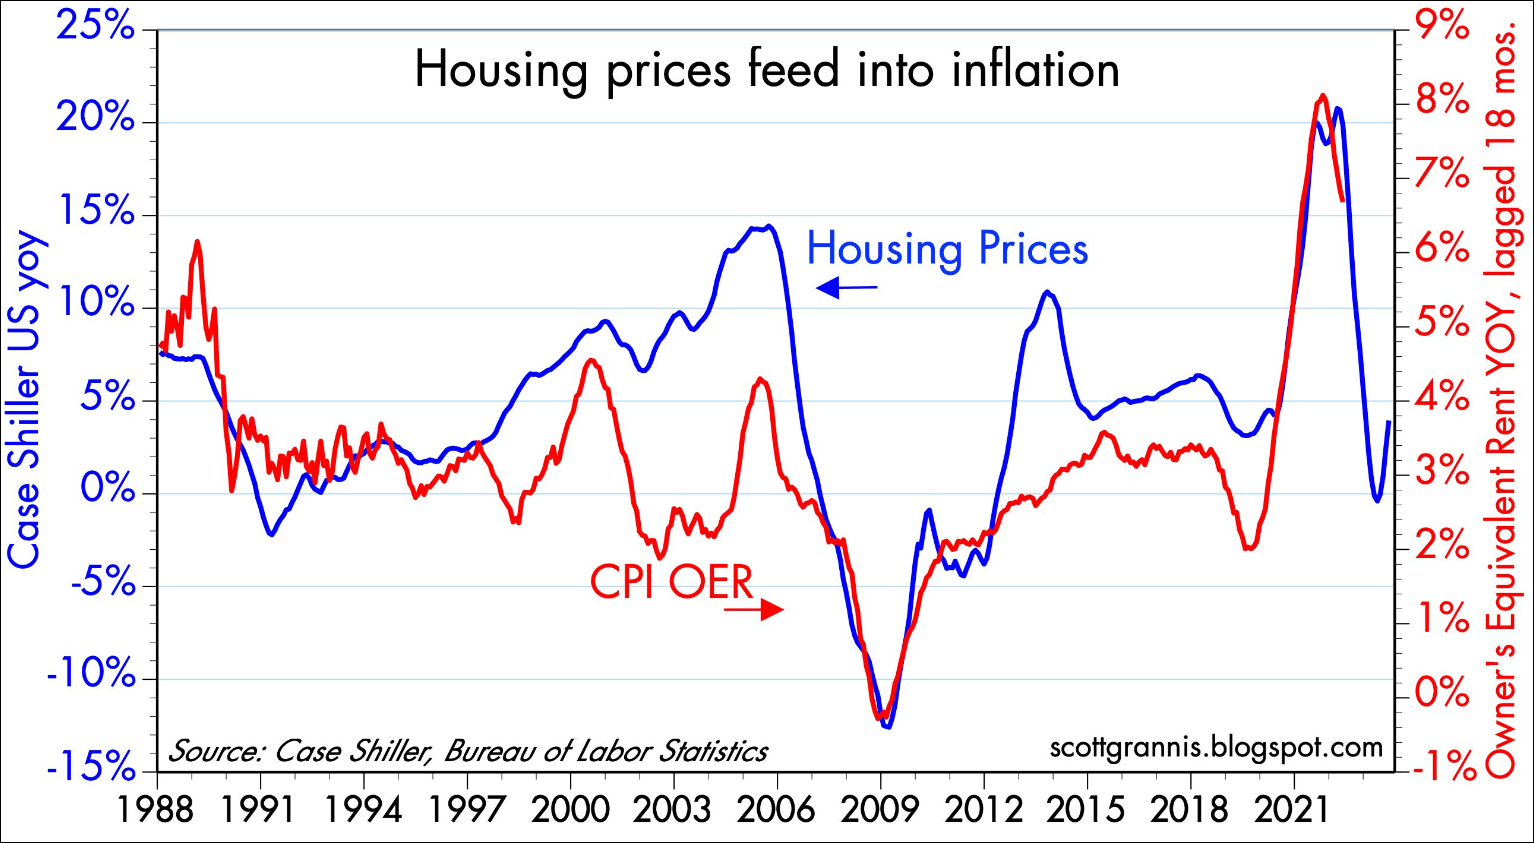
- The Owners' Equivalent Rent component of the CPI is primarily driven by changes in housing prices with a lag of about 18 months.
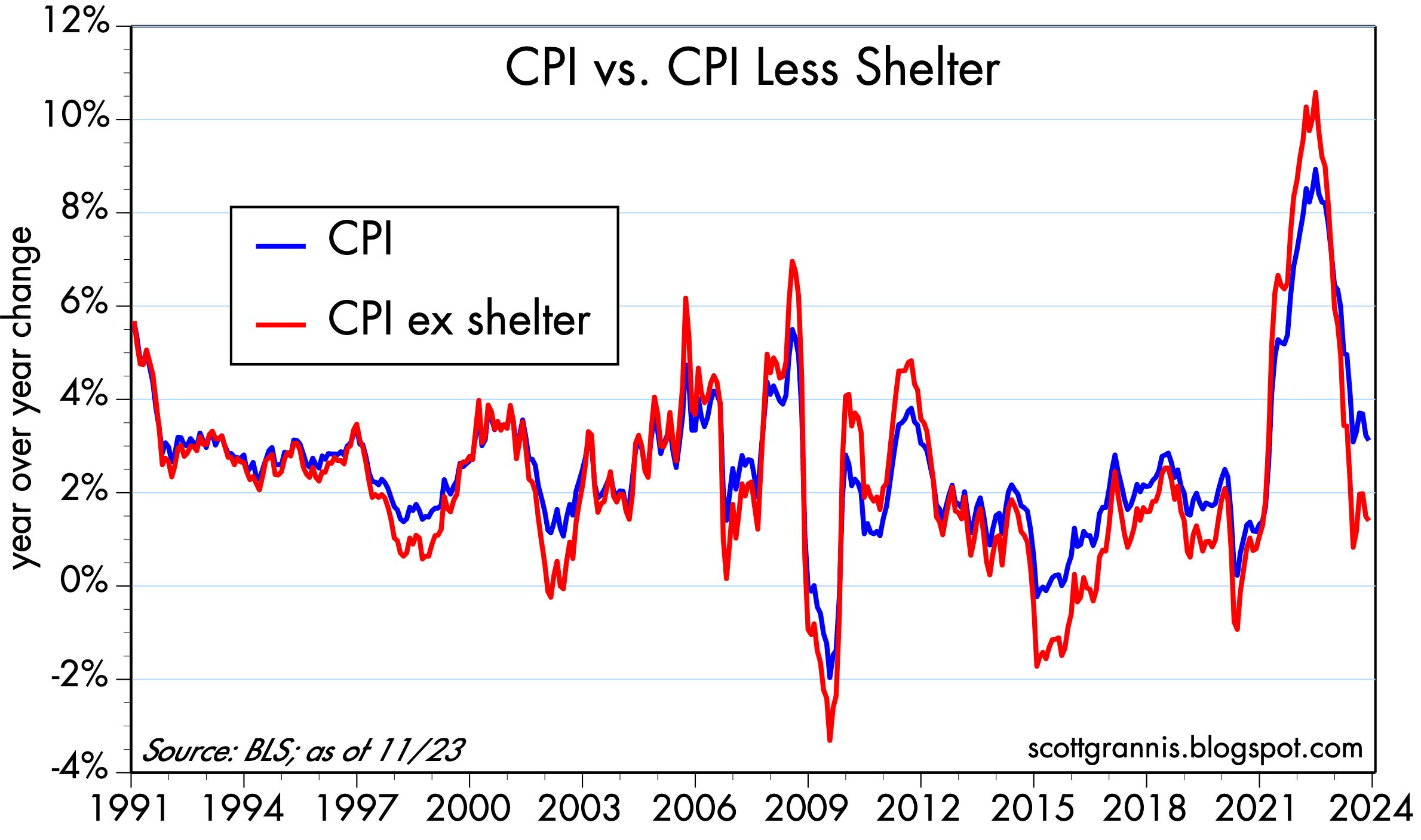
- The 6-mo. annualized rate of change of the CPI less shelter has been 2% or less for 11 of the past 12 months.
Shelter costs comprise about one-third of the CPI, and shelter costs are driven primarily by housing prices 18 months before. Which is to say that the way BLS goes about calculating the CPI is bogus. If we take out this bogus component of the CPI, we are left with the fact that the CPI rose a mere 1.4% in the 12 months ended November '23. Long story short: the Fed has successfully stomped out the inflation fires that started back in early 2021. The inflation that is still grabbing headlines today is an artifact of the crazy way that the government has decided to measure shelter costs.
Of course, shelter costs are not the source of inflation—they are the result of inflation. Since June 2022 , readers of this blog have known inflation was going to decline. That was when I confirmed the impressive decline in the M2 money supply. As I explained at the time, huge growth in M2 from 2020 to 2021, fueled by the monetization of Covid-related deficit spending, was the proximate cause of our national inflation nightmare. M2 continues to decline, and interest rates continue to be high (both of which mean monetary policy is tight), so shelter costs and the broader CPI will likely continue to decline as well.
Chart #1
As Chart #1 shows, the Owners' Equivalent Rent component of the CPI (red line) is primarily driven by changes in housing prices (blue line) with a lag of about 18 months. If this correlation continues (as is quite likely), then the contribution of OER to the CPI will be declining for another 12 months or so.
Chart #2
Chart #2 compares the year-over-year change in the CPI with a version of the CPI less shelter. Amazing fact: the 6-mo. annualized rate of change of the CPI less shelter has been 2% or less for 11 of the past 12 months!
Chart #3
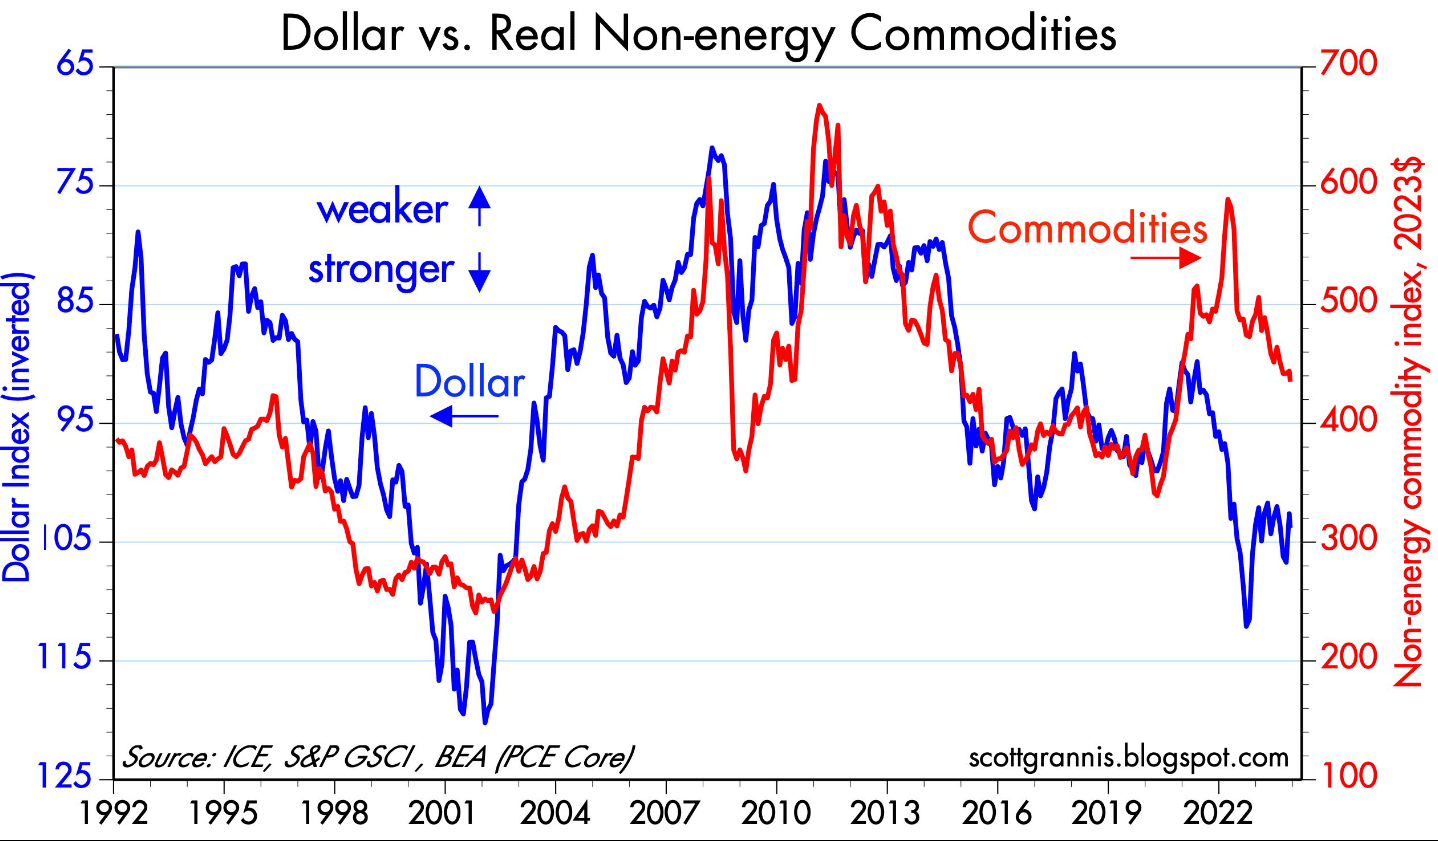
Chart #3 compares the value of the dollar (inverted, blue line) to the level of non-energy commodity prices. Normally, there is a strong inverse correlation between the value of the dollar and commodity prices. The strengthening of the dollar in recent years (shown here as a declining blue line) has exerted a strong deflationary influence on commodity prices, just as has happened during prior episodes of a stronger dollar (e.g., from 2011 through 2015). In inflation-adjusted terms, commodity prices have fallen by about 25% since March '22, which was just a few months before the CPI peaked in June '22. This lends further weight to the idea that inflation is continuing to decline. (Commodity prices usually react early to changes in monetary policy.)
If these trends continue to play out, don't be surprised when you see negative consumer price inflation within the next 6 months. And don't be surprised if the Fed figures this out and lowers interest rates well before, and by more, than the market currently expects.
Editor's Note: The summary bullets for this article were chosen by Seeking Alpha editors.
For further details see:
CPI Less Shelter Is Only 1.4%