DRI - Cracker Barrel Old Country Store: Shares Look Tasty Despite Signs Of Weakness
2023-08-22 11:53:12 ET
Summary
- Cracker Barrel's financial performance has been mixed, causing a decline in its stock price.
- Despite the decline, the company's revenue and comparable store sales have increased.
- Despite some issues, the company looks attractively priced and likely has some upside to it.
Even though I don't eat out as often as I used to, one of my favorite restaurants has historically been Cracker Barrel Old Country Store ( CBRL ). The ambience, the food, and the price, all coalesce to create an all-around pleasant experience that leaves me happy and full. But it's one thing to like what a company offers and a different thing entirely to decide whether the business in question makes for an attractive opportunity. Recently, financial performance achieved by Cracker Barrel has been quite mixed. And shares of the company have fallen in response. Even though the business has faced a good deal of pain from a share return perspective, the stock does look attractively priced at this time. In the near term, it is possible that shareholders might face additional pushback. But when you look at the overall picture and focus on the long haul, it becomes clear to me that the company still warrants a rather optimistic appraisal.
Dining woes
The last article that I wrote about Cracker Barrel was published in December of last year. In that article , I talked about how margins for the company were coming under pressure. This margin pressure was driven, according to the data, by inflationary issues that were impacting and that have continued to impact many companies across many industries. Even in spite of this, the continued growth in revenue for the company, combined with how cheap shares were, led me to rate the business a ‘buy’ to reflect my view at the time that the stock should outperform the broader market for the foreseeable future. Unfortunately, things have not played out quite that well. Even while the S&P 500 is up 9.9% since the publication of that article, shares of the company have seen a decline of 9.9%.
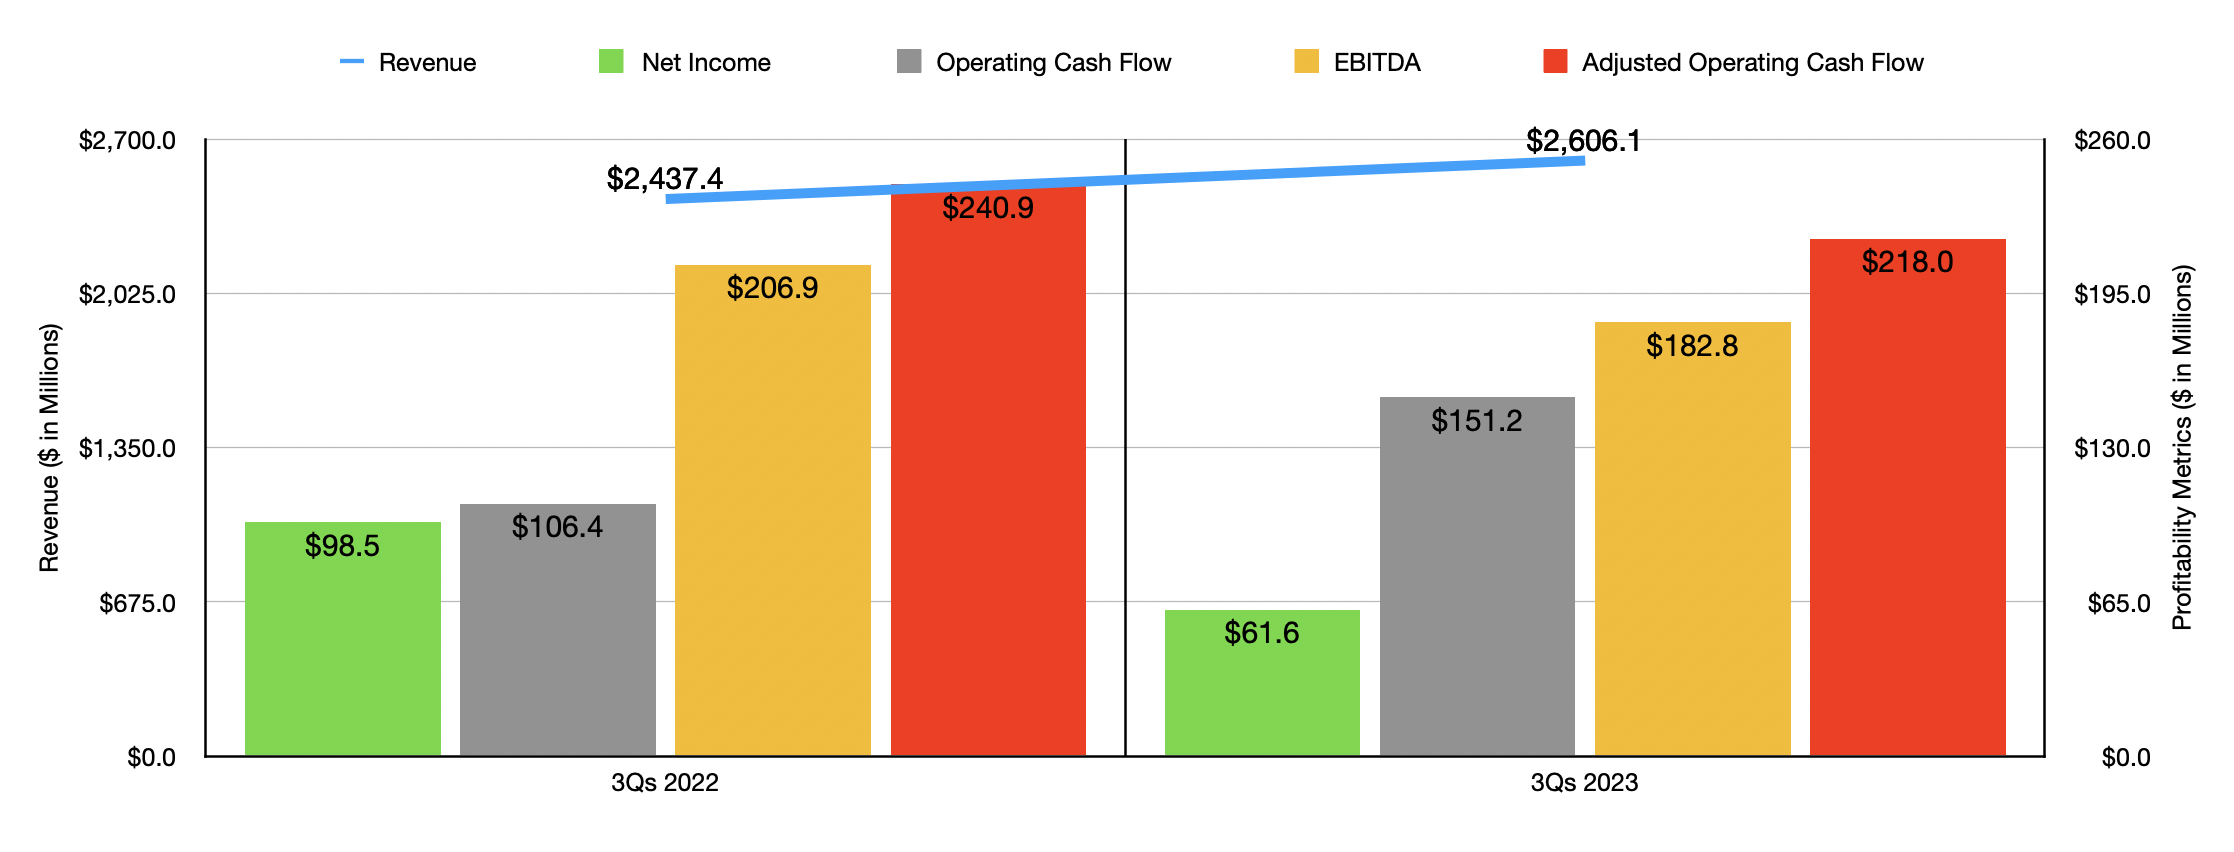
Given this returned disparity, you could be forgiven for thinking that the overall health of the business was suffering mightily. But that is not exactly what has transpired. There are some bright spots that investors should be aware of. For instance, if you look at the first three quarters of the 2023 fiscal year, you will see that revenue for the enterprise came in at $2.61 billion. That's 6.9% higher than the $2.44 billion management reported the same time last year. This increase in revenue was driven by a couple of different factors.
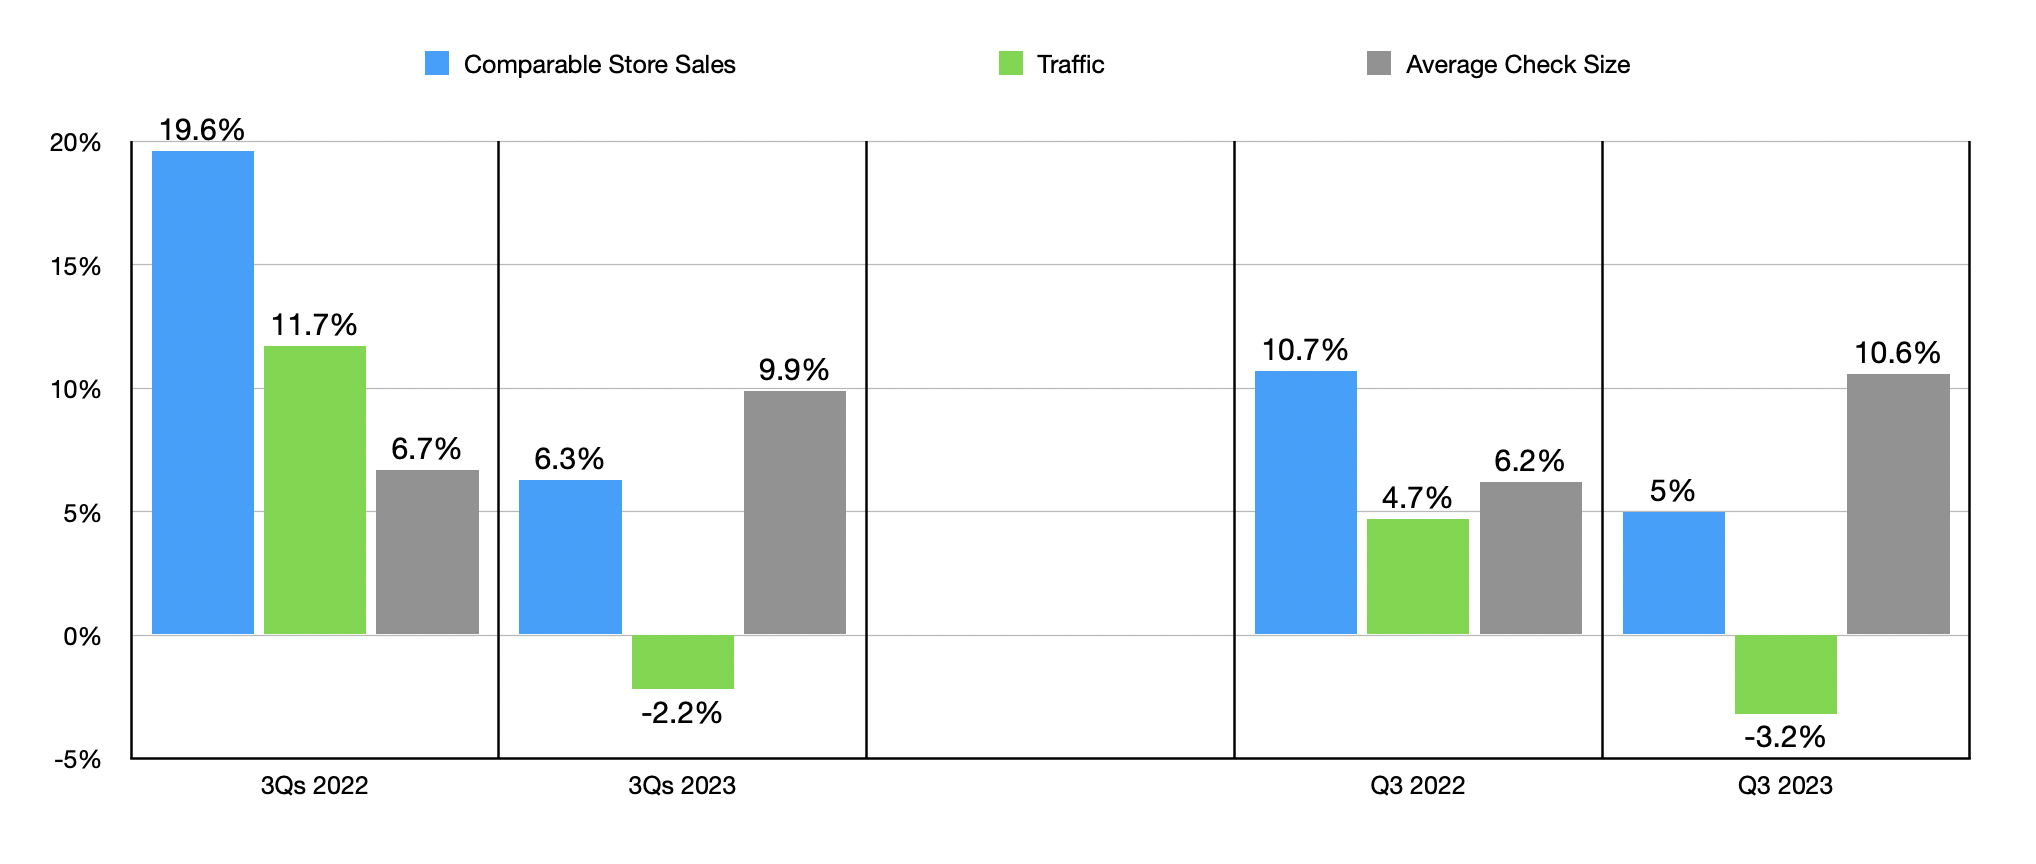
For starters, the number of company-owned stores that the business has in operation grew from 705 to 717. Even more important was an attractive outcome when it came to comparable store sales. Comparable store sales jumped 6.3% year over year. While this is weaker than the 19.6% seen the year prior, we need to keep in mind that in 2021 the business was still suffering significantly from the effects of the COVID-19 pandemic. This increase was driven by a 9.9% rise in average check size. While it is possible that each visitor was buying more food, the bulk of the increase certainly, or perhaps even all of the increase, was driven by management adjusting prices higher in order to combat inflation. This does bring to the forefront the negative side of the picture. And that is that the traffic experienced by the restaurants dropped 2.2% year over year. This makes sense when you consider that higher prices would deter customers from visiting a restaurant.
You would think that higher check sizes would translate to higher profits. But that is not exactly what occurred. In fact, by most measures, Cracker Barrel has suffered on its bottom line. Net income in the first nine months of the year totaled $61.6 million. That's a substantial haircut from the $98.5 million reported one year earlier. On the bright side, the company did see labor and other related expenses dropped from 35.1% of sales to 34.7%. However, cost of goods sold went from 31.9% of sales to 33.4%. This increase was driven by a commodity inflation that the company could not pass on to its customers. On the retail side of things, the increase was driven by higher inventory shrinkage and higher markdowns. Inventory shrinkage grew by 0.5% of sales while markdowns grew by 2.1%. Shrinkage is often associated with product theft. Which, in an inflationary period, would make sense to see. And the markdowns are likely in response to the reduced traffic at the company's locations.
Even though this increase in the cost of goods sold may not seem like much, when applied to the revenue achieved in the first three quarters of this year, it would translate to $39.1 million of additional costs on a pretax basis. The company also suffered from $13.9 million in impairment and store closing costs. Outside of net earnings, it is true that there was one improvement. And that was in operating cash flow. According to management, this metric grew from $106.4 million to $151.2 million. However, if you adjust for changes in working capital, you would see a decrease in it from $240.9 million to $218 million. Meanwhile, EBITDA for the enterprise declined from $206.9 million to $182.8 million.
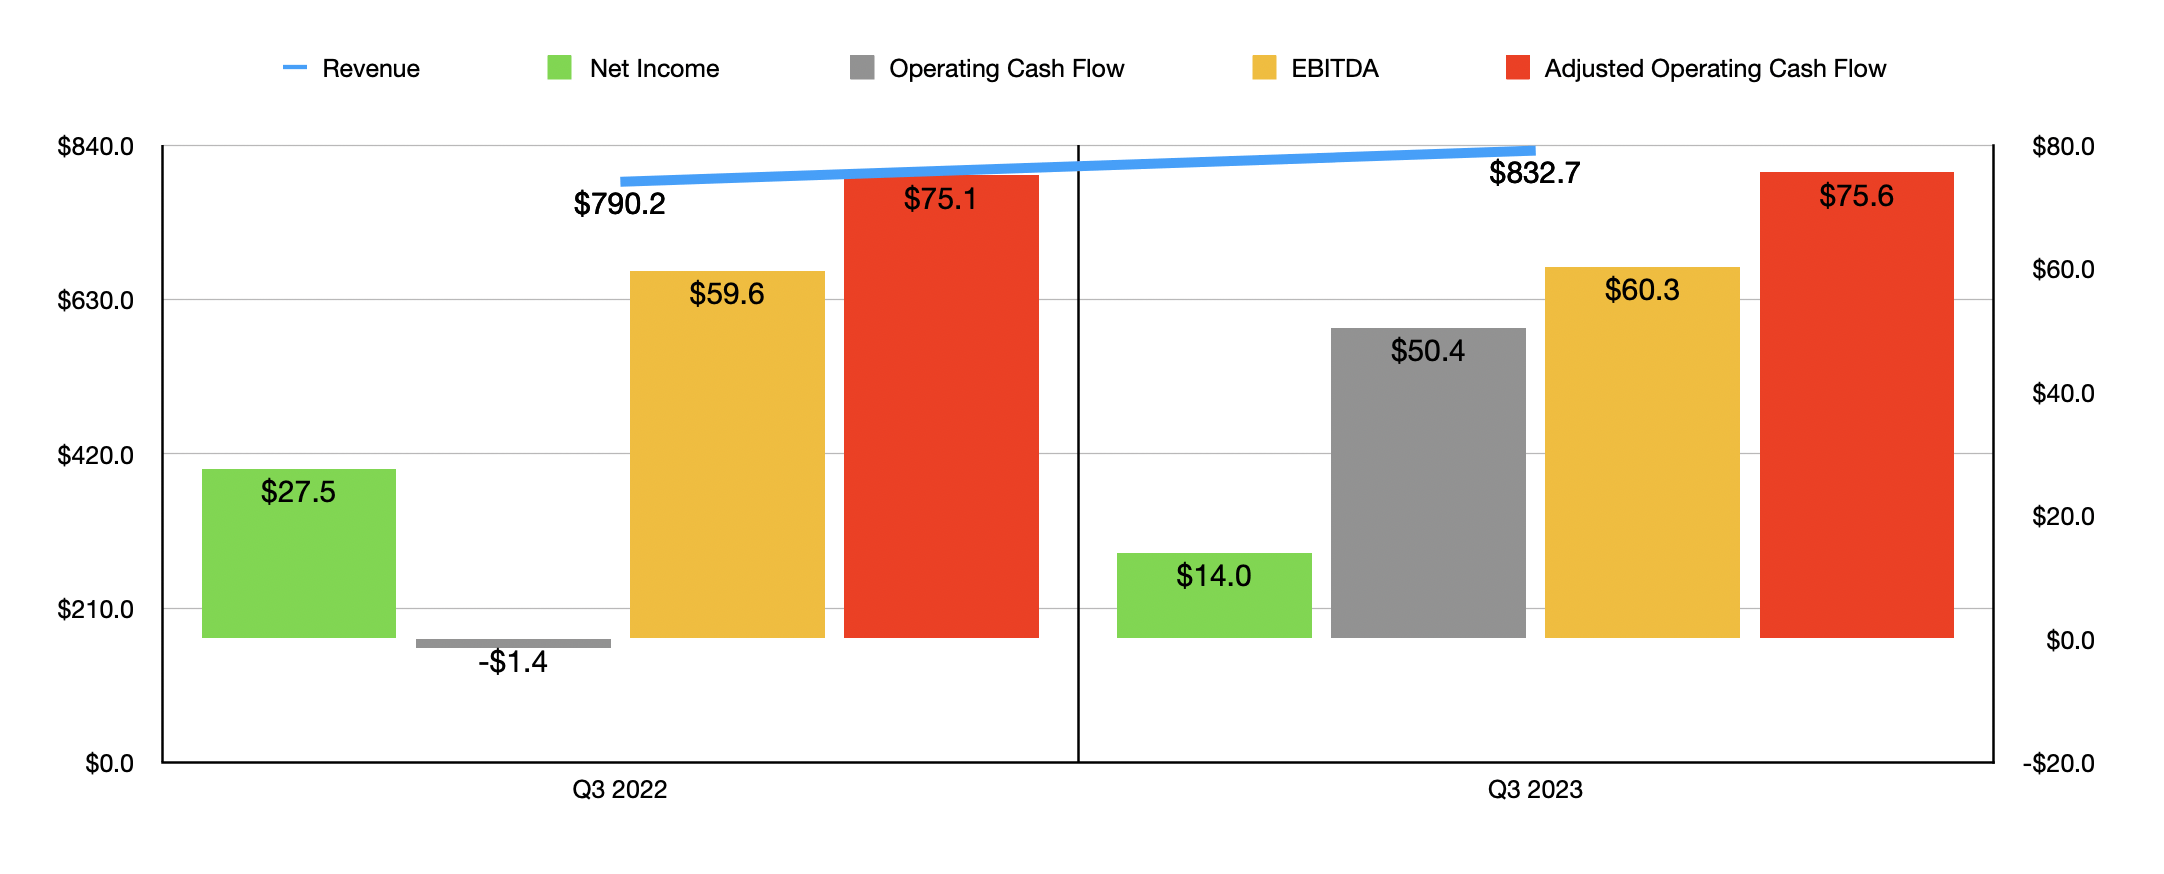
The troubles for the company persisted into the third quarter on its own as well. As you can see in the chart above, revenue increased year over year while net profits declined. What is notable, however, is that the other profitability metrics for the company, including adjusted operating cash flow and EBITDA, improved year over year. This is excellent to see and it suggests that the company is moving in the right direction. But even this has a bit of a dark side. The 5% rise in comparable store sales that the restaurant saw year over year was driven by a 10.6% increase in average check size and a 3.2% decline in traffic. So the company is seeing the trend of customers worsen year over year. In the short run, this is fine. But in the long run, it's not sustainable.
It is very important to point out that the restaurant industry has been facing some troubles this year. In an article published in June of this year on CNBC, for instance, it was pointed out that, in April, traffic at restaurants open at least a year fell 3.5% compared to the same time one year earlier. The website cited a study from December of last year that found that 74% of respondents were planning to reduce dining out. At one point during this inflationary period, there was optimism regarding the food away from home category. This is because, at that point, the food at home category was being faced with significant inflation. But that picture seems to be changing. According to the USDA, for instance, the food at home category from May of this year to June of this year saw prices drop by 0.1%. This compares to a 0.4% increase for the food away from home category. Year over year, the food at home category was up 4.7% while the food away from home category was up 7.7%. So long as this kind of trend persists, it's likely that traffic count at Cracker Barrel and elsewhere will suffer.
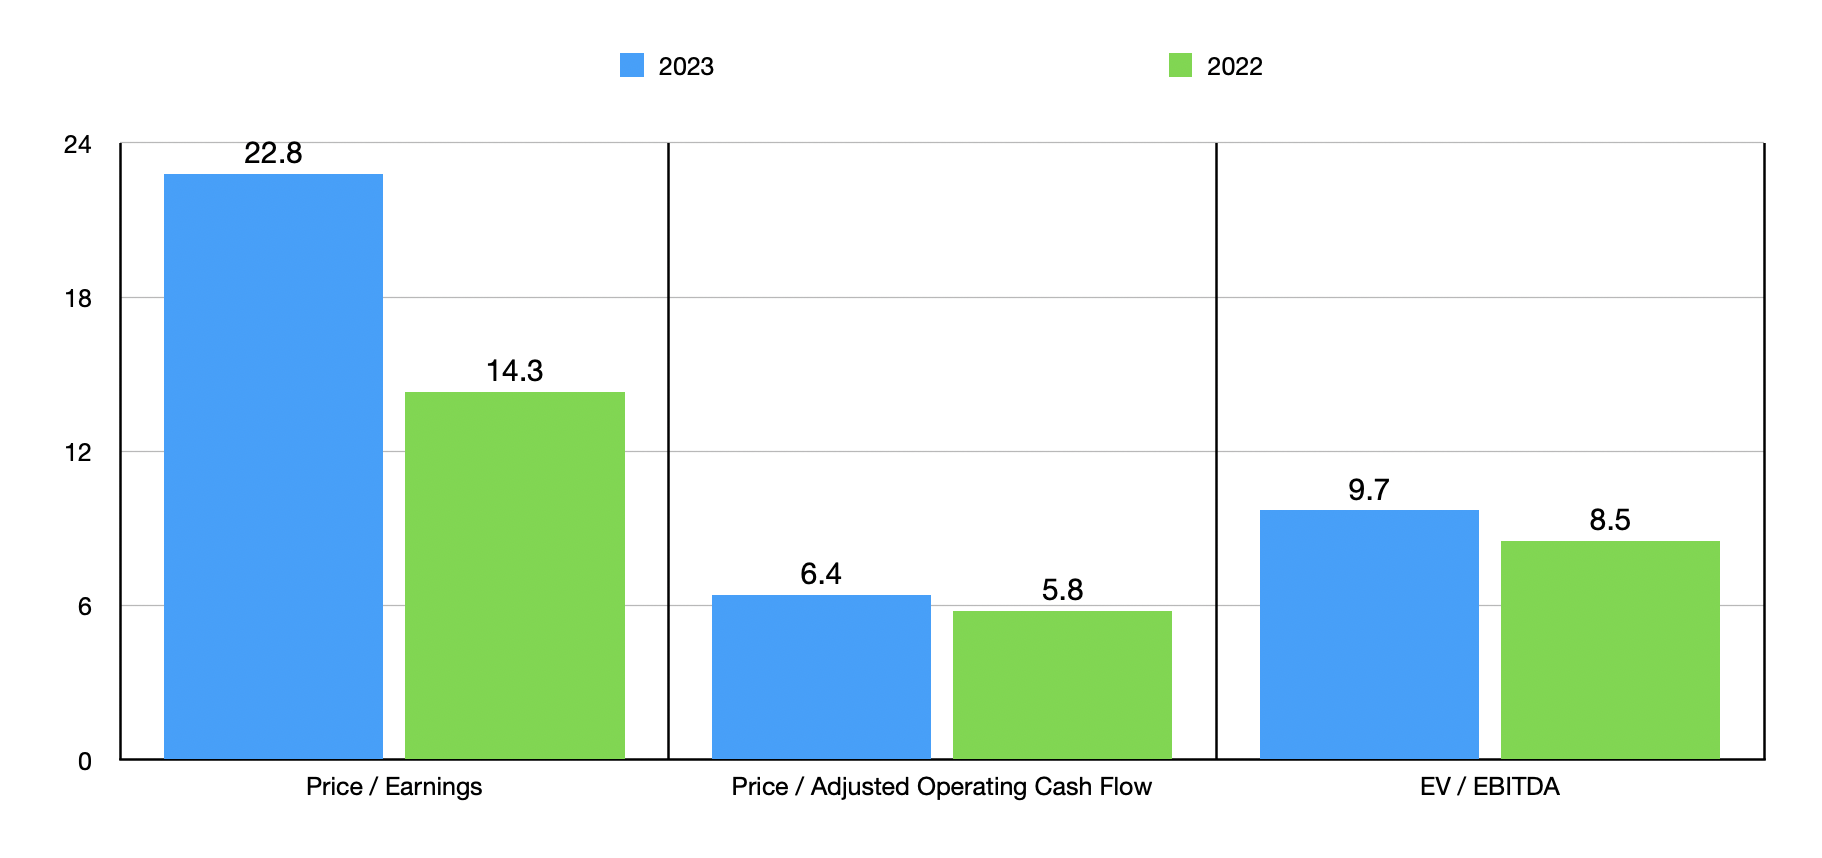
We don't know what to expect for the rest of this fiscal year. But if we annualize results experienced so far, we would expect net income for 2023 of $82.5 million. Adjusted operating cash flow would be $291.7 million, while EBITDA would come in at $237.9 million. Using these figures, you can see, in the chart above, how shares are priced on a forward basis. That same chart also looks at pricing using data from 2022. It is true that the stock looks expensive on a price to earnings basis. But when it comes to the other cash flow metrics, the stock looks attractively priced. In the table below, meanwhile, you can see how shares are priced compared to five similar firms. On a price to earnings basis, three of the five companies were cheaper than our prospect. And when it comes to the other two profitability metrics, two of the five were.
| Company |
| Price / Earnings |
| Price / Operating Cash Flow |
| EV / EBITDA |
| Cracker Barrel Old Country Store |
| 22.8 |
| 6.4 |
| 9.7 |
| Darden Restaurants ( DRI ) |
| 19.4 |
| 12.3 |
| 12.4 |
| Dave & Buster's Entertainment ( PLAY ) |
| 14.0 |
| 5.1 |
| 6.2 |
| Bloomin' Brands ( BLMN ) |
| 10.7 |
| 5.8 |
| 5.9 |
| Texas Roadhouse ( TXRH ) |
| 23.9 |
| 13.9 |
| 14.1 |
| The Cheesecake Factory ( CAKE ) |
| 24.3 |
| 9.0 |
| 12.8 |
Takeaway
Operationally speaking, Cracker Barrel has seen mixed results so far this year. But when you think about the long-term picture, you should be optimistic. Management continues to make investments in growing the business. Sales continue to climb, even on a comparable store basis. Eventually, the economy will adjust to price changes. And when it does, traffic will almost certainly come back to the space. Add in how shares of the company are priced on an absolute basis and consider that shares look fairly valued compared to similar enterprises, and I have no reason to rate the company anything lower than a soft ‘buy’.
For further details see:
Cracker Barrel Old Country Store: Shares Look Tasty Despite Signs Of Weakness