CACC - Credit Acceptance: Today's Best Near-Term Cap-Gain Financial Services Prospect
2023-04-21 09:08:25 ET
Summary
- “Best” in comparison to Risk~Reward tradeoffs of an equity investor’s today alternatives, as seen by “institutional investor” experienced evaluators and Market-making professional traders.
- Definitions: Reward = profit from capital employment. Risk = Actual loss of capital. Forget appraising the discomfort of uncertainty: We’re dealing with the unavoidable future.
- Committing investment capital means choosing between alternatives whose futures require forecasts. Expectations of future defined by humans who are known to amend their notions as perceptions change.
- These articles use Behavioral Analysis intended to provide forecasts for equity investment subjects [stocks, ETFs, REITs] which probably may experience rising market prices in next 3-5 months: Near-term expectations only.
- Drawn from a 3,000+ equity population updated daily they infer “Institutional”[big-$] investor coming-price influences seen in recent-past volume block-trade orders facilitated by Market-Makers.
This article has as its primary focus Credit Acceptance Corporation ( CACC ).
Investment Thesis
Behavioral Analysis is not "fundamental investment analysis" readily well-covered by Seeking Analysis and its contributors. Nor is it "Quant Analysis" the alpha-rank & numeric-scale comparisons between investing alternatives done by Seeking Analysis as perhaps best today of any evaluator group for public consumption in guiding timely preferences between equity selections.
So why bother with any other evaluation method? Answer: Uncertainty and the complexity of presentation it requires. All investment analysis is an effort to forecast future price-change events where uncertainty of outcomes ranges widely.
For the individual investor the assembly of information to make an informed "forecast" of coming prices requires amounts of personal time investment well beyond what may be considered available. Even taken from SA's well-organized and extensive presentation.
Instead, behavioral analysis can provide such forecasts in specific, easy to understand share price limits , with odds of their likely encounter.
This comes from the required actions of Market-Making firms as they negotiate large-volume "block trades" among "institutional investors". To avoid "front-running" trades by constantly alert opportunists, such trades must be accomplished privately and quickly, since often their existence either may create or telegraph upcoming price changes. Deal closure requires share delivery, where shares usually are obtained by temporary short borrowed positions.
The MMs will only take the price-change risk involved where it can be insured against by contracts in derivative securities during the brief transition. Such protective deals are provided by other informed volume speculators acting to earn an "insurance" fee on "the other side of the initiating trade". Terms of the protection deal reveal the coming price extremes held likely during the derivatives lifetimes, typically weeks to a few months.
Such behavior supports thousands of stocks' daily trade activities. Subsequent market price actions provide a sense of how well the MMs tend to anticipate price changes. We note their "Win" odds at varying levels of balance between upside and downside price limits of expectations from the trade's market quote.
This history of behavioral forecasts provides "point-in-time" performance information in ways often envied by other means of analysis where their background comes from simple past history having no intended forecast content.
Thus the individual investor can quickly and easily have risk and reward prospects presented in simple share price terms with odds of likely experience available from motivated, well-informed participants in each investment prospect. The brief holding periods seen involved in the MM price-change limits accelerates performance CAGR rates, and wealth accumulation is compounded by frequent repetitive capital employment.
No outcome guarantees, but a sense of informed comparisons between alternatives is offered in each article.
Description of Primary Investment Candidate
"Credit Acceptance Corporation engages in the provision of financing programs, and related products and services to independent and franchised automobile dealers in the United States. The company advances money to automobile dealers in exchange for the right to service the underlying consumer loans; and buys the consumer loans from the dealers and keeps the amount collected from the consumers. It is also involved in the business of reinsuring coverage under vehicle service contracts sold to consumers by dealers on vehicles financed by the company. The company was incorporated in 1972 and is headquartered in Southfield, Michigan."
Source: Yahoo Finance
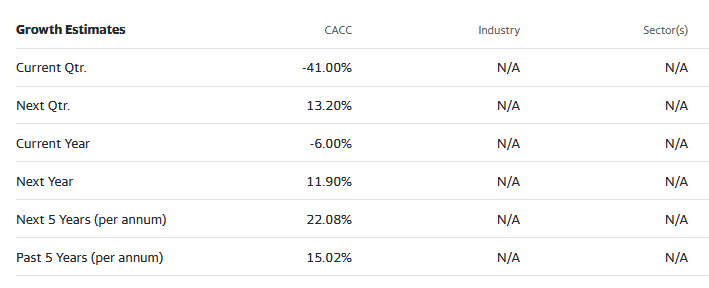
These growth estimates have been made by and are collected from Wall Street analysts to suggest what conventional methodology currently produces. Here there was limited analyst coverage. The typical variations across forecast horizons of different time periods illustrate the difficulty of making value comparisons when the forecast horizon is not clearly defined.
Risk and Reward Balances Among CACC Competitors
Here are several Credit Services providers like CACC, but few so on such a broad and infrastructure focus. Following the same analysis as with CACC, historic sampling of their prior Risk-Reward balances like those of today were taken, and are mapped out in Figure 1.
Figure 1
blockdesk.com
(used with permission)
Expected rewards for these securities are the greatest gains from current closing market price seen worth protecting MM short positions. Their measure is on the horizontal green scale.
The risk dimension is of actual price draw-downs at their most extreme point while being held in previous pursuit of upside rewards similar to the ones currently being seen. They are measured on the red vertical scale.
Both scales are of percent change from zero to 25%. Any stock or ETF whose present risk exposure exceeds its reward prospect will be above the dotted diagonal line. Capital-gain attractive to-buy issues are in the directions down and to the right.
Our principal interest is in CACC at location [1]. A "market index" norm of reward~risk tradeoffs is offered by SPY at [2]. Most appealing (to own) by this Figure 1 view is ALLY [8]. But this is not the whole story.
Comparing features of Alternative Investment Stocks
The Figure 1 map provides a good visual comparison of the two most important aspects of every equity investment in the short term. There are other aspects of comparison which this map sometimes does not communicate well, particularly when general market perspectives like those of SPY are involved. Where questions of "how likely' are present other comparative tables, like Figure 2 , may be useful..
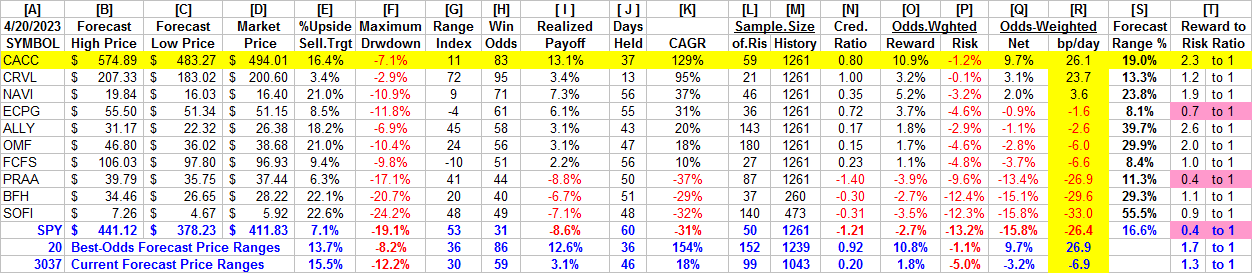
Yellow highlighting of the table's cells emphasize factors important to securities valuations and the security CACC, most promising of near capital gain as ranked in column [R]. Pink highlighting warns of below norms or potentially inadvisable conditions.
Figure 2
(used with permission)
Why do all this math?
Figure 2's purpose is to attempt universally comparable answers, stock by stock, of a) How BIG the prospective price gain payoff may be, b) how LIKELY the payoff will be a profitable experience, c) how SOON it may happen, and d) what price draw-down RISK may be encountered during its holding period.
Readers familiar with our analysis methods after quick examination of Figure 2 may wish to skip to the next section viewing Price range forecast trends for CACC .
Column headers for Figure 2 define investment-choice preference elements for each row stock whose symbol appears at the left in column [A]. The elements are derived or calculated separately for each stock, based on the specifics of its situation and current-day MM price-range forecasts. Data in red numerals are negative, usually undesirable to "long" holding positions. Table cells with yellow fills are of data for the stocks of principal interest and of all issues at the ranking column, [R].
The price-range forecast limits of columns [B] and [C] get defined by MM hedging actions to protect firm capital required to be put at risk of price changes from volume trade orders placed by big-$ "institutional" clients.
[E] measures potential upside risks for MM short positions created to fill such orders, and reward potentials for the buy-side positions so created. Prior forecasts like the present provide a history of relevant price draw-down risks for buyers. The most severe ones actually encountered are in [F], during holding periods in effort to reach [E] gains. Those are where buyers are emotionally most likely to accept losses.
The Range Index [G] tells where today's price lies relative to the MM community's forecast of upper and lower limits of coming prices. Its numeric is the percentage proportion of the full low to high forecast seen below the current market price.
[H] tells what proportion of the [L] sample of prior like-balance forecasts have earned gains by either having price reach its [B] target or be above its [D] entry cost at the end of a 3-month max-patience holding period limit. [ I ] gives the net gains-losses of those [L] experiences.
What makes CACC most attractive in the group at this point in time is its high proportion of profitable outcomes - 7 out of every 8 positions following Range Indexes of 11, where upside price changes are 9 times as large as downside prospects, higher than most being offered in [E]. The competition's prior prospects had similar opportunities, but as evidenced now in [I], were not nearly as successful as CACC.
Further Reward~Risk tradeoffs involve using the [H] odds for gains with the 100 - H loss odds as weights for N-conditioned [E] and for [F], for a combined-return score [Q]. The typical position holding period [J] on [Q] provides a figure of merit [ fom ] ranking measure [R] useful in portfolio position preferencing. Figure 2 is row-ranked on [R] among alternative candidate securities, with CACC in top rank.
Along with the candidate-specific stocks these selection considerations are provided for the averages of some 3000+ stocks for which MM price-range forecasts are available today, and 20 of the best-ranked (by fom ) of those forecasts, as well as the forecast for S&P500 Index ETF ( SPY ) as an equity-market proxy.
Current-market index SPY is not competitive as an investment alternative as its seriously negative basis points per day of -26 and CAGR equivalent of -319% indicates. Less than half of previous SPY forecasts at this range index produced profitable outcomes, with enough losers to put its average in negative result, much like many of the competitors.
As shown in column [T] of figure 2, those levels of Reward to Risk vary significantly between stocks. What matters is the net profit between investment gains and losses actually achieved following the forecasts, shown in column [I]. The Win Odds of [H] tells what proportion of the Sample RIs of each stock were profitable. Odds below 80% often have proven to lack reliability.
Price range forecast trends for CACC
Figure 3
blockdesk.com
(used with permission)
No, this is not a "technical analysis chart" showing only historical data. It is a Behavioral Analysis picture of the Market-Making community's actions in hedging investments of the subject. Those actions define expected price change limits shown as vertical bars with a heavy dot at the closing price on the date of the forecast.
It is an actual picture of experienced market professionals' expected future prices, not a simple hope of a recurrence of the past. These expectations are backed up by significant bets of investment capital made to protect market-makers or earn a proprietary profit from risk-taking.
The special value of such pictures is their ability to immediately communicate the balance of expectation attitudes between optimism and pessimism. We quantify that balance by calculating what proportion of the price-range uncertainty lies to the downside, between the current market price and the lower expected limit, labeled the Range Index [RI].
In the case of CACC rising expectations of likely further coming prices offer encouragement that prior history can be revisited, since the Range Index is kept low by price expectations rising more than market quotes.
Here a RI at 11 indicates upside price change to at least the forecast minimum is likely, but not guaranteed. The odds of 3 months passing without either reaching or exceeding the upper forecast limit or being at that time below the expected lower price (today's) are quite slight.
The probability function of price changes for CACC are pictured by the (thumbnail) lower Figure 3 frequency distribution of the past 2+ years of RI values with the today value indicated. There few experiences have been in lower RI evaluations or as can be seen in the larger picture, lower prices. The price rise in January of this year justifies the price range upside forecasts of late 2022. Its higher RI is a visual warning of the coming decline in February-March.
Conclusion
The multi-path valuations explored by the analysis covered in Figure 2 is rich testimony to the near-future value prospect advantage of a current investment in Credit Acceptance Corporation over and above the other compared alternative investment candidates.
For further details see:
Credit Acceptance: Today's Best Near-Term Cap-Gain Financial Services Prospect