CAPL - CrossAmerica Partners: 9% Yield 85% ROE Helped By Capital Structure
2023-11-22 03:48:03 ET
Summary
- CrossAmerica Partners LP is a quality business with fairly robust economic characteristics.
- The company operates in the wholesale distribution of motor fuels and retail sales, diversifying its revenue streams.
- Despite a decrease in earnings, the company has shown resilience in market value and has been compounding shareholder wealth over time.
Investment outlook
In a world of heightened volatility, higher yields, and tighter money, quality businesses with robust economic characteristics stand front and centre. After extensive analysis, CrossAmerica Partners LP ( CAPL ) is one such name in my view. A more thoughtful analysis was warranted with the stock trading at 11x forward EBITDA, 0.4x forward sales and a 13% cash flow yield.
The company's 9% trailing dividend yield is reasonably well supported, with 8 years of consecutive payments. There is a substantial case for buying CAPL for this kind of yield. The company can support its current payout (as you'll see here today) and the market will continue to discount its payments to a fair value.
This report will not look at this factor but at what you'd get out of this for capital gains, where business returns and FCF growth are paramount in different ways.
CAPL runs a multifaceted portfolio engaged in the wholesale distribution of motor fuels. This facet extends to:
- Ownership or leasing of sites dedicated to retail fuel distribution. This generates rental income through lease or sublease.
- Additionally, it sells motor fuels directly to end customers.
- Beyond fuel distribution, the company operates retail sites. This involves the sale of motor fuels but also includes the retail sales, further diversifying the company's revenue streams.
The distribution of CAPL's offering at multiple points along the value chain is intriguing. Does this pull its economic weight? And what value are we observing as shareholders.
Analysis of (i) the company's latest numbers and (ii) the firm's value drivers using sound economic principles, indicate value investors may be better served parking capital elsewhere. The investment facts pattern is:
- The company is coming off a high growth period,
- It is highly profitable, thanks to leverage effects,
- Business returns don't match up to the net returns on capital.
Net-net, I rate CAPL a hold for the reasons raised in this report.
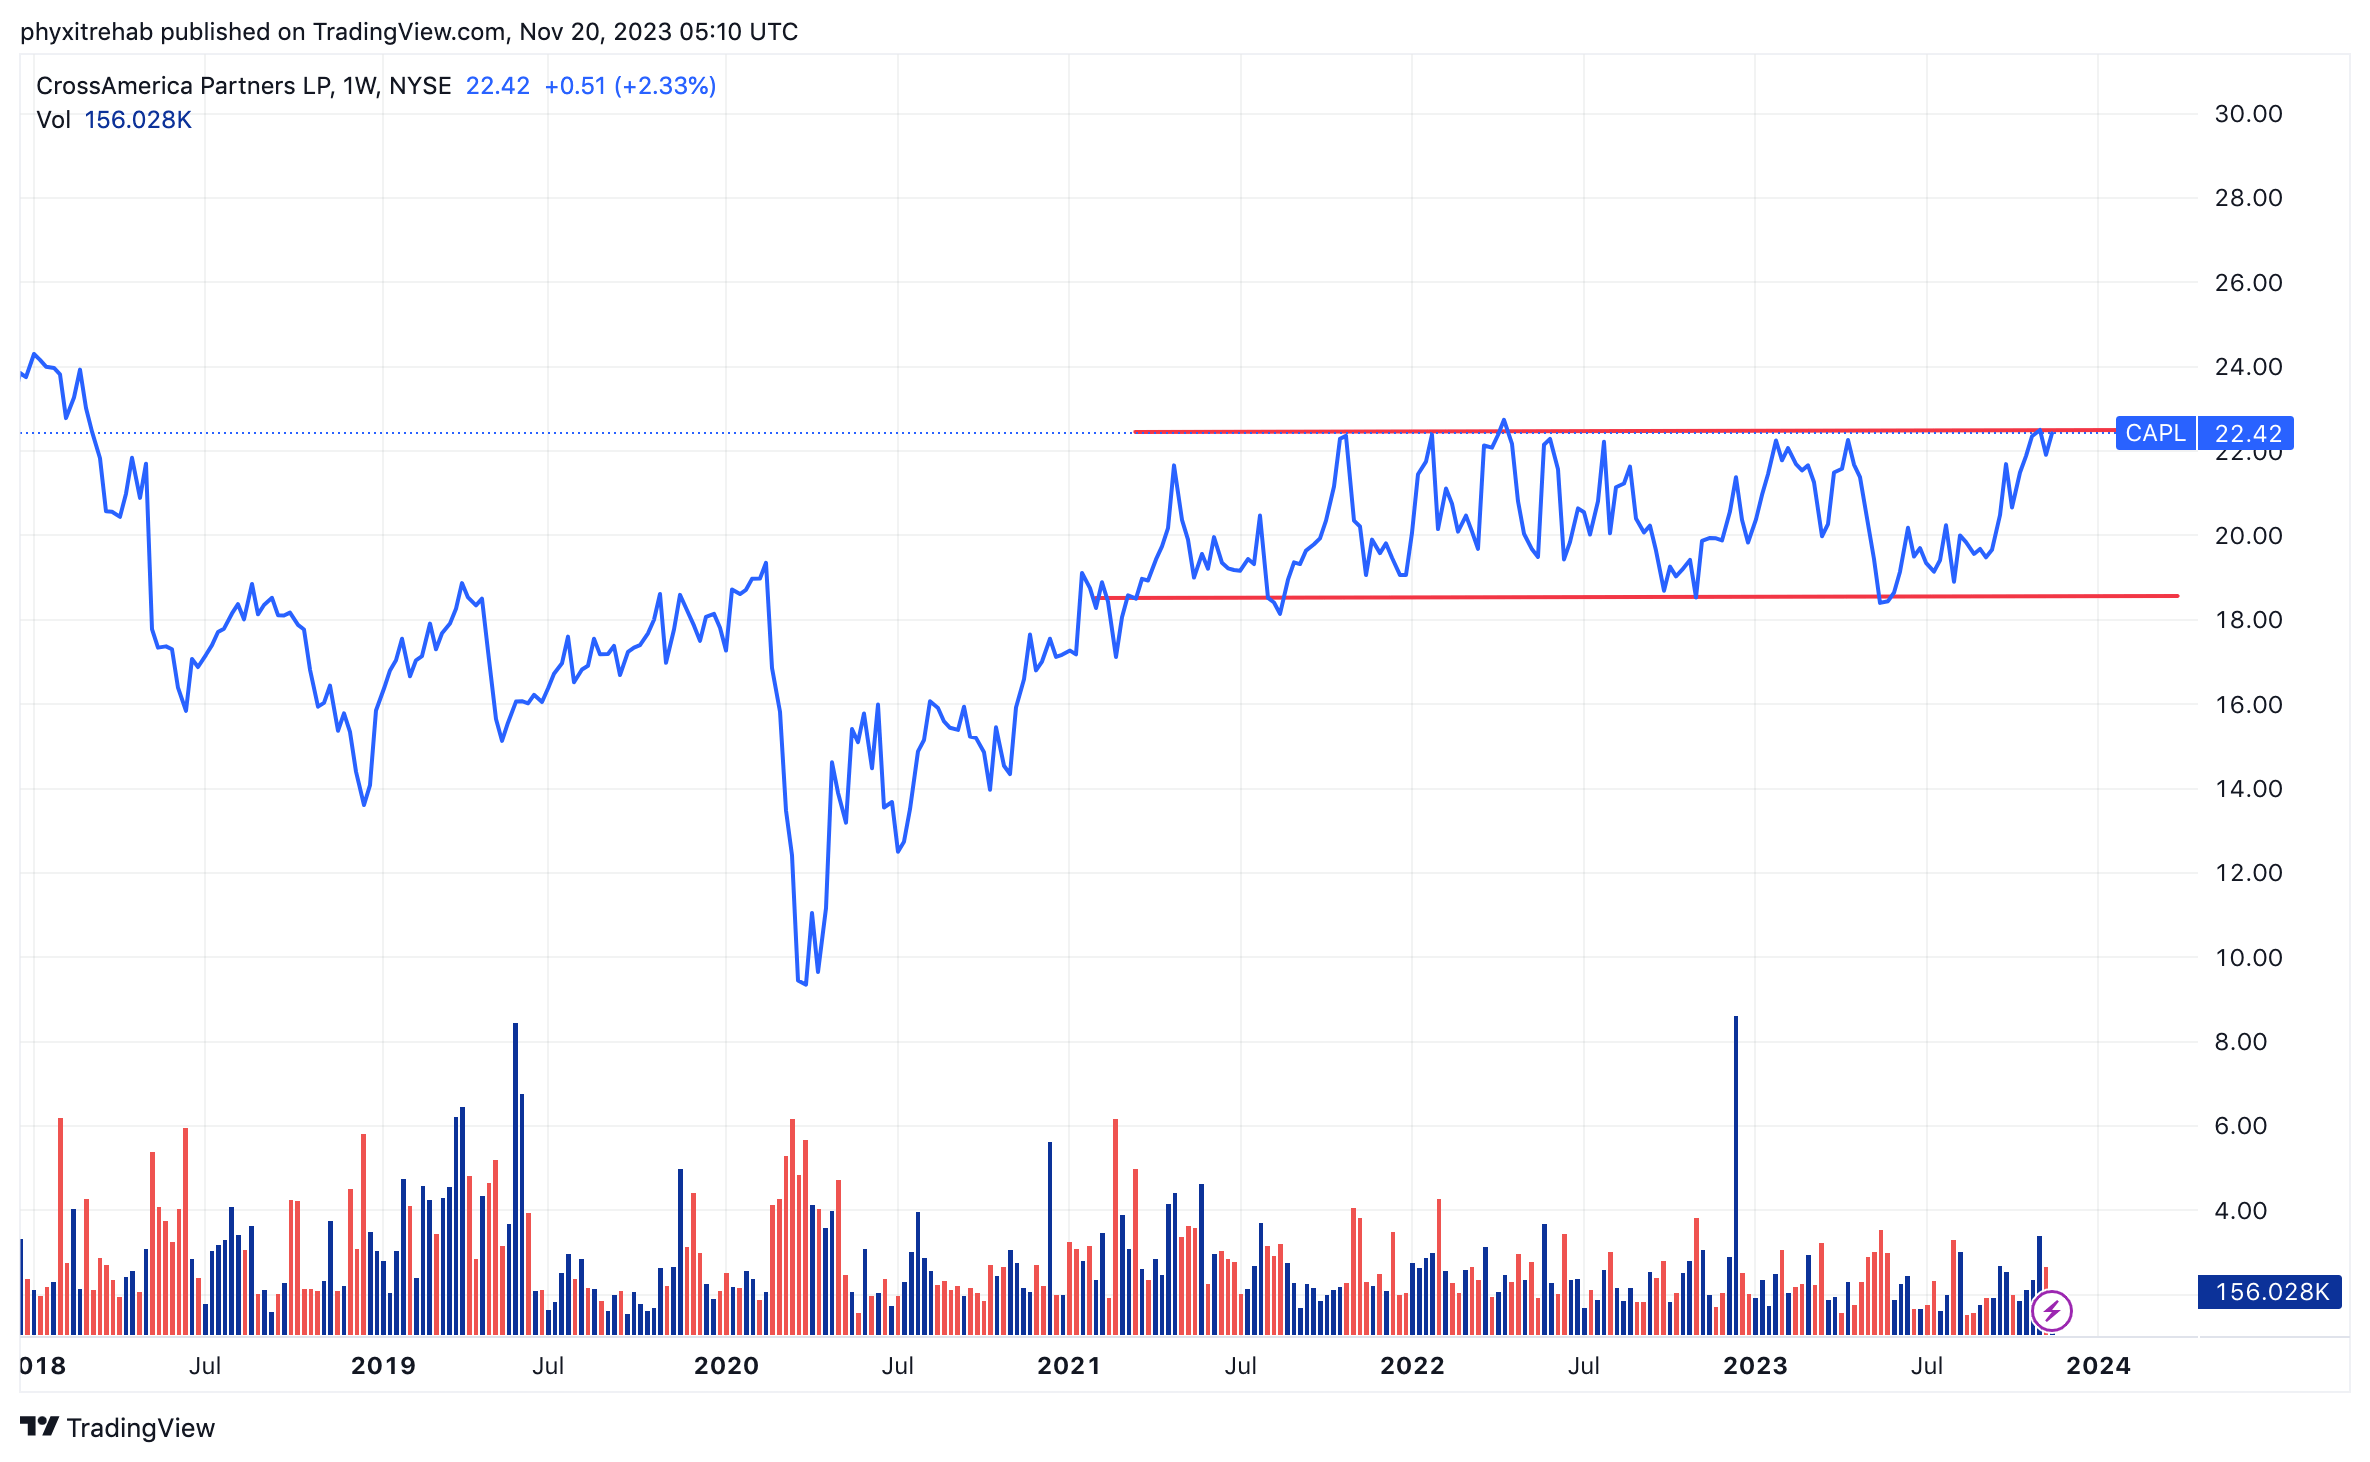
Figure 1. CAPL trading in a range since 2019
Critical investment facts forming the thesis
1. Q3 Earnings Insights
The company came off a period of strong business last year, so its Q3 numbers were mixed. This was to be expected, so he post-earnings drift in market value has been negligible.
In Q3 the company clipped adj. EBITDA of $44.2mm, a notable decrease from $62.6mm last year, on earnings of $12.3mm down 55% YoY. This was to be expected seeing the abnormal fuel margins observed in Q3 '22. As evidence of positive quarter, distributable cash flow was up $16mm YoY to $31.4mm.
Operational dynamics include the following:
-
Inside sales and merchandise gross margin:
- Inside sales on a same-site basis increased by c.4% YoY, demonstrating resilience of the core business. In fact, as seen in Figure 1, the business has been sturdy in market value too. Despite the sharp selloff in broad market values in '22, CAPL has traded flat. This kind of top-line performance signals one reason why.
- Excluding cigarettes, same-store inside sales were up 9% YoY growth.
- Merchandise gross margin decompressed by 160 basis points, lifting gross profit 23% YoY to $25.4mm.
-
Wholesale fuel segment, fuel margin + volume:
- Wholesale fuel gross profit was down 4% YoY, reaching $18.8mm compared to $19.5mm in Q3 last year.
- The Wholesale fuel margin contracted by 7%, declining from $0.092 per gallon in Q3 2022 to $0.086/gallon.
- Q3 wholesale volume increased to $217.3mm gallons, a 2% YoY growth, with contribution from community service station assets made in Q4 '22.
- Capital expenditures + use of capital
- CapEx investment was $10.4mm, with $8.5mm attributed to growth investments.
- Fuel usage prices were the major factor and used working capital during Q3. The company had $762mm under its total credit facility balance, so is well captilalized to absorb short-term fluctuations.
- The other thing is it disposed 8 properties to recognize $8.3mm in capital proceeds. According to the CEO, the firm is looking to " free up capital in this manner, which we will either put towards reducing leverage or investing in growth opportunities. "
So allocation over the coming 12 months is something I would be closely watching. It seems as if there's a bias to getting money out in the field. The market has been receptive to this lately, so keep an eye on it for CAPL.
2. Economic value
The prospect of adding CAPL to our book boils down to two critical notions:
(1). Is the company growing its FCF per share (or wealth) over time,
(2). How well is it doing so.
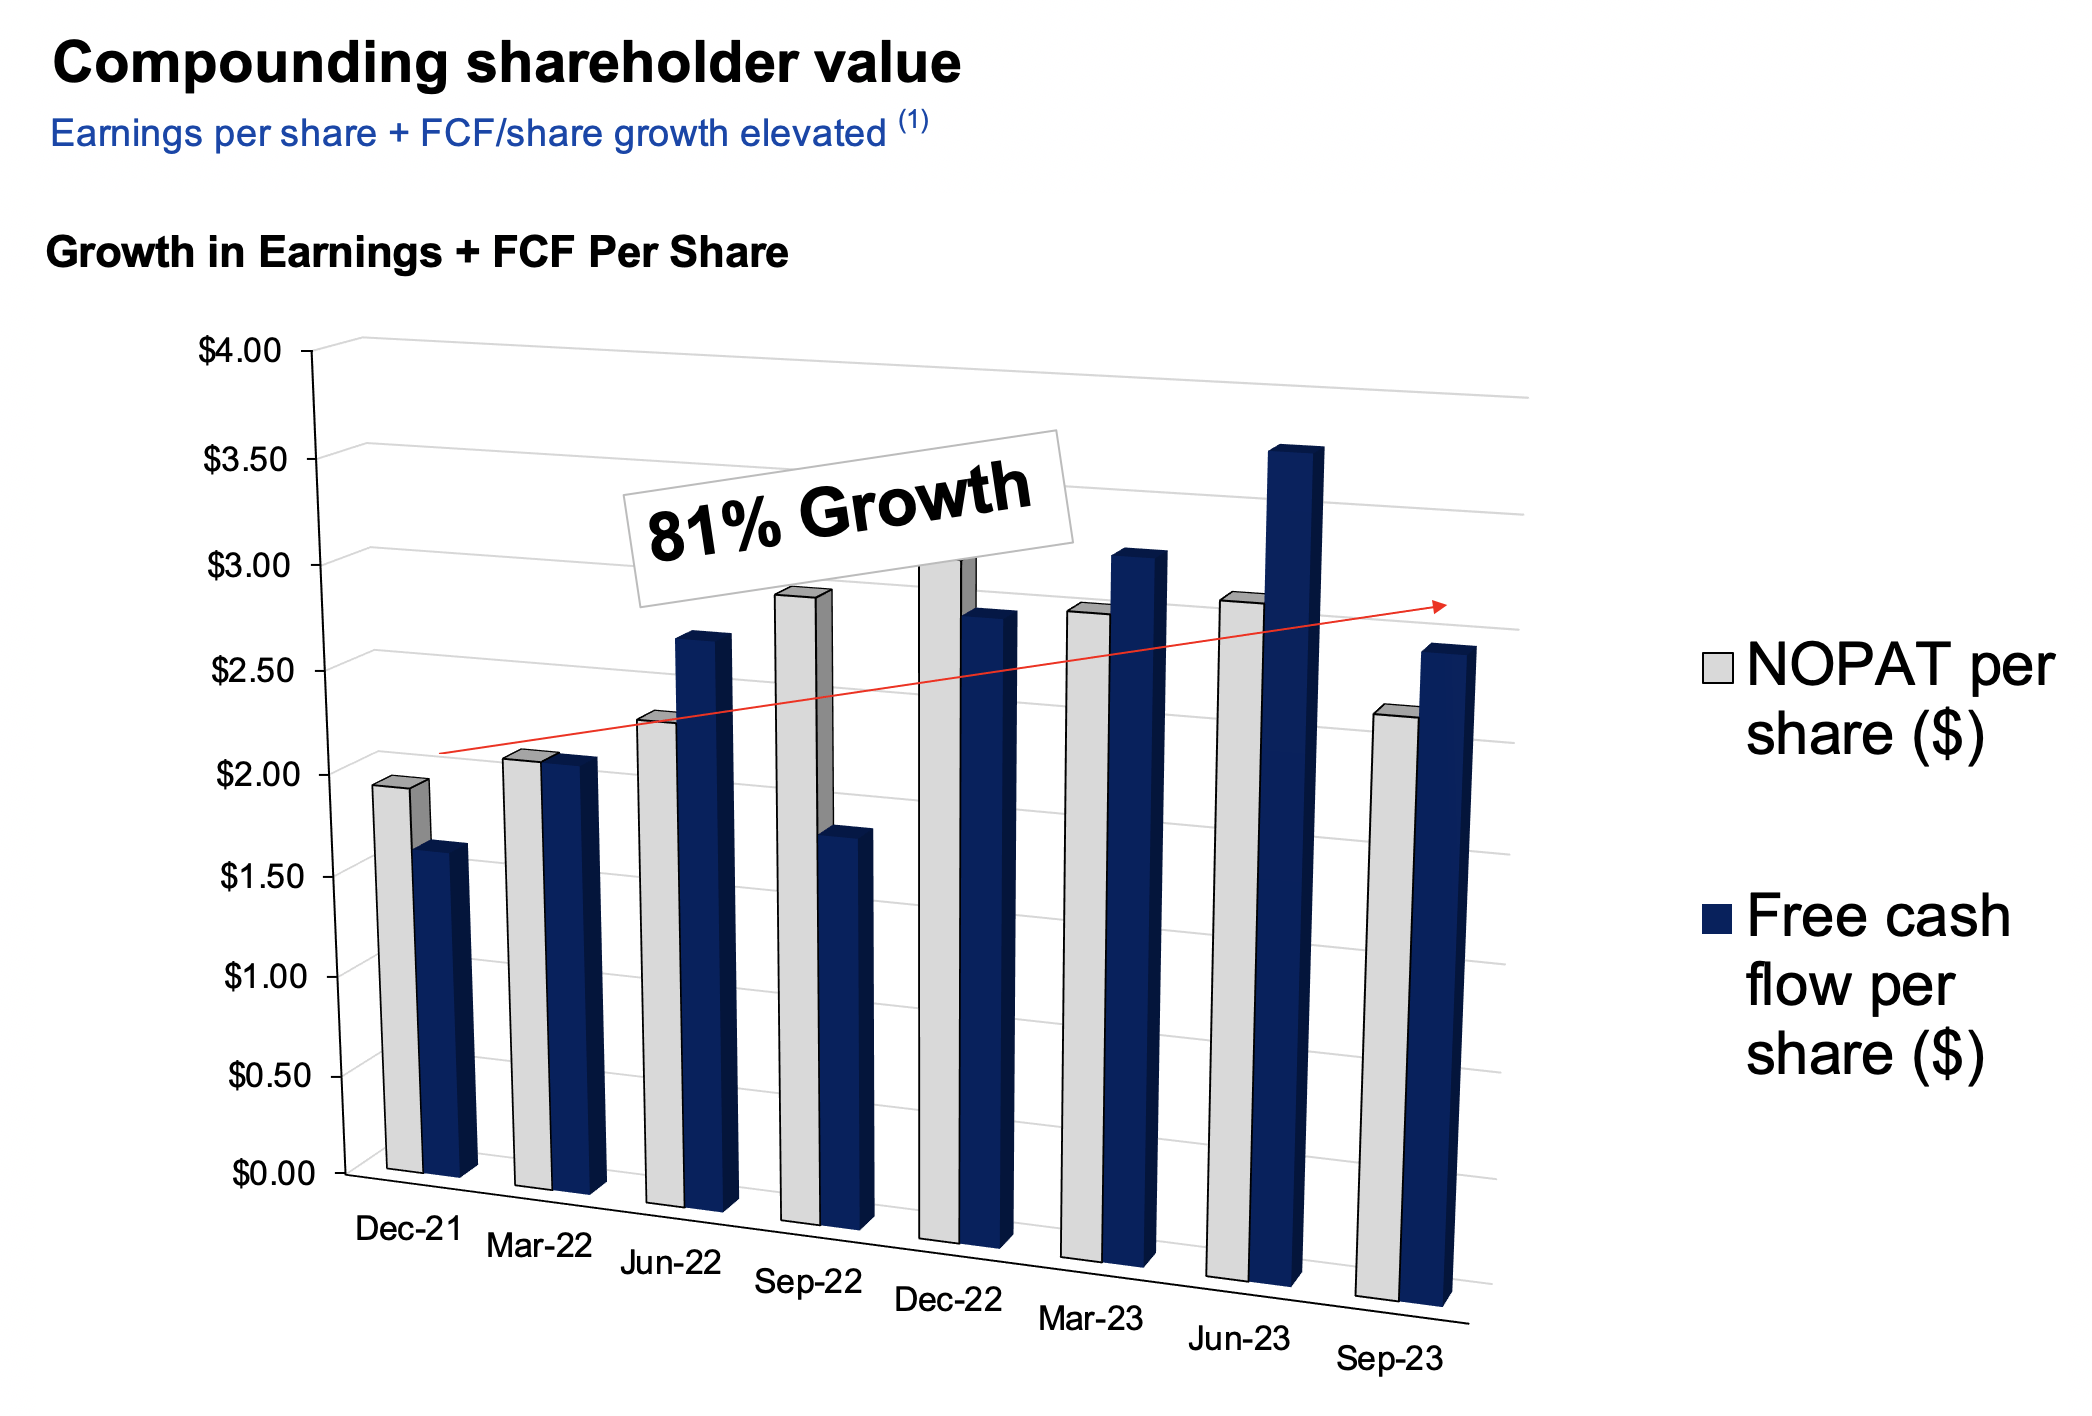
In some respects, CAPL is compounding shareholder wealth over time. Taking the approach that, the value of any asset as the cash it produces for its owners , CAPL shareholders have been fairly treated last few years. The company has grown its FCF per share 81% in total since December 2021 to $2.95/share. NOPAT per share has grown in synch, to show this wasn't just asset disposals. Dividends have remained flat.
Figure 2.
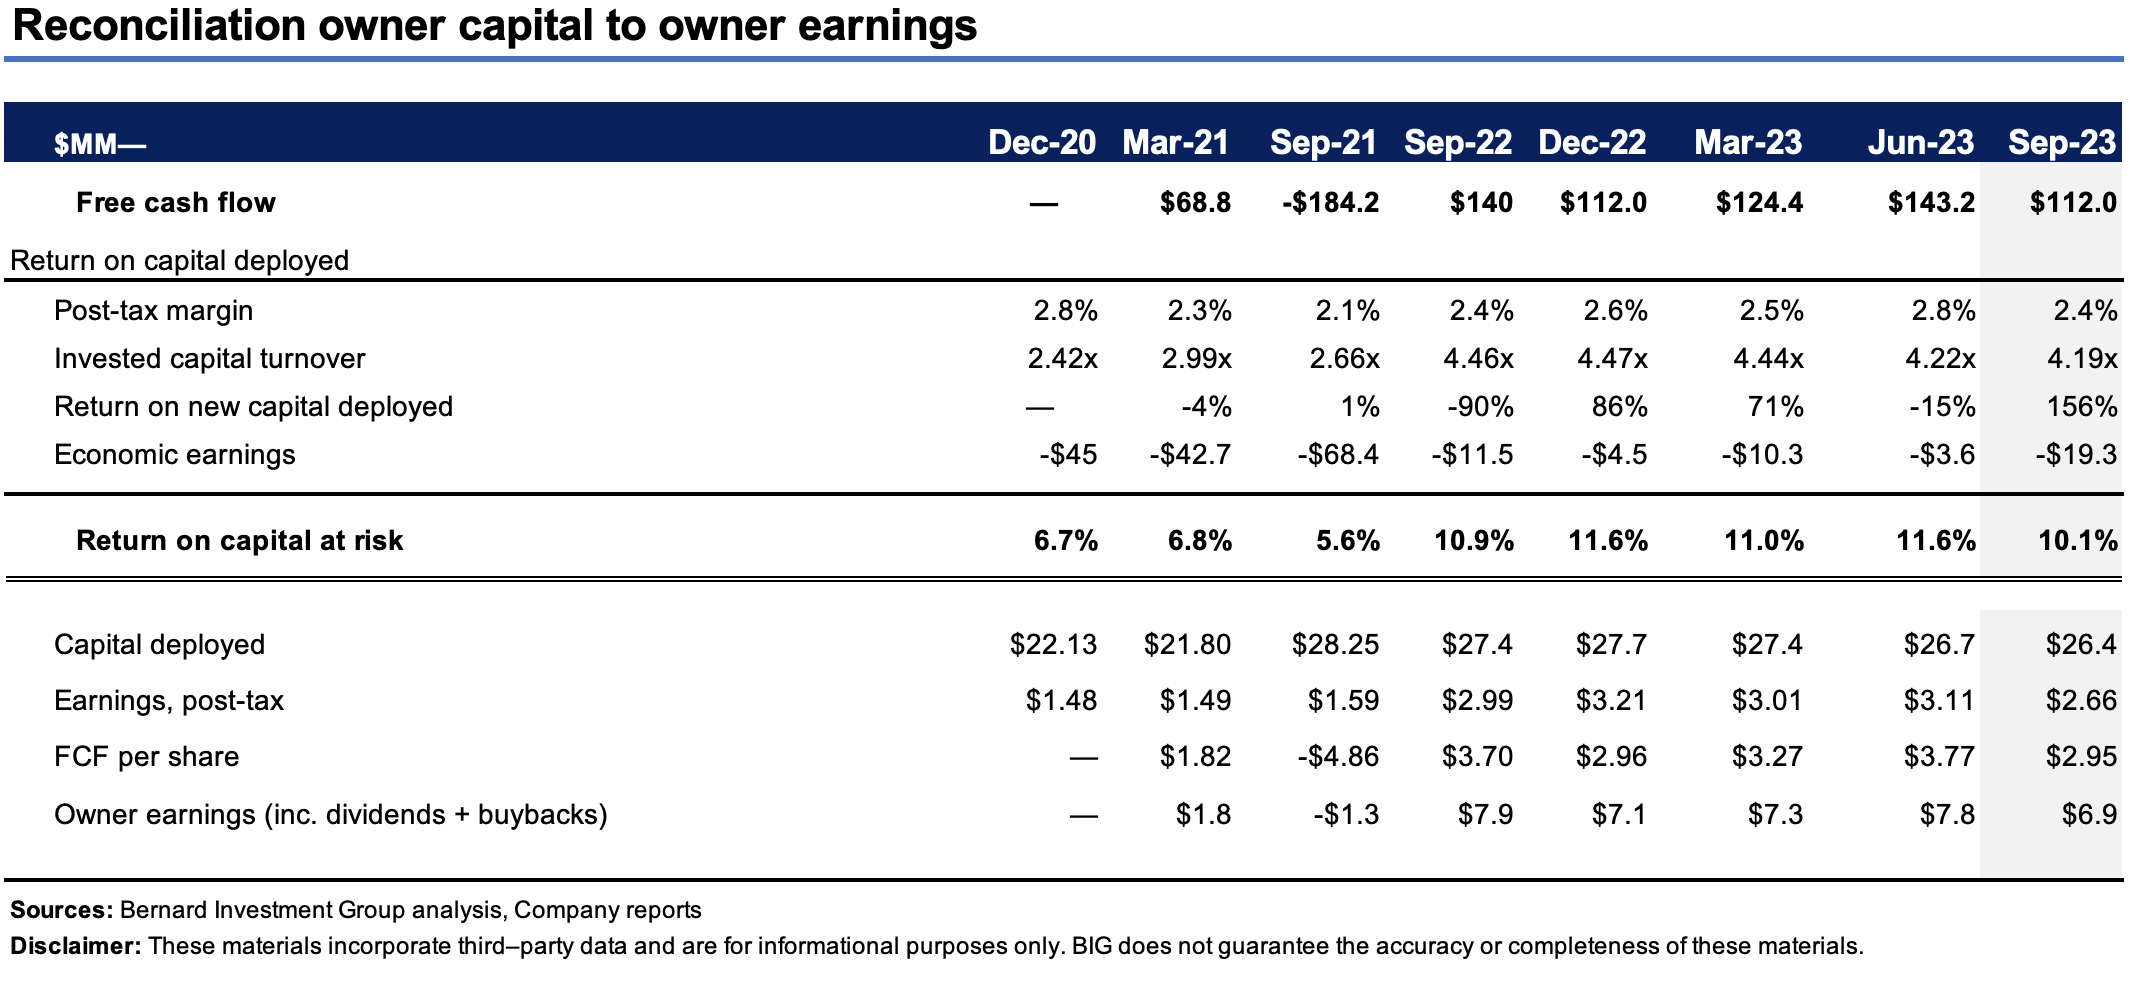
This is an efficient process for CAPL, too. Around $26/share of capital invested in the business produces 10% rate of return in earnings, a figure that has crept higher on aggregate since 2021. The critical facts are this:
- This is a low-margin, high capital turnover business; 2-3% post-tax coupled with 3-4x capital turns. This squares off with the economics. All product is out the door as quickly as possible, keeping the ratio of assets to sales low. CAPL obviously enjoys cost leadership advantages where it can sell offerings below industry averages, thus creating a competitive position.
- That is attractive arithmetic. Each $1 the company invests into operations can produce up to $4 in sales. For a 1–3 year investment horizon, this is the kind of scenario one wants to see.
- With all FCF per share and dividends paid up, investors have been treated to $7-$8/share each rolling TTM period since 2022. However–we can't ignore the fact there's been no capital growth , the critical takeout.
So 10-11% business returns, 4x capital turnover on single-digit margins—this is the economic profile of the firm. Inventory in and out for low margins but high turnover and cash conversion due to short working capital.
Figure 3.
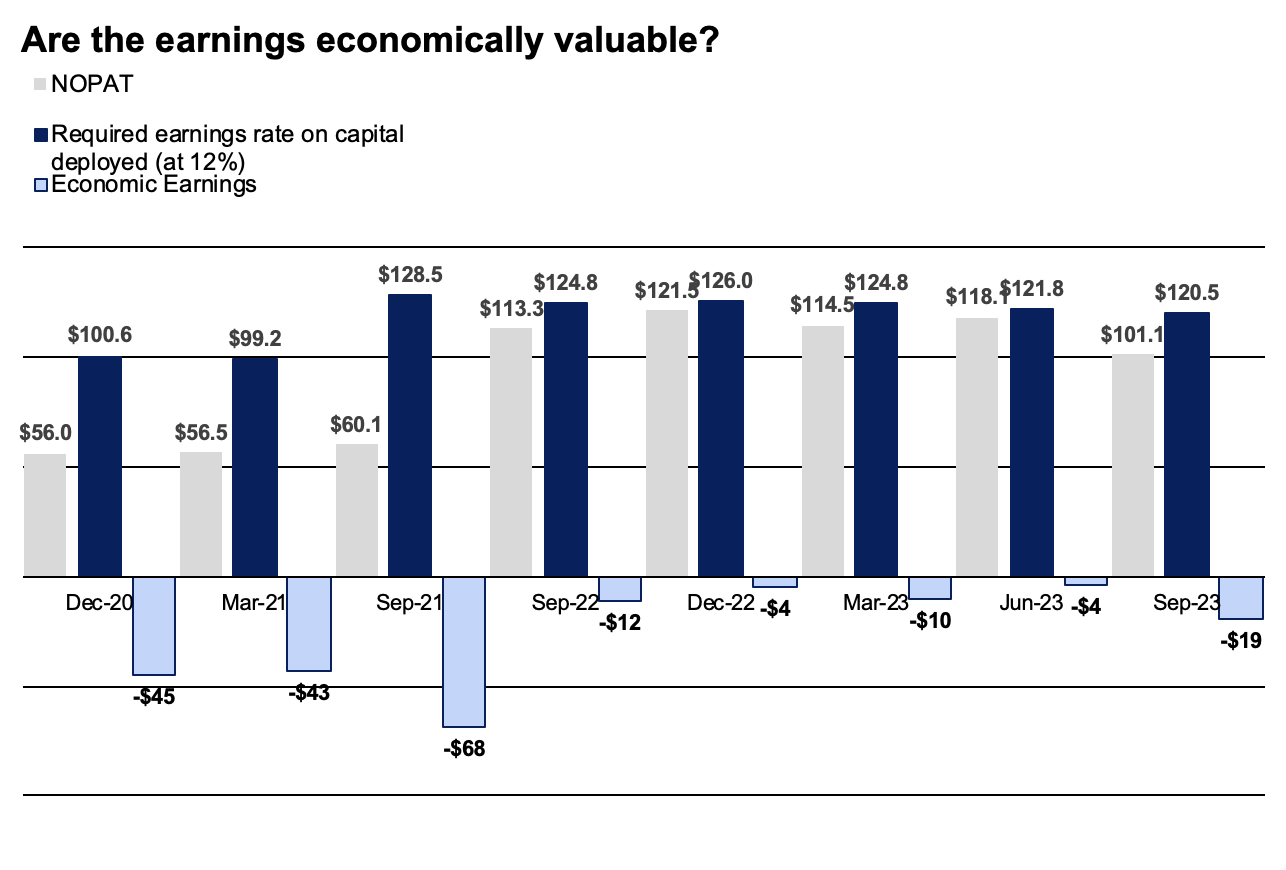
These figures—whilst remarkable—are little relevant without context. What permits these are sensible business returns?
What makes any return valuable to the investor is whether it beats the opportunity cost. Long-term market averages are 12%. One can therefore construct a single-instrument portfolio with a 12% expected return over most horizons.
Comparing CAPL's business returns to the market's threshold return on capital reveals why it has likely compressed sideways for around 12 months now. The rate on its invested capital (grey bars) has lagged the 12% hurdle rate (dark blue bars), so none of its earnings are economically valuable (sky blue bars).
Figure 4.
So we have a situation where a company is (i) compounding its FCF per share, but (ii) not above the required threshold rate (c.12%). It is not enough to simply 'grow' earnings or produce more free cash flow. How well you did that matters too, compared to the next best alternative.
Under this lens, the capital CAPL has tied up into the business (what you own as the equity investor) is not more valuable than what you can own simply riding the benchmark (assuming a normal distribution of future expected returns). That is, it is not producing earnings growth above the stock market's long-run averages (10-11% vs. 12%+). Will this continue moving forward? My estimate is yes. The company has done a good job matching the opportunity cost of capital, but not outpacing it, so there are challenges. If you benchmark CAPL against the SPY ( SPY ) the company actually has quite the job to do.
3. Additional factors of profitability
Despite the business returns just discussed (of which the stock returns will closely mirror over the long term), investors are well treated in owning the equity of the corporation—87% trailing ROE. Terrific return.
However, you need to gauge two very critical notions as it relates to the company's return[s] on equity. The company has done a terrific job at producing such appealing profit numbers. Things are slightly different for the investor.
(i). ROE high due to use of leverage
Here we extrapolate the drivers of the ROE through its core components. Note the following observations:
(1). Earnings aren't the driving force.
(2). Instead, the high ratio of sales to assets ($3.24 for every $1 assets employed), and
(3). Tremendously high multiple on equity from leverage (24.8x) are the driving forces. If we utilized 1x leverage, the company's ROE would be 3.5%.
That in itself is a difficult proposition to wrap around. On the one hand, the company should be applauded for its profitability. For the equity investor, however, economics are a weak point here.
Figure 5. CAPL ROE – DuPont breakdown
| Net profit margin |
| 1.02% |
| Asset turnover |
| 3.42 |
| Equity multiplier |
| 24.84 |
| Return on Equity |
| 86.6% |
| Return on Equity with 1x leverage |
| 3.50% |
Source: BIG Insights, Seeking Alpha
(ii). ROE changes with starting valuations
Investor and company returns on equity differ in principle. One, the company doesn't face the frictional cost an investor does. Two, investors have to buy their equity in the market at the market price. So you need to consider the following:
- CAPL's TTM ROE is 87% meaning it produced $43mm of net earnings on $49mm of equity value attributed to the business (Figure 6).
- That is the company's equity. You are being asked to pay 36x book value, i.e., $1.77Bn (49.3x36 = 1,775).
- The investor ROE is therefore 2.4% (43/1,775 = 2.4%).
Along with the points above, this illustrates why thoughtful analysis is required to fully grasp outliers in the data. The company's ROE is high at 87%, and ought to be commended. Does this extend to the investor? On closer analysis, perhaps not. This points on how we arrive at the same ROE 2 different ways and what starting valuations mean should not be overlooked.
Figure 6. CAPL ROE – Breakdown of starting valuations
| ( / %) |
| (1) |
| Net income |
| 43.0 |
| (2) |
| Book value |
| 49.3 |
| (3) |
| Company ROE (1/2) |
| 87% |
| (4) |
| Multiple |
| 36x |
| (5) |
| Investor Pays —(2 x 4). |
| $1,775 |
| (6) |
| Investor ROE (1/5) |
| 2.4% |
Source: BIG Insights, Seeking Alpha
Valuation and conclusion
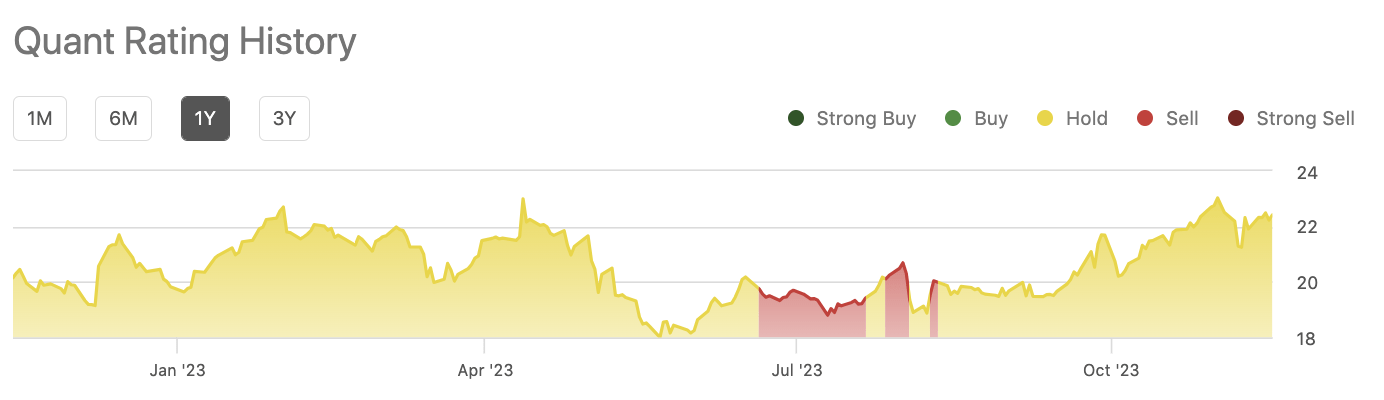
With the above points in consideration it begins to make sense why the quant system has CAPL rated a hold, with low grades on key factors such as valuation, growth, profitability. The company's fuel distribution business is a profitable franchise, with liquid assets that produce predictable, large cash flows. It fulfils all requisites as corporate citizen with regards to employment, taxation, economic growth, and so forth.
For the investor seeking to purchase ownership in CAPL's equity stock, further changes to the data must first happen.
(1). To buy an attractive ROE (14% for example), market values must contract so sharply to the $300mm range. Not worth the epic journey.
(2). Given the price dislocations, investors are selling CAPL at 36x book value—or $1.775Bn—reducing the investor ROE to 2.4%. A growth in earnings above the $650mm mark is needed to balance the scales.
At this point the valuations are not well supported in the investment findings. To pay 36x an equity value that produces 2.4% for the investor, after producing 87% for the company, is a difficult ask to get over the line. My judgement is the market has is captured at 11x forward EBITDA, but this has room to contract further.
Figure 7.
In short, CAPL is the kind of company that lends itself to investors seeking exposure to high quality businesses that will compound wealth over the very long term. The company presents with some reasonably attractive economic characteristics, that perhaps fall just short when compared to a high watermark. Valuations are also stretched, and run risk of repricing. My judgement is there are more compelling investment opportunities with similar risk out there at this point. Net net, rate hold.
For further details see:
CrossAmerica Partners: 9% Yield, >85% ROE Helped By Capital Structure