CMI - Cummins: 5 Factors Make This A Strong Buy
2023-09-06 08:58:19 ET
Summary
- The revenue and net income growth for Cummins is good. Free cash flow growth has lulled the last three years due to expenditures on Meritor Acquisition.
- Their balance sheet is healthy from a Net Debt/EBIDTA basis even with a recent spike of this metric, due to the same acquisition.
- They have an excellent share repurchase program and minimal stock-based compensation, providing more value for the investor.
- Cummins is well-priced through a corporate DCF using unlevered Free Cash Flow. WACC was calculated using CAPM and used as a discount factor.
- Their average ROIC is higher than WACC, indicating management is efficient allocating capital and the security exhibits value generation.
Preview
In this article, I evaluate the security by giving a "Pass" or "Fail" rating for five different attributes. Ratings are given by interpretation of relevant and measurable information. A security will be considered favorable if it receives a "Pass" for each of the following five attributes:
- Long-term growth in Revenue, Net Income, and Free Cash Flow.
- A Healthy Balance Sheet on a Net Debt/EBIDTA basis.
- Generally, Net Debt/EBIDTA < 3 is acceptable.
- Share Repurchases outweigh Stock-Based-Compensation.
- Share Repurchases should also be bought at a reasonable price.
- A Fairly Priced Stock Through a Corporate Discounted Cash Flow Analysis.
- Free Cash Flow to the Firm “FCFF” or Unlevered Free Cash Flows are used.
- The Weighted Average Cost of Capital “WACC” is used as a discount factor.
- WACC is Calculated using the Capital Asset Pricing Model “CAPM”.
- Average Return on Invested Capital “ROIC” is greater than WACC.
- ROIC > WACC indicates the firm generates value.
- ROIC < WACC indicates the firm destroys value.
Overview
Cummins Inc. ( CMI ) is a global power leader that designs, manufactures, distributes, and services diesel, natural gas, electric, and hybrid powertrains and powertrain-related components. Founded in 1919 as Cummins Engine Company, the company has since grown to become a major player in the global power industry. Cummins products are used in a wide variety of applications, including trucks, buses, construction equipment, agricultural machinery, and marine vessels.
1. Growth
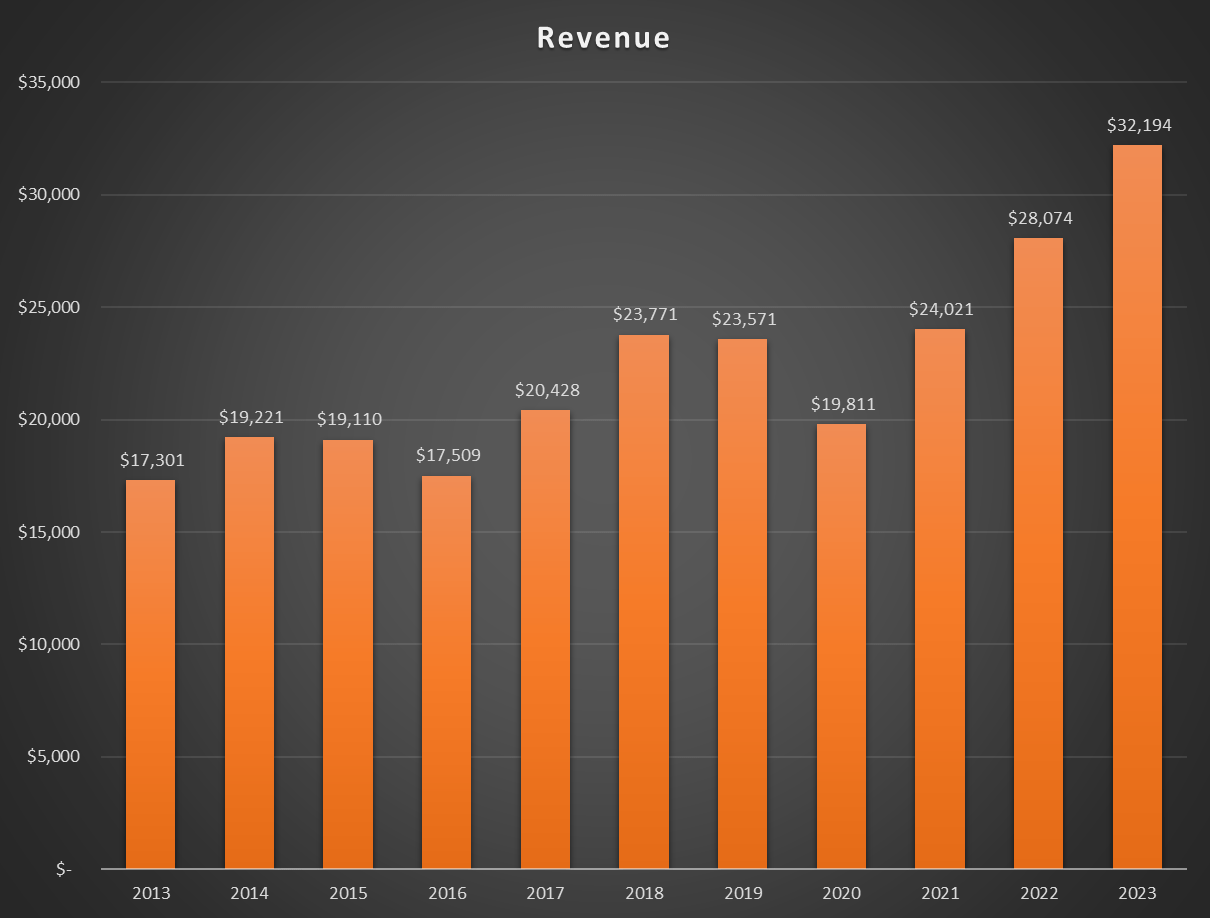
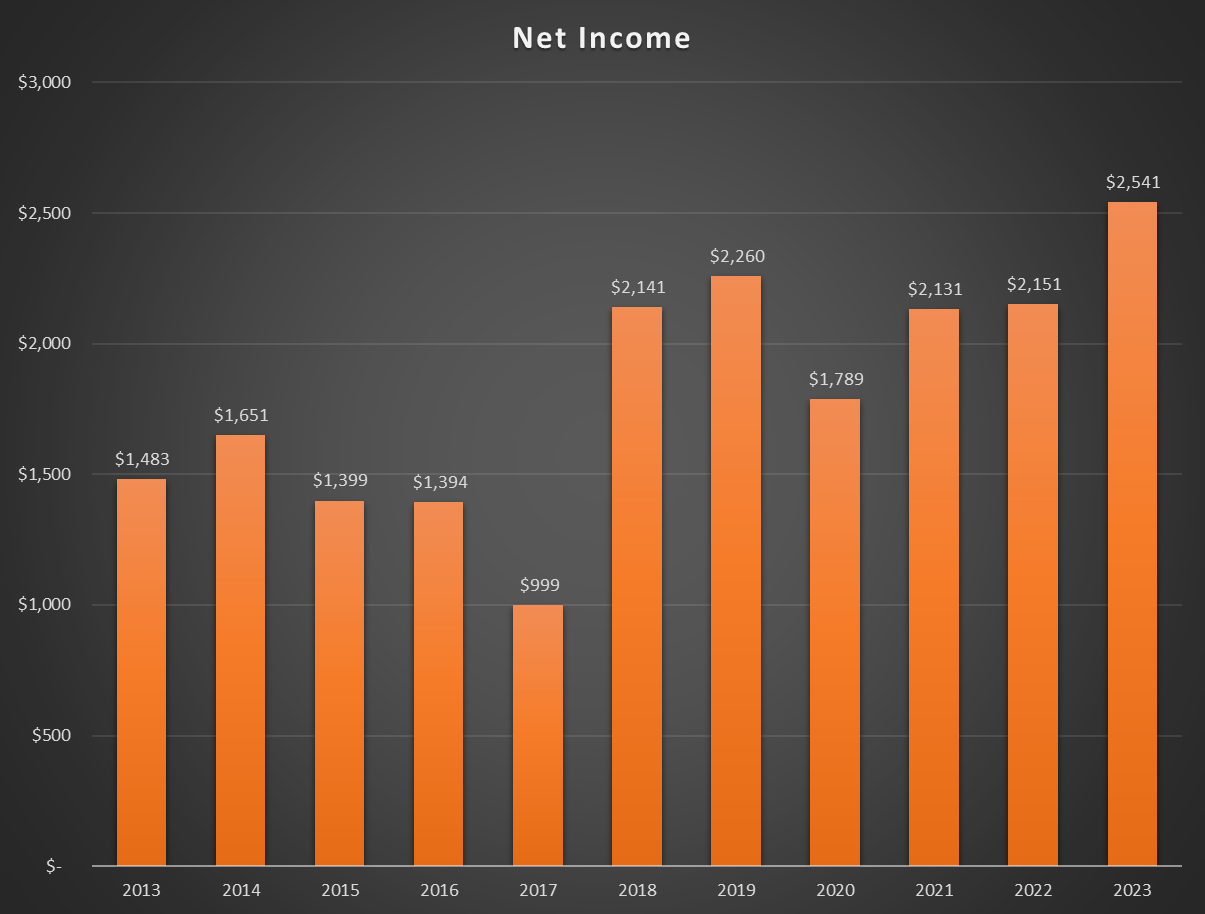
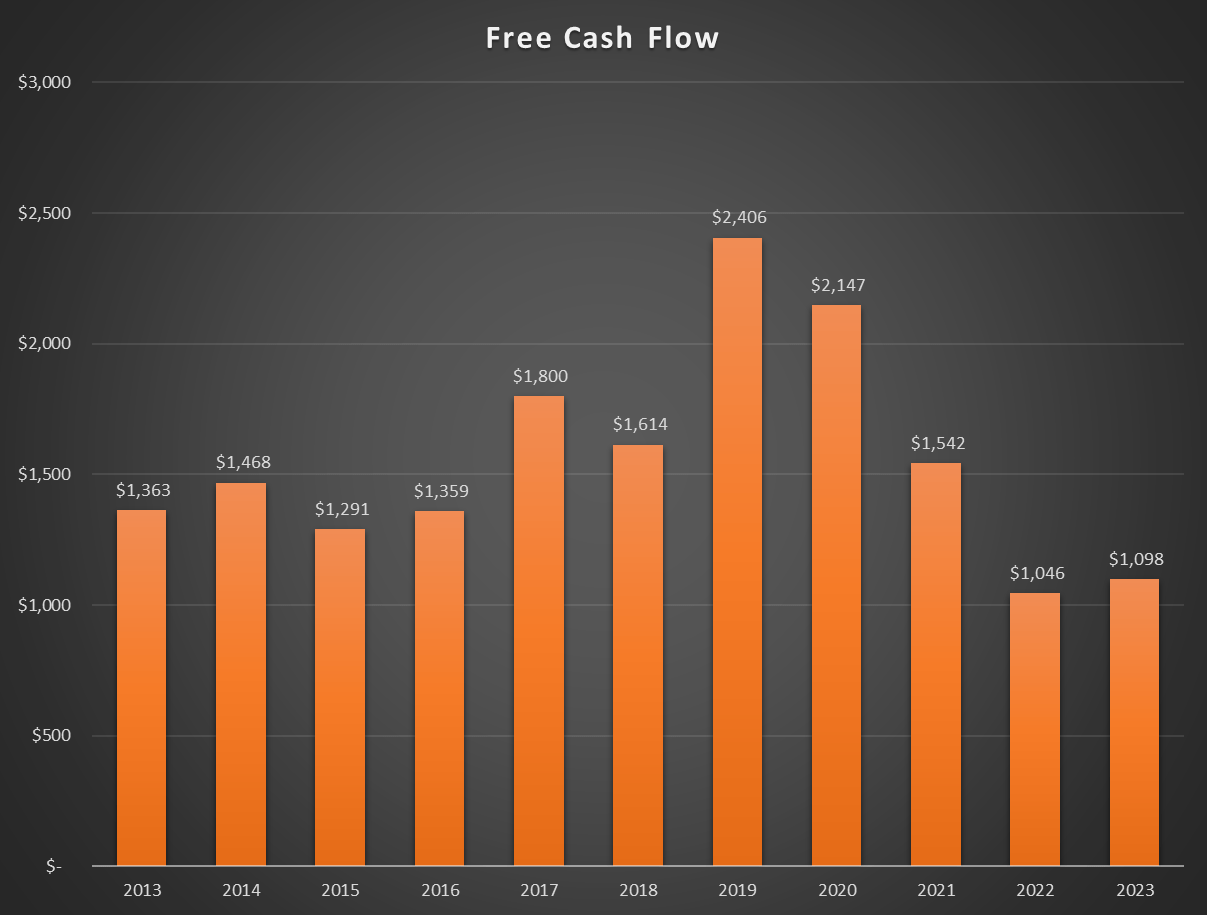
For Growth, I want to see a long-term increase in Revenue, Net Income, and Free Cash Flow. The Revenue and Net Income charts look good, but the Free Cash Flow is less to be desired. Free Cash Flow dropped in recent years because of large capital expenditures and swings in net working capital due to the Meritor Acquisition, not to mention other macroeconomic headwinds and the cyclical nature of the company. I expect Free Cash Flow to rise after things settle. Overall, I see long-term growth prospects and for that reason, I will give this category a "Pass".
Revenue CMI (Author) Net Income CMI (Author) Free Cash Flow CMI (Author)
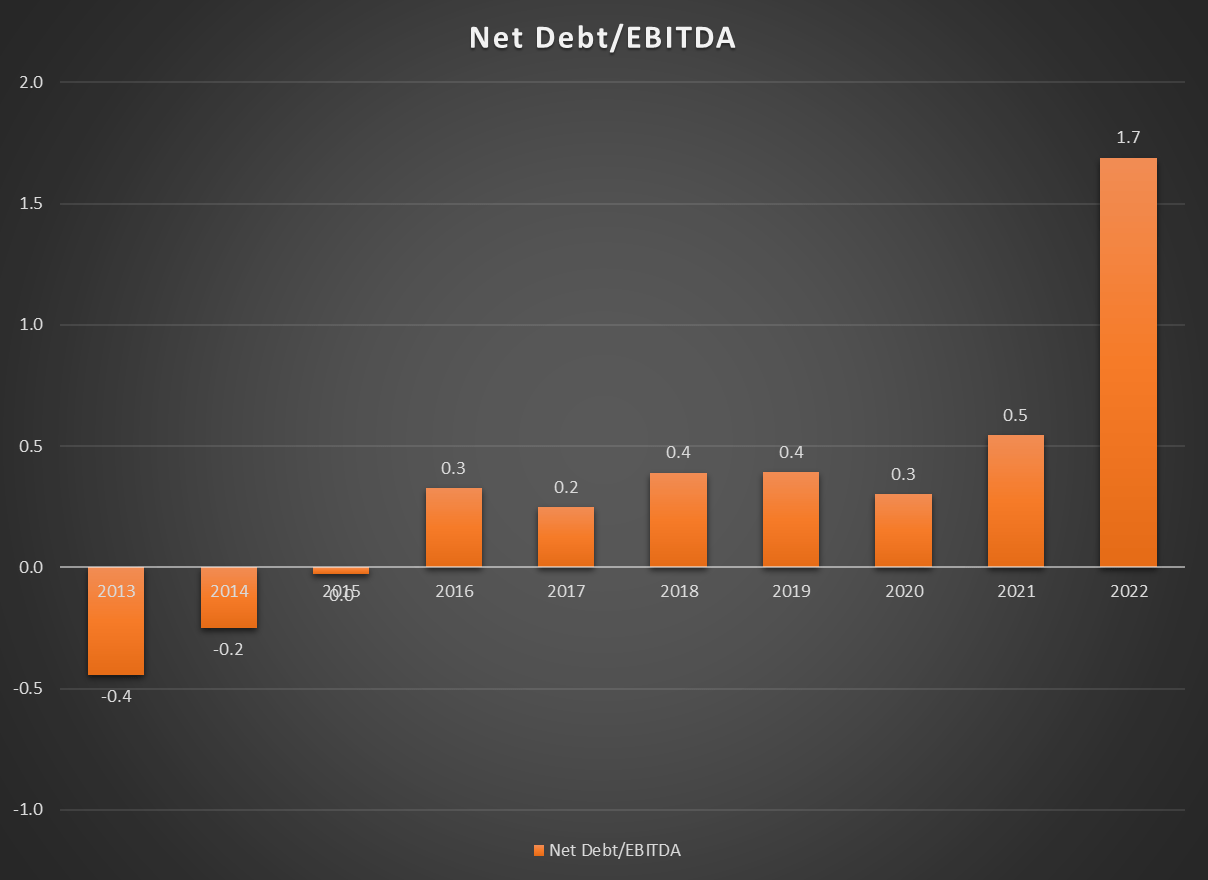
2. Balance Sheet
I typically like to see a Net Debt/EBIDTA ratio of less than 3. Beyond this point, we see companies start to struggle with interest rates chewing up profits and lenders tend to categorize them as risky. CMI doesn't have this issue, even after the massive increase in 2022. It should be noted this increase was due to short term borrowings due to the Meritor Acquisition again and is not reflective of the business operations. I expect this ratio to go back to their historical norm. That being said, I will give a "Pass" on the Balance Sheet Category.
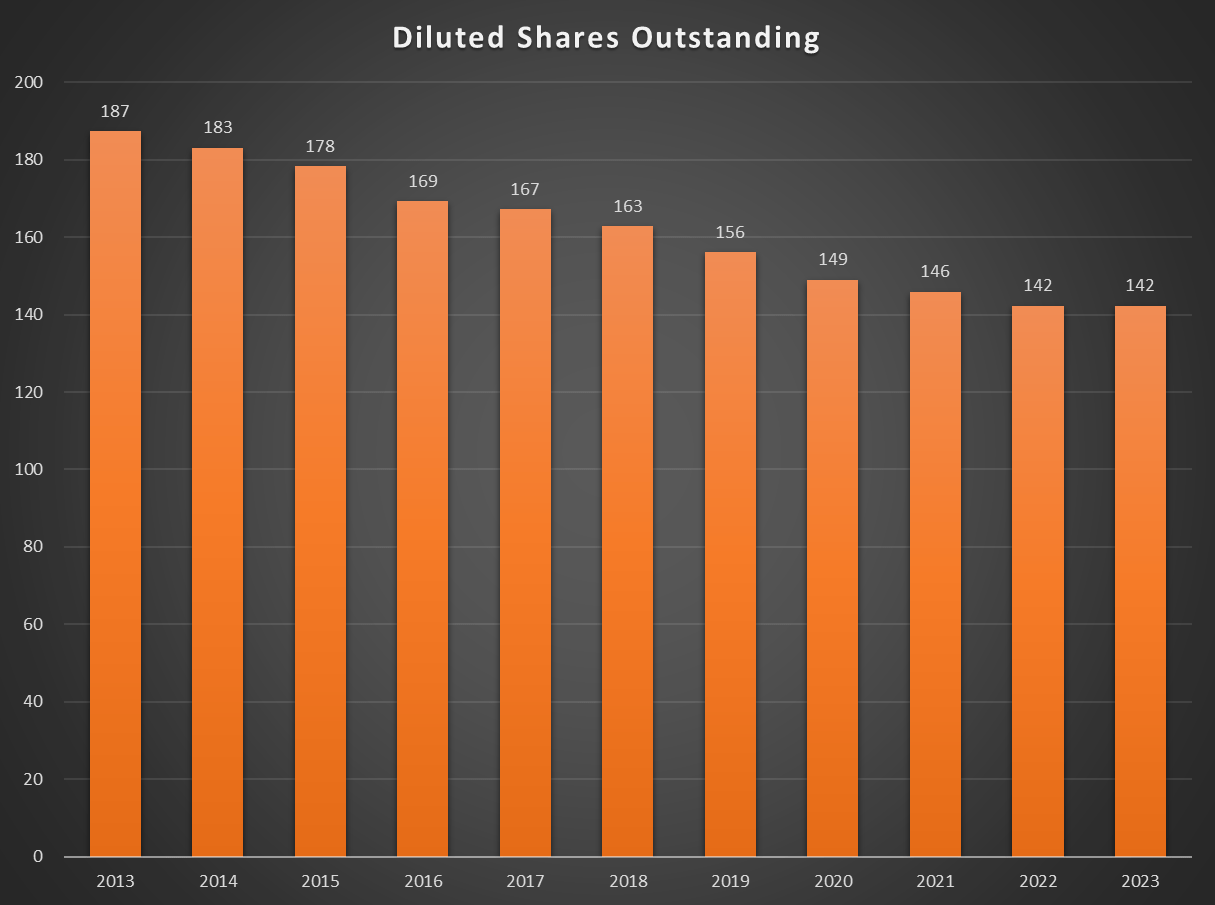
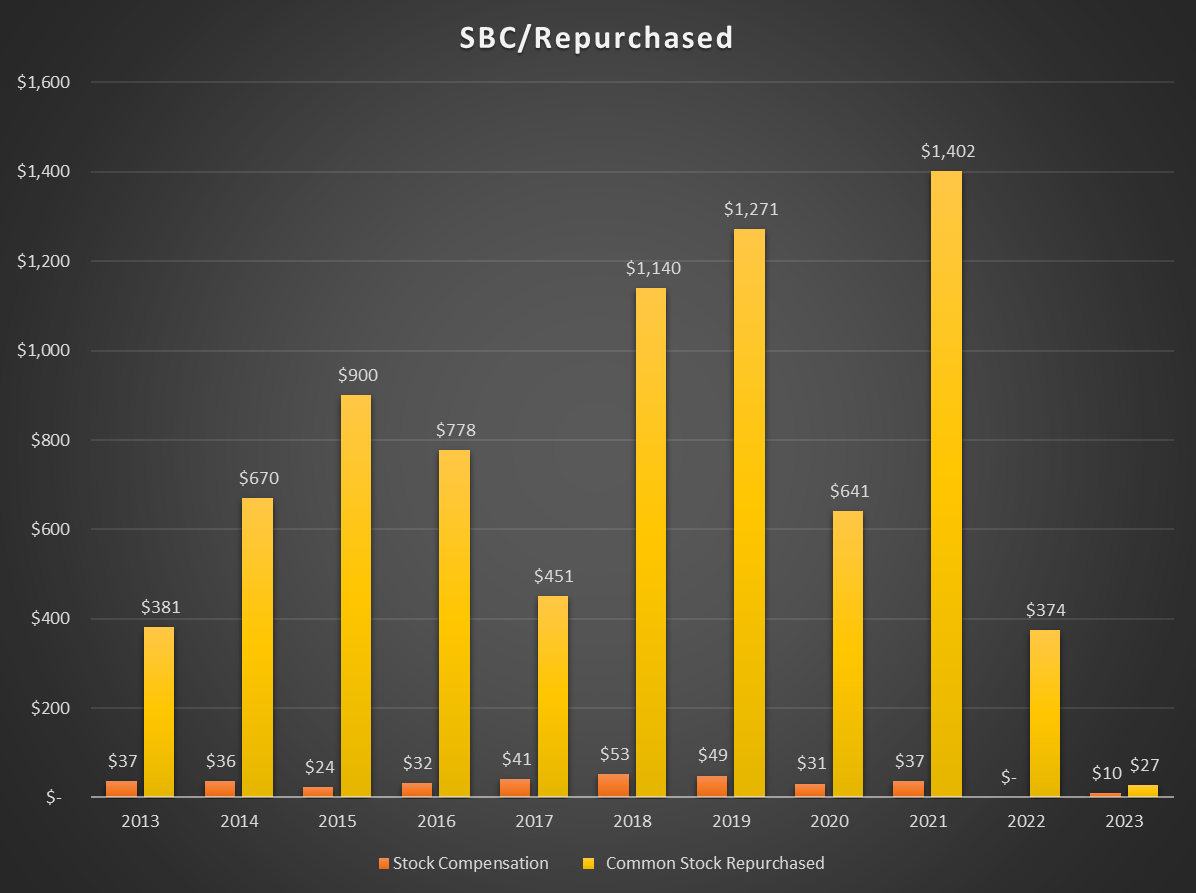
3. Stock Based Compensation and Share Repurchases
These charts are beautiful. CMI has done a fantastic job repurchasing shares over the years. Furthermore, the capital allocated to stock-based-compensation is miniscule compared to that allocated to repurchases. It is clear CMI is serious about maintaining shareholder value, and because of that, I will give them a healthy "Pass" in this category.
Share Dilution (Author) SBC CMI (Author)
4. Valuation
The valuation segment will consist of a passages dedicated to risk and discount factor, the discounted cash flow model, and a valuation discussion.
Risk and Discount Factor
For my Discounted Cash Flow Analysis ("DCF"), I am using Free Cash Flows to The Firm ("FCFF"), also known as Unlevered Free Cash Flow. If Unlevered Free Cash Flows are being used, the firm’s Weighted Average Cost of Capital ("WACC") should be used as the discount rate. This is because one must take into account the entire capital structure of the company to include the share of all investors. A portion of the WACC will be found by using the Capital Asset Pricing Model ("CAPM"). The assumptions are shown here:
WACC CMI (Author)
This riskiness of CMI is measured by a Beta of (1.05). Essentially, CMI carries the same risk as the broader market from a price movement standpoint. Beta does not necessarily measure volatility, but it measures sensitivity to the rest of the market. Beta of greater than 1 means the stock is more sensitive to the market, and eludes a higher risk, which means investors require a higher return. Beta of less than 1 means the stock is less sensitive to the market, and eludes a lower risk, which means investors require a lower return.
The Risk-Free-Rate used was the current 10-year Treasury Bond Rate of 4.17%. This would be a guaranteed return an investor could gain risk free, so it only makes sense an investor should gain a higher return for more risk.
The Market Risk Premium is simply the Expected Return of a broad index minus the Risk-Free-Rate. This would be the premium an investor would need to invest in a CMI versus a simple broad index or ETF. This value was found on Damodaran Online.
Using the Capital Asset Pricing Model ("CAPM") , we arrive at an Expected Return of the Security of 8.79% After factoring in debt obligations, we arrive at a WACC of 8.04%. This will be used as the base case discount factor moving forward.
Discounted Cash Flow Model
The DCF models a Base Case Scenario, a Bull Case, and a Bear Case. Assumptions are shown in the tan boxes.
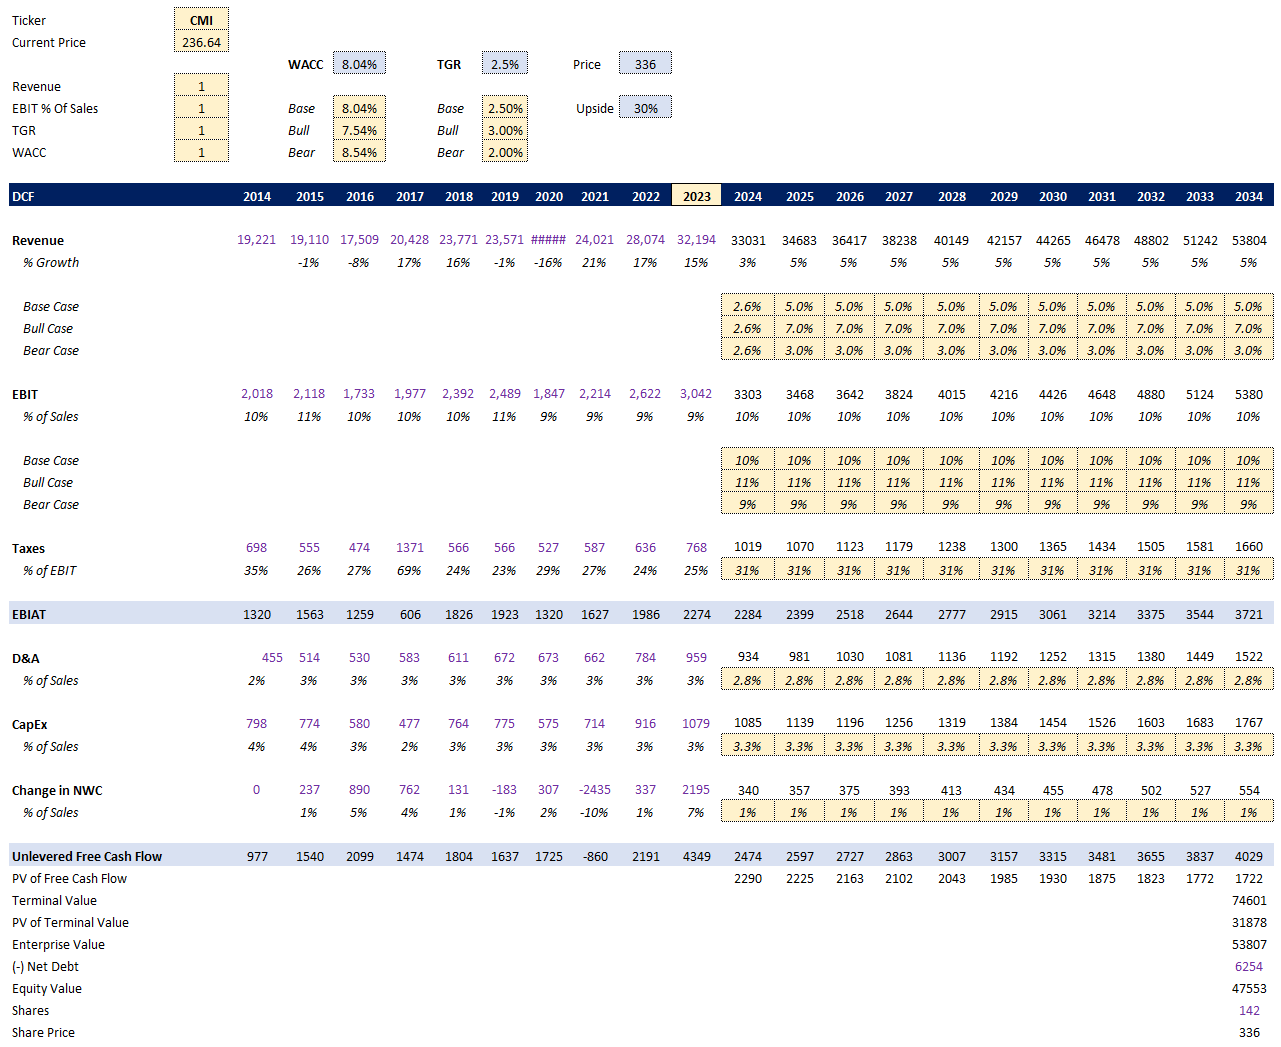
From top down, assumptions for each category are explained:
- WACC - Base Case was previously calculated. Bull and Bear are deviations of the Base Case. This should account for any noise in the WACC calculations.
- Terminal Growth Rate ("TGR") - This is the rate we believe the security will grow indefinitely. Generally, a solid Base Case assumption is 2.5% to represent long term market inflation. I have deviations from this for the Bull and Bear Case respectively.
- Revenue Growth - For all cases, I input analyst estimates for 2024 and 2025. For the reminder years, I input reasonable assumptions based on historical averages.
- Earnings Before Taxes ("EBIT") - Each case follows a different range of average historical margins.
- Taxes - Average of historical rates.
- Depreciation and Amortization - Average of historical rates.
- Capital Expenditures - Average of historical rates.
- Change in Net working Capital - Average of historical rates.
Discussion
By modifying my switches for each assumption, I arrive at the following price distribution:
Base Case - Fair Value of $336, for (30%) upside.
Bull Case - Fair Value of $530 for (55%) upside.
Bear Case - Fair Value of $216 for (-9%) upside.
Overall, I would weight CMI as undervalued with plenty of upside. There is evidence that investing in CMI is better than investing in a broad index or ETF from a risk-reward standpoint given the current price, fundamentals, and environment. For this reason, I will give "Pass" in this category.
Return on Capital
One good way to evaluate management's decisions is by looking at Return on Invested Capital ("ROIC"). CMI boasts an average ROIC of 15%. The reason I look at this metric last is because one crucial step is comparing this number to the WACC. If WACC is the internal cost of capital, then the ROIC better be higher, to ensure the company is generating value and not destroying it. Since we have already calculated WACC to be around 8%, it's very clear that an average ROIC of 15% means CMI is a value generator, not a destroyer. Because of this, a "Pass" will be given in this category.
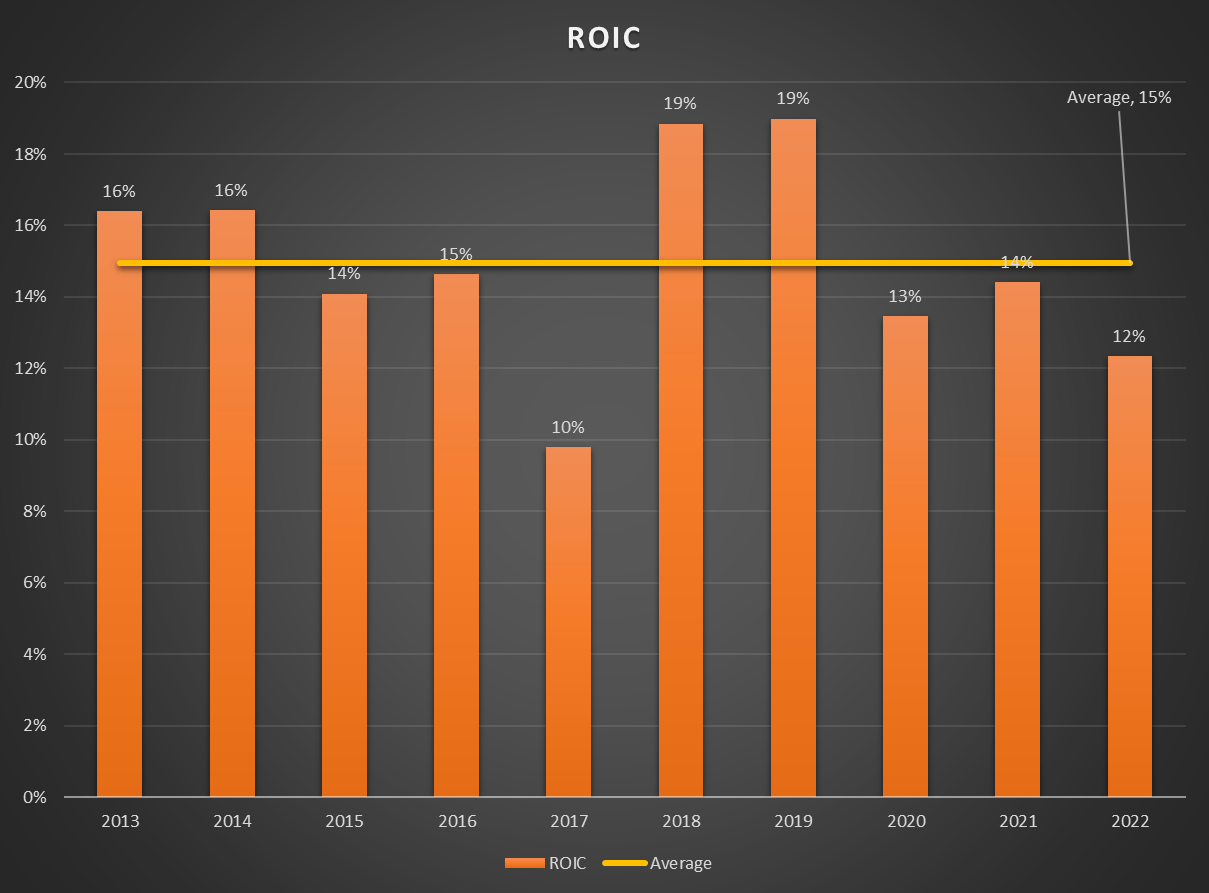
Review
Overall, I think CMI is extremely attractive. It offers growth, a healthy balance sheet, and excellent capital allocation. It is also well-priced. I think a couple things that would dissuade investors is the cyclical nature of the industry and relative flat free cash flow in recent years. Our ultimate bear case scenario actually depicts (-9%) upside, which may not sit well. However, I think this is a great company and it offers plenty of upside from a risk-reward standpoint. I think a reasonable position size would make a great addition to any value-focused portfolio. For this reason, I will give CMI a "Strong Buy".
For further details see:
Cummins: 5 Factors Make This A Strong Buy