ISCB - Curveballs
2023-03-11 02:24:27 ET
Summary
- The Fed “pivot” which is “higher for longer” and the implications.
- We believe that the Fed is well aware of the need for a continued hiking process and therefore staying “higher for longer”.
- Volatility most likely to return.
"You never hit a good slider or curveball; you just try to go after the mistakes." - Aaron Judge
Watching with interest the Fed "pivot" confirmation from Jerome Powell in effect validating the "higher for longer" narrative, when it came to selecting our title analogy we decided to go for a baseball analogy namely "Curveballs" given the expression "to throw a curveball" essentially translates to introducing a significant deviation to a preceding concept (such as "pivot"). As well, a curveball is thrown with a deliberate attempt to deceive such as our previous Cheshire cat analogy we used in terms of "misdirection" but we ramble again. At least there is some "continuity" for the time being in our thought process.
In this conversation, we would like to discuss the Fed "pivot" which is "higher for longer" and the implications given it seems to us that it doesn't seem to be "fully priced" by financial markets and the most recent gyrations in US banks share prices. As well, given the ongoing rising bond volatility and the US Dollar and "convexity pain" returning we will discuss what it portends for asset classes in this conversation.
Curveballs
The latest indicators from the Fed show that this "Cheshire cat" has managed since November to "misdirect" investors towards a "pivot", easing that is. But, given the case we made for entrenched inflation discussed recently, we believe that the Fed is well aware of the need for a continued hiking process and therefore staying "higher for longer". As such the Fed did indeed throw a curveball to investors in recent months.
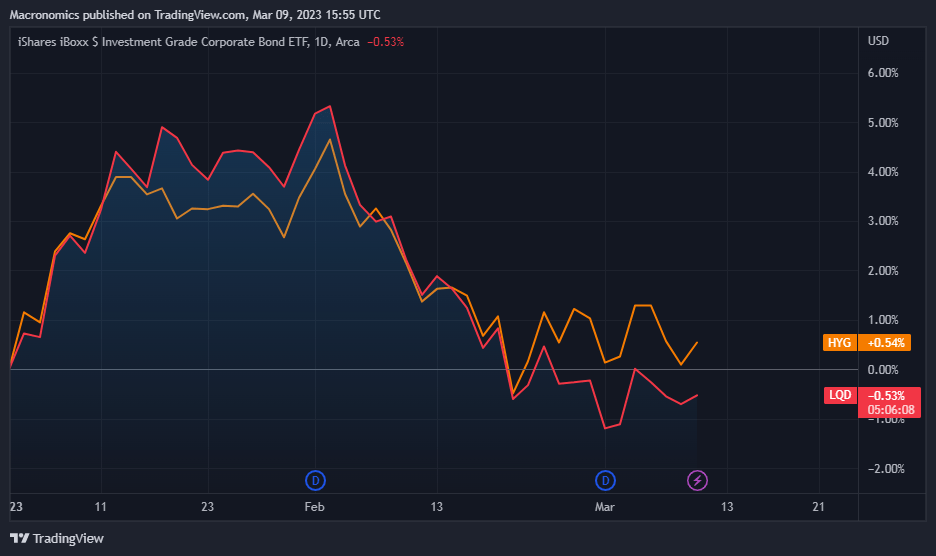
No wonder "convexity" has started to "bite" again inflicting pain in US Investment Grade sector relative to US High yield as per the below YTD chart displaying ETF LQD (Investment Grade) versus ETF HYG (US High Yield):
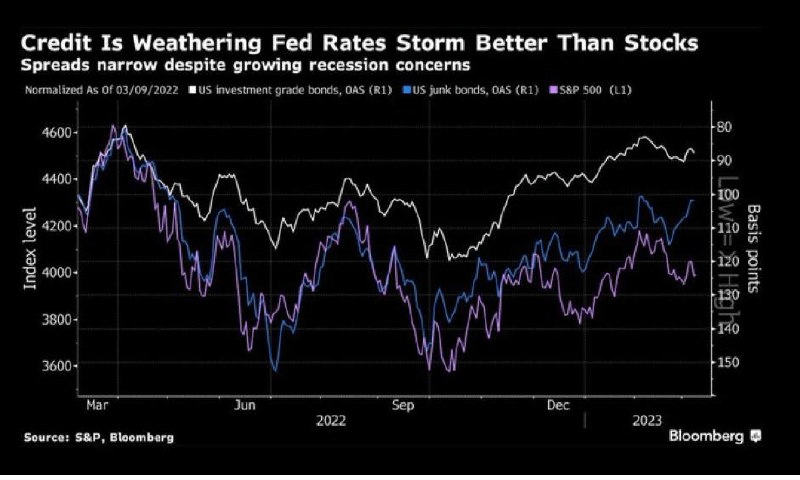
So far credit markets have been "well behaving" in the current "risk-on" environment overall:
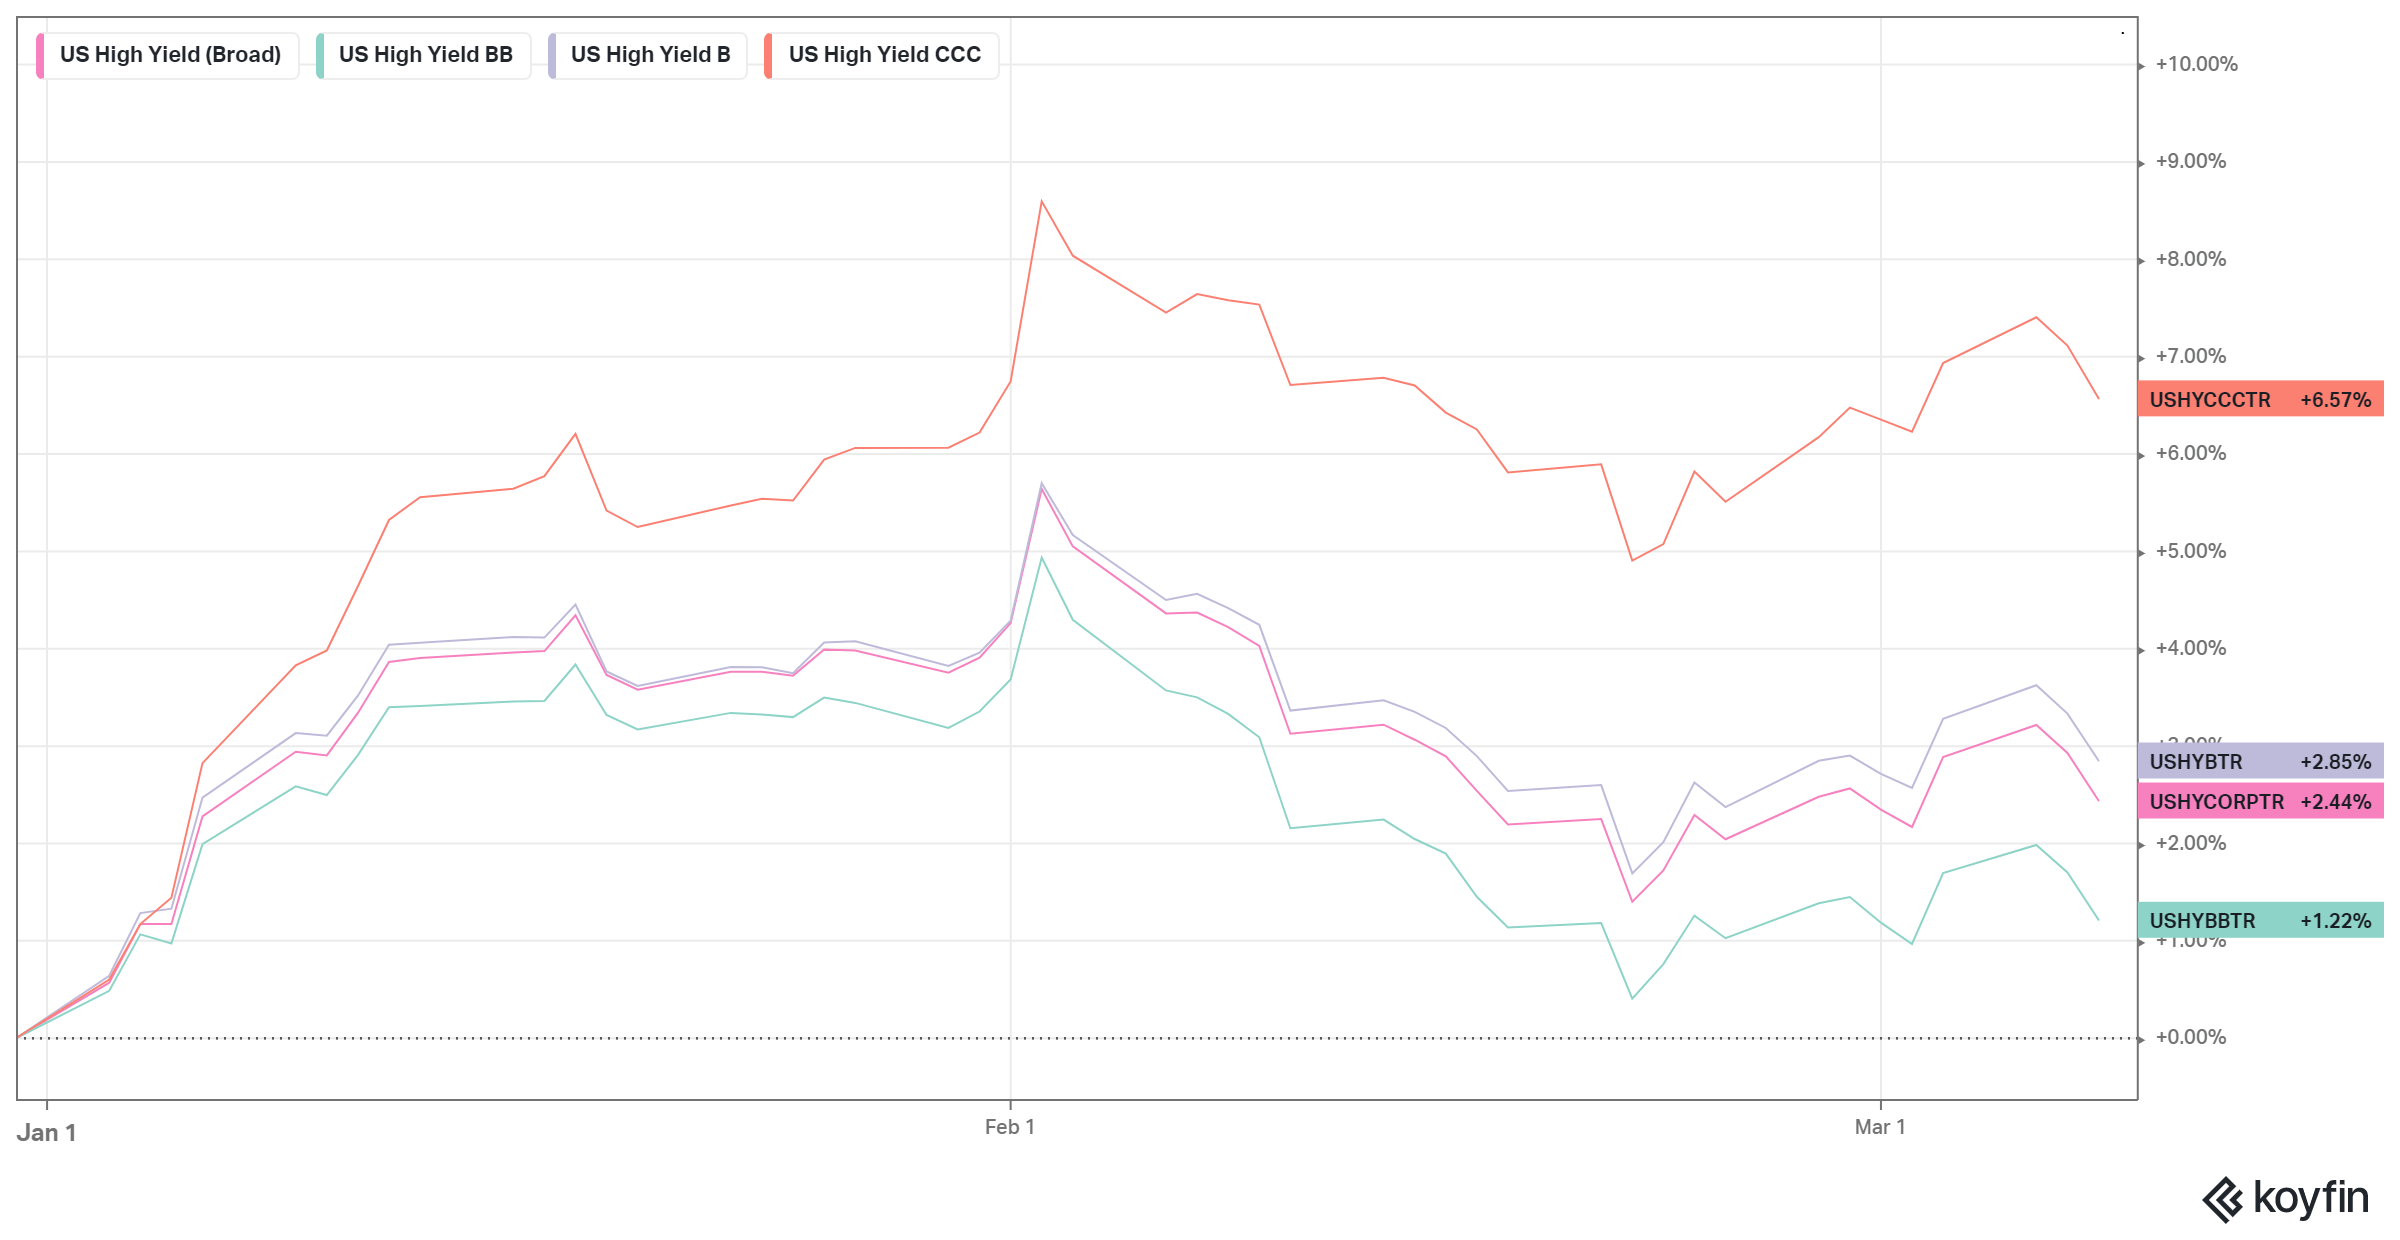
Most interesting has been the performance in US High Yield of High Beta and in particular CCCs ratings bucket YTD Total Return wise with US CCCs giving you an effective Yield of 14.44% versus 8.67% for single Bs:
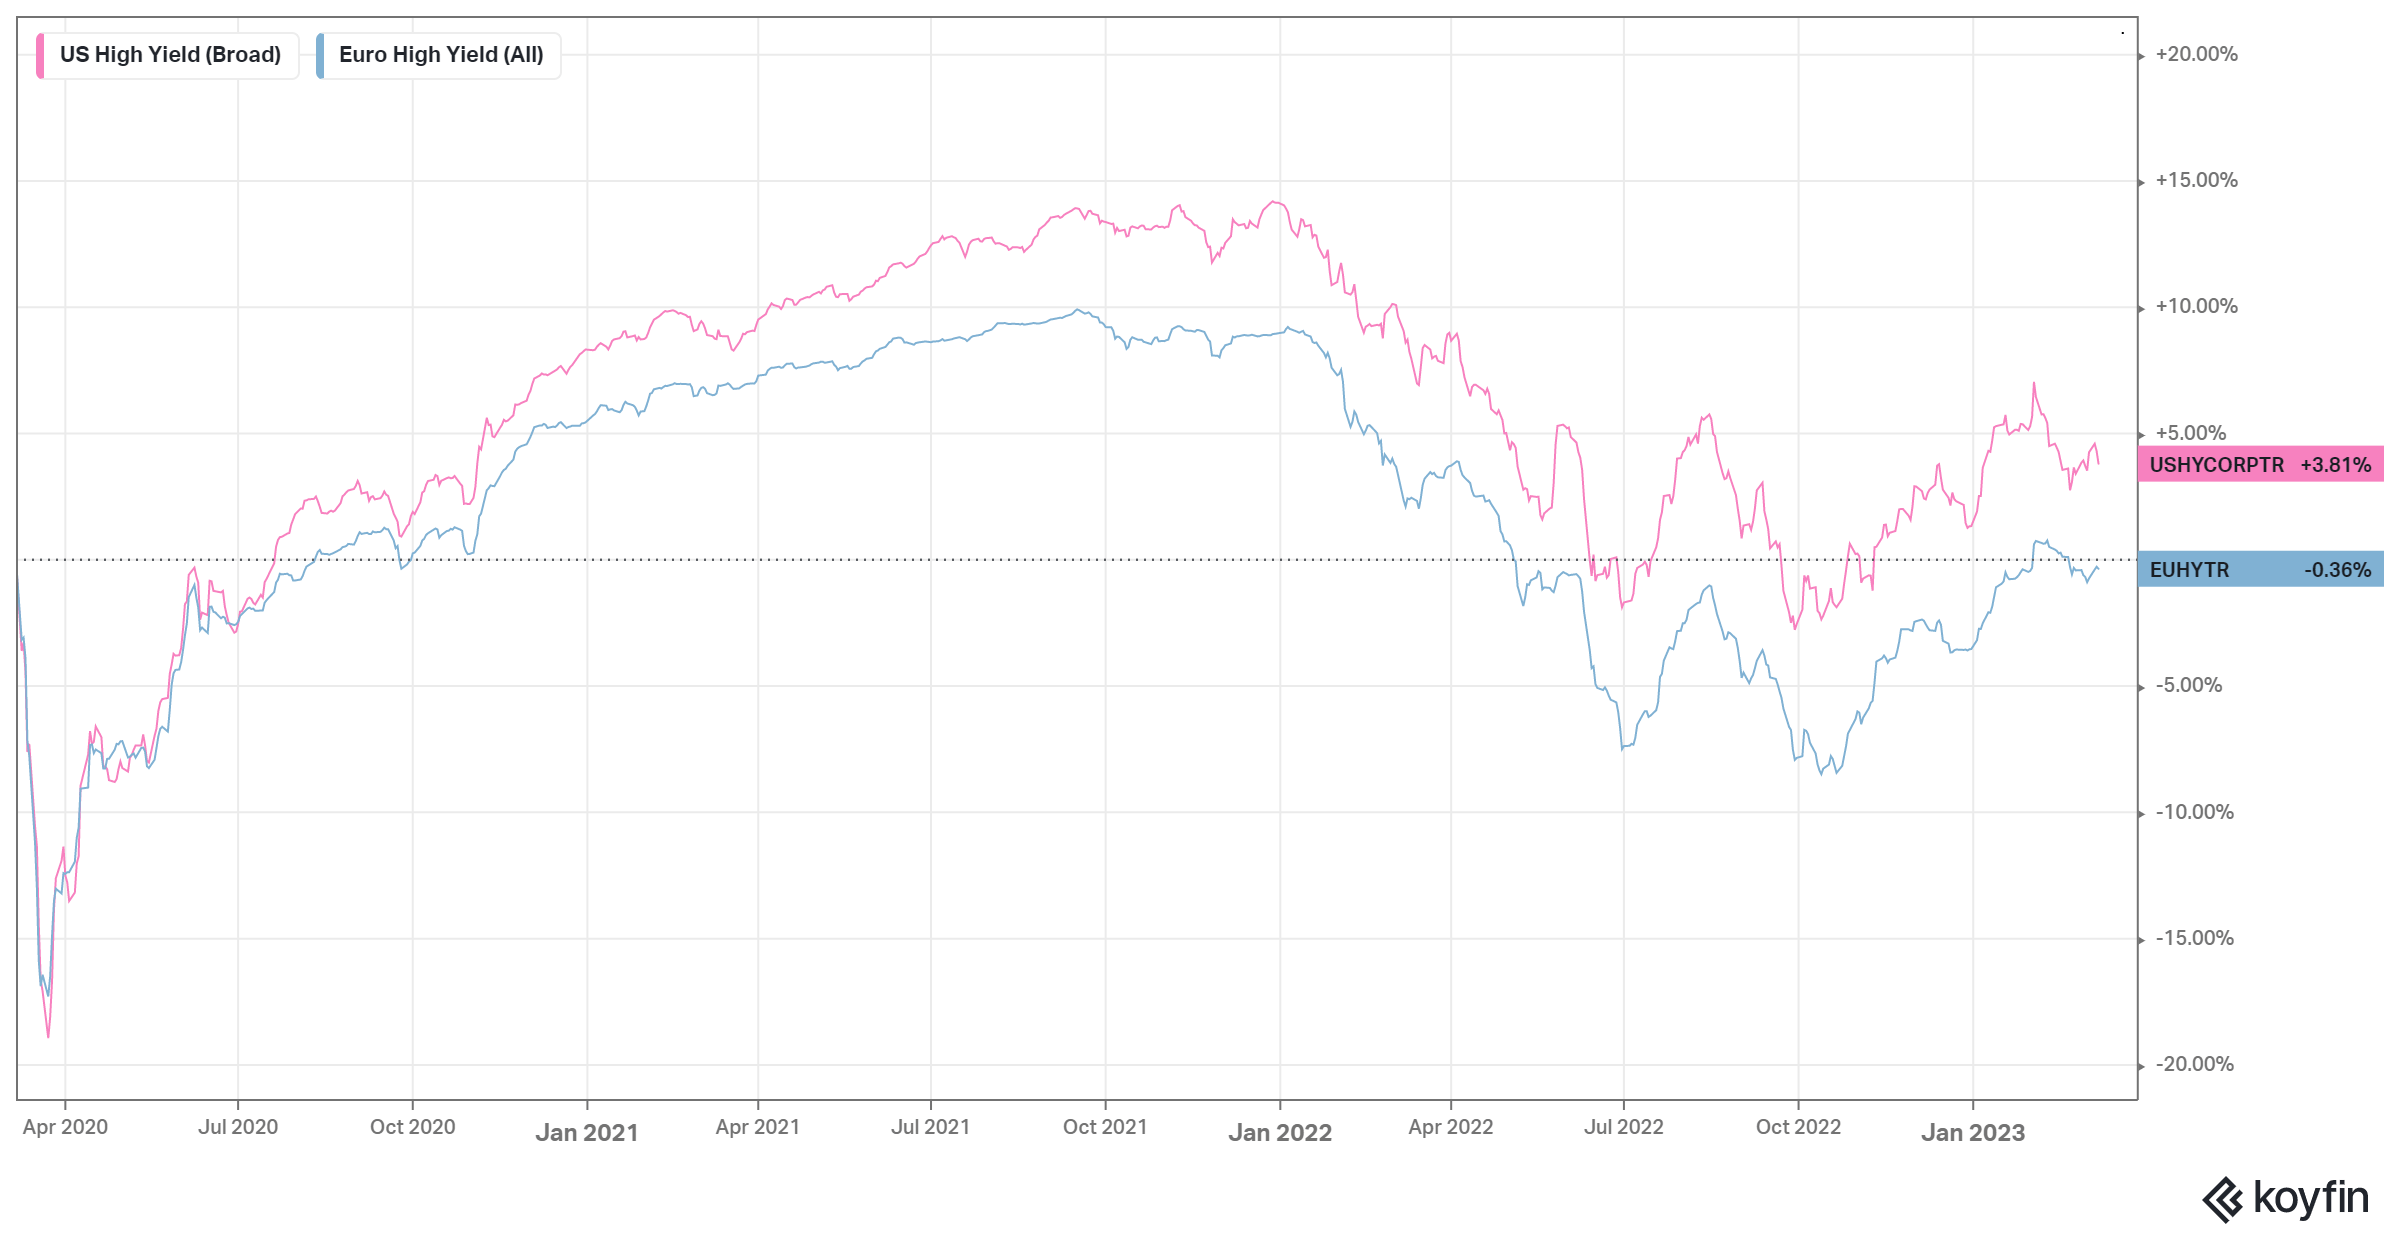
In the last three years US High Yield has outperformed European High Yield from a Total Return perspective thanks, partly due to US growth dynamics being more favorable to European growth dynamics since the bottom touched during the COVID pandemic crisis:
It wasn't the case that US High Yield Total Return was superior to European High Yield as per the below 10 years chart:
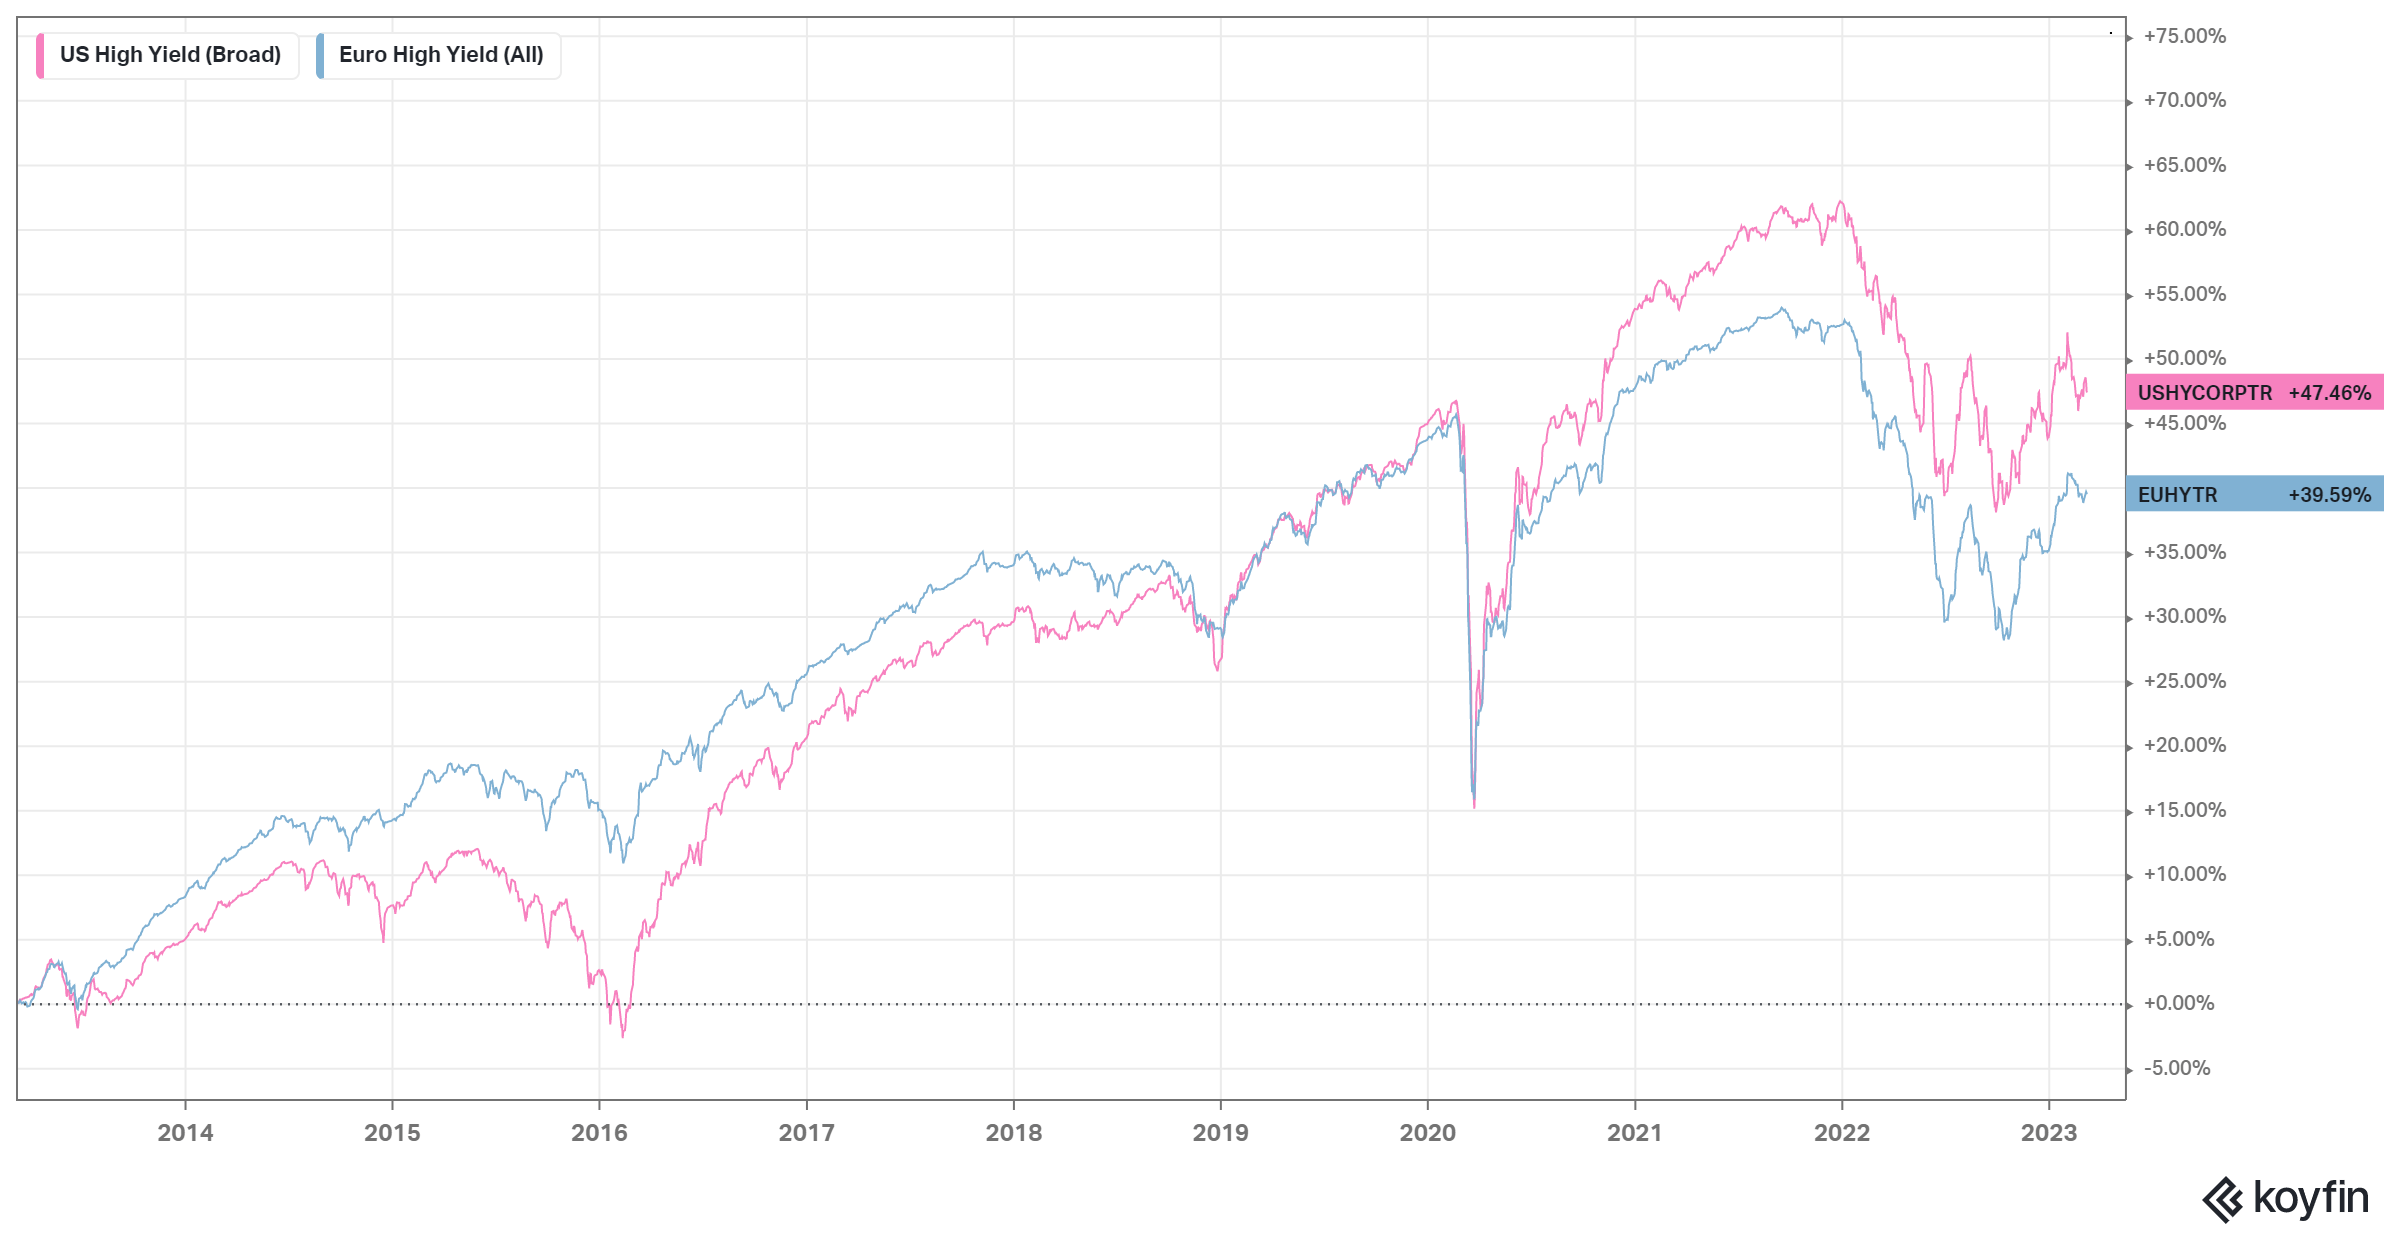
As well what we found of great interest given the most recent "turmoil" in US Financials has been the outperformance of European Financials relative to US Financials in the last 6 months:
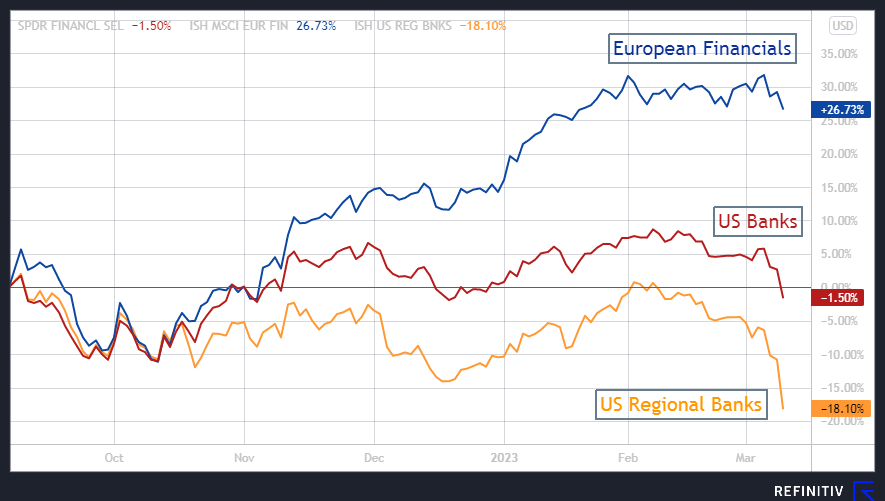
But, the outperformance of European financials over US Financials has been a recent feature. In the last 10 years US banks thanks to the different path of their respective central banks have led to a different outcome:
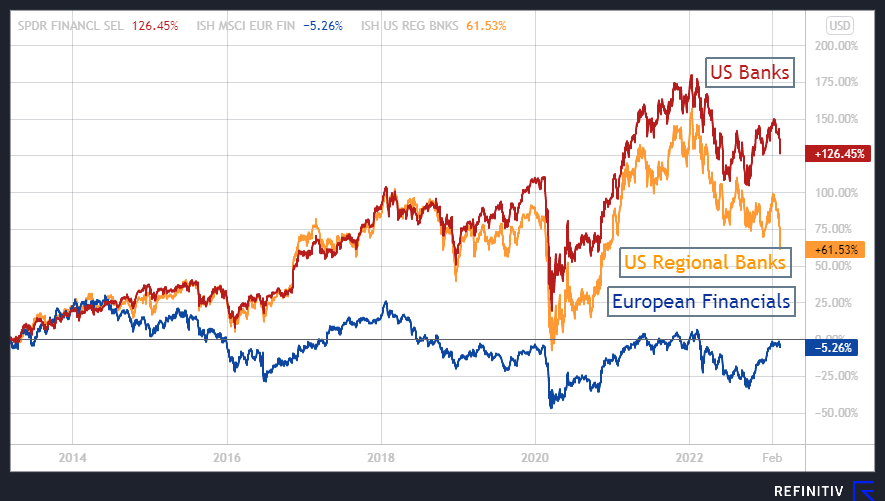
We have used this core principle in the past when assessing the issues plaguing Europe versus the United States as per our September 2012 conversation "Zemblanity":
"We mentioned the problem of stocks and flows and the difference between the ECB and the Fed in our conversation "The European issue of circularity", given that while the Fed has been financing "stocks" (mortgages), while the ECB is financing "flows" (deficits). We do not know when European deficits will end, until a clear reduction of the deficits is seen, therefore the ECB liabilities will have to depreciate." - Macronomics - 2012
The Fed clearly played a much efficient game in restoring the "credit impulse" by dealing swiftly with the impaired assets of US banks during the Great Financial Crisis ((GFC)) whereas, with its numerous liquidity supports (LTROs), the ECB has continued to provide funding for these impaired assets until finally launching its own QE. The deleveraging of the US banking sector was much swifter but we are ranting again.
Credit growth is a stock variable and domestic demand is a flow variable. Spending growth is related not to "credit growth" but its derivative, namely the change in credit growth or " credit impulse ". The credit impulse is the private sector equivalent of a fiscal impulse. As such the US "fiscal impulse" during the COVID pandemic was "massive".
But why such a difference in the performance between European Financials relative to US financials you might rightly ask? We agree with @N013Q explanation on our Twitter feed:
"EU vs US banks differences: (i) slower loan growth in Europe, (ii) weaker competition from money market funds, (iii) no Fed reverse repo facility, (iv) much slower QT and (v) much greater use of long-dated interest rate hedges at some banks." - @N013Q
No wonder AUM of US money market funds have surged to a new $4.9tn all-time high as short rates have soared!
On another topic, the recent weakness in financial stocks warrants attention and comments. SVB Financial Group sell-off might have been a "trigger" leading to a contagion to the entire sector, but, we do not think that raising interest rates and shrinking reserves as well as a deterioration in asset quality and rising impairments such as in Commercial Real Estate ((CRE)) are the only reason for the pressure on the entire sector.
As pointed out by our very astute trader friend (@graphfinancials on Twitter), banks were having a too good of a time until Jerome Powell our Cheshire cat (yes, we like giving nicknames for central bankers like Le Chiffre for Mario Draghi), started talking about "reserve requirements".
Our friend sounded the alert on the 8th of March given changing capital requirements is way more effective in curbing banks than raising rates. We read with great interest the article by Paul de Grauwe and Yuemei Ji from the 27th of February in Project Syndicate entitled " Tame inflation without subsidizing banks ":
"When central banks raise interest rates, they also raise the cost of payments on commercial banks' excess reserves. The best way to avoid a windfall for bankers - and a burden for taxpayers - is to shrink the central bank's balance sheet by selling government bonds while implementing a temporary increase in minimum reserve requirements." - Paul de Grauwe & Yuemei Ji .
He also indicated something extremely interesting in the sense that an inverted yield curve only works in taming credit growth when you rely on "interbanking" but it doesn't work when you have a lot of "reserves". Higher interest rates lead to higher lending rates but not the funding rate because there is a very low deposit cost currently. The real funding cost are deposits. The real measure of liquidity today therefore is not the yield curve dear friends but the FDIC deposit rate!
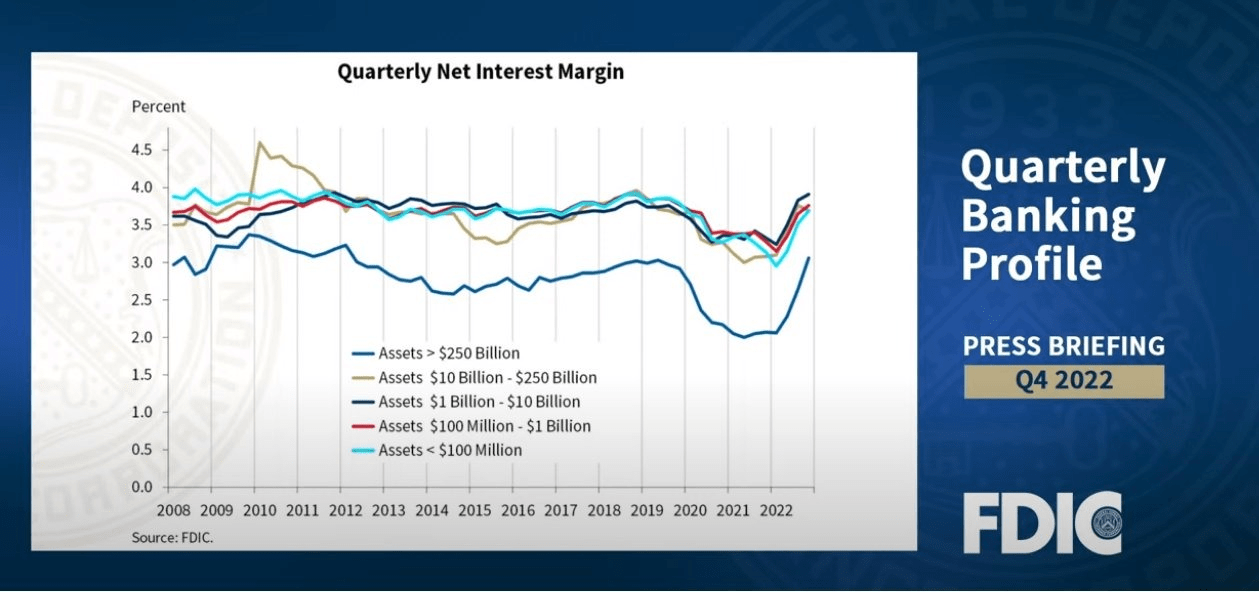
Of course we saw the effect on NIMs (Net Interest Margins) for US banks:
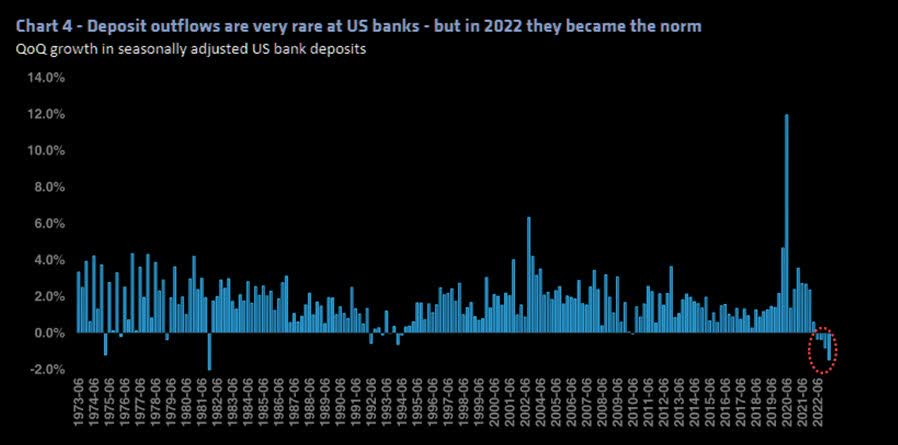
In a situation of "excess reserves", the banks don't need to rely on "repo" to find liquidity, they just create new loans and the cost of funding on deposits, is very low, it "lags". This is exactly the term used by the Chairman of the FDIC recently as pointed out by our trader friend:
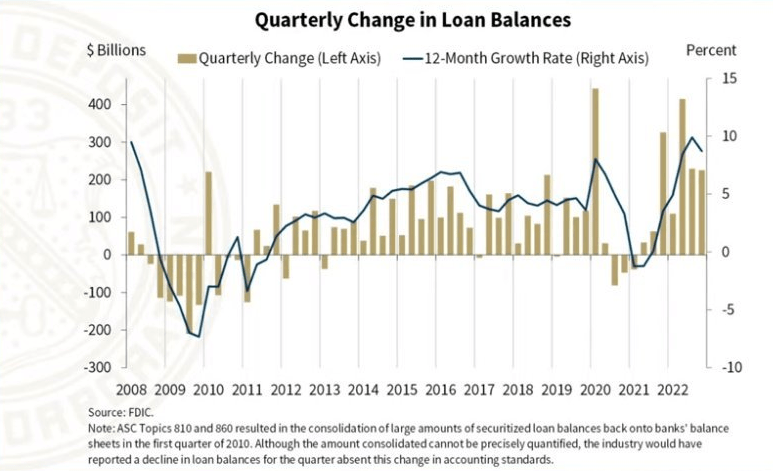
"The result is that Net Interest margin of Banks expands. So they are very eager to lend more. Thanks to rising rates. You will hear all banks glad that rates were rising including in the FDIC reports. At some point the NIM expansion slows down. In Q4 NIMs still increased but slower. But banks continue to lend. When NIMs start to shrink plus losses start to mount, "Banks" become cautious (see the most recent Fed Senior Loan Officer Opinion Survey for cues). Rates start to have an effect in curbing banks in a context of excess reserves. Why does the cost of deposits lag? Because it takes time for people to realize they could get more moving to Money Market Funds that pay FFR or to buy T-Bills. As long as deposit are very comfortable, Banks don't care losing some deposits, it's fine, they like paying nothing, but it changes over time. The brown bars represent the growth in lending. They are higher than pre-pandemic (14% YoY)."
We agree that at this point loan growth was higher than pre-pandemic. This is not unsurprising since "Banks" create the means of circulation that are reflected in nominal GDP. Too much means of circulation versus need of trade = high nominal GDP, high inflation. If you want to curb "loan growth" you need to hike "reserve requirements. Et voilà.
Easy money is indeed transferring higher interest payments from the central bank to private banks as pointed out in the project syndicate paper. This means profits for private banks and losses for the central banks:
"The latest monetary-tightening cycle implies profits for commercial banks and financial losses for central banks, raising anew the question of whether commercial banks should be remunerated for holding reserves at the central bank. Is paying interest on reserves necessary to conduct monetary policy? Or can central banks raise interest rates without giving massive handouts to commercial banks?
While many economists take it for granted that bank reserves earn interest, the practice is a rather recent phenomenon. The ECB introduced interest payments on excess reserves when it started its operations in 1999, and the US Congress authorized the Fed to do so in 2008. Prior to 2000, the general practice was not to pay interest on banks' deposits.
In fact, commercial banks do not pay interest on demand deposits, even though these deposits, too, provide liquidity for the real (non-financial) economy. Why should bankers be paid for holding liquidity while everybody else should accept not being remunerated?
The lack of a genuine economic basis for paying interest on reserves becomes even more apparent when one considers how central banks make their profits: By obtaining a monopoly from the state to create money. The practice of paying interest to commercial banks amounts to transferring monopoly profit to private institutions. But that profit is essentially taxpayers' money, and it should be returned to the government that has granted the monopoly rights, rather than funneled to commercial banks." - Paul de Grauwe & Yuemei Ji .
This is indeed why we think that hiking rates in itself to slow down further the economy and rein inflation needs some tuning as indicated by the two authors:
"The advantages of minimum reserve requirements are twofold. First, the authorities can eliminate the distortion created by providing massive subsidies to banks. Second, policymakers gain an exceptional policy tool designed to take a big bite out of a central bank's balance sheet while still maintaining financial stability.
Central banks can increase interest rates without massively subsidizing banks. Their profits should once again be transferred to governments. Taxpayers, not banks, should benefit from public-sector money." - Paul de Grauwe & Yuemei Ji .
In practice it means that if you need to comply to new reserves requirements you need to borrow in the "interbank markets" and there dear friends, the rate is not the meager 35bps of FDIC, it's FFR on overall cost of funding. Remember that Reserve requirements has been set at zero since 2020.
On a side note and as rightly pointed out by Edwin Walter Kemmerer (which we mentioned in our conversation " Tantalean Punishment "). In 1920 he explained the following:
"Inflation through boosting the cost of living for millions of people at rates more rapid than it boosted wages forced these people to rigid economies that released labor and capital for the economies conduct of the war. In doing this it performed a useful service; but its burdens were grossly unequal and ill-proportioned to the shoulders that were called upon to bear them. The war's economic burden fell heavily upon those wage-earning and small salaried people whose incomes lagged far behind prices on the upward move. It was they who did the lion's share of the real economizing that released the labor and capital needed for the production of the sinews of war.
Probably the most important single cause of the widespread discontent exsisting throughout the country to-day, and one of the principle causes of the rapid spread of economic radicalism is the rising cost of living with its grossly unequal effects upon the economic welfare of different economic classes and of different groups within each class. In connection with the discontent that usually results from inflationary movements, the French have a saying "the guillotine follows the paper money pres - the two machines are complementary one to the other." - Edwin Walter Kemmerer
Yet another hinter to why we have a "pre-revolutionary mindset" in continuation to our previous conversation. What our astute friend also pointed out is that during WWI, food did better than metals but, yes, like our Cheshire cat, maybe we are misdirecting you as well and throwing you yet another curveball.
- Volatility most likely to return
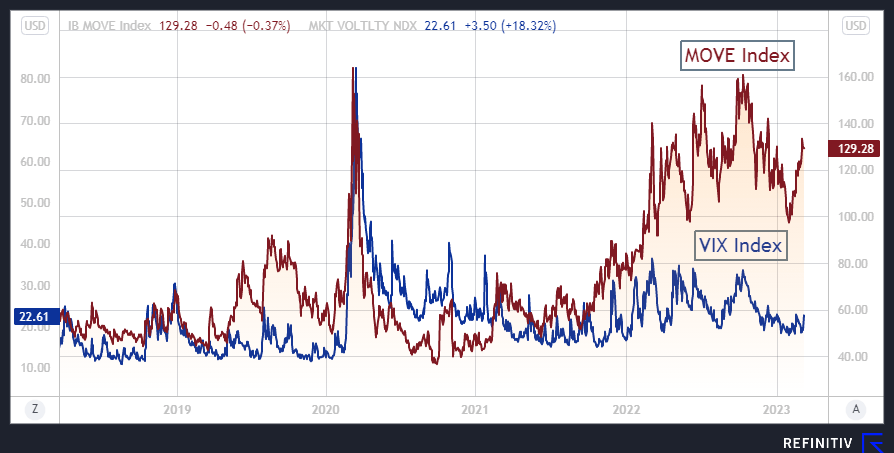
As we pointed out in various musings of ours, we follow very closely bond volatility aka the "MOVE Index" for cues on the direction for financial markets given it was the rise in bond volatility that marked the rise in real yields and "convexity" in 2022 which seriously impacted the famous 60/40 portfolios and risk parity funds. Yes, bond volatility matters and matters a lot:
As per 2022, MOVE index has the first mover advantage on VIX we think hence the importance of tracking its move. It is also weighting heavily on credit markets, which until very recently as we pointed out earlier in our conversation were behaving quietly and were sitting on the "tight" side. Given the returns of "convexity" with the Fed being higher for longer and in the light of the most recent Nonfarm payroll print (311 K versus 225 K expected). As such a 50 bps hike is most likely coming from the Fed.
On top of the return of "bond volatility" and as mentioned in our previous conversation, the "elephant in the fixed income room" is indeed Japan. If indeed Japanese investors, namely the massive GPIF and his lifers friends as well as Mrs Watanabe start to shun foreign bonds then accelerated outflows will weight on Euro Government Bond yields even more. On top of that we think there is a "Big Gamma" risk à la 1987 due to the incredible volume traded on OTDE options (extremely short dated options).
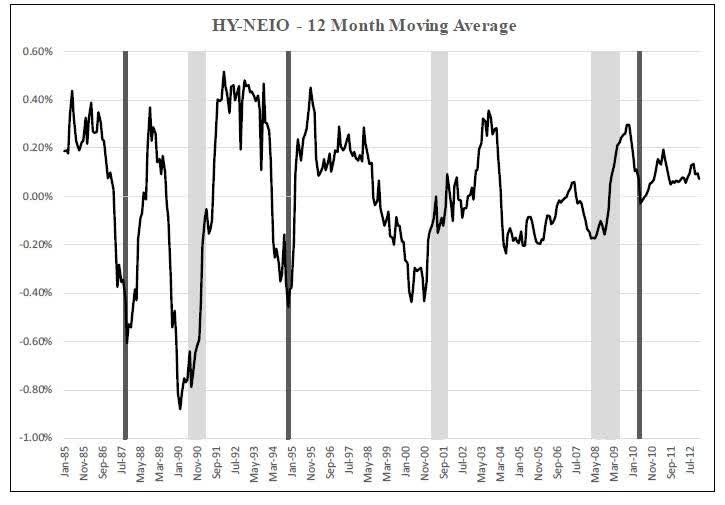
Outflows as well from High Yield credit towards short-term US Treasury ETFs are also indicative of a more bearish set up in our book as we pointed out in 2018 in our conversation " The Korsakoff Syndrome " where we pointed out a Wharton paper written by Azi Ben-Rephael, Jaewon Choi and Itay Goldstein published in September and entitled " Mutual Fund Flows and Fluctuations in Credit and Business Cycles ".
This paper suggested using flows into junk bond mutual funds as a gauge of an overheated credit market to tell where we are in the credit cycle. Could that be a reliable "Boom to Bust" indicator?
"Several measures of credit-market booms are known to precede downturns in real economic activity. We offer an early indicator for all known measures of credit booms. Our measure is based on intra-family flow shifts towards high-yield bond mutual funds. It predicts indicators such as growth in financial intermediary balance sheets, increase in shares of high-yield bond issuers, and downturns of various measures of credit spreads. It also directly predicts the business cycle by positively predicting GDP growth and negatively predicting unemployment. Our results provide support for the investor demand-based narrative of credit cycles and can be useful for policymakers.
A large body of literature in macroeconomics and finance studies the link between credit markets and macroeconomic cycles. A pattern that emerges from the data is that credit booms precede downturns in macroeconomic activity. This pattern attracts considerable attention from academics and policymakers: if credit markets are at the root of macroeconomic fluctuations, then it is important to better understand what drives credit cycles and identify leading indicators to try and design policies that will moderate them.
In this paper we show that investor portfolio choice toward high-yield corporate bond mutual funds is a strong predictor of all previously identified indicators of credit booms. An increase in our measure in year t predicts credit booms marked by the other indicators in the literature in years t+1 and t+2. These other indicators include the proportion of low-quality bond issuers (Greenwood and Hanson, 2013; López-Salido, Stein, and Zakrajšek, 2017), the degree of reaching for yield in the bond market (Becker and Ivashina, 2015), balance sheet growth in financial intermediaries (Schularick and Taylor, 2012; Krishnamurthy and Muir, 2015), and various measures of credit spreads (Gertler and Lown, 1999), in particular the excess bond premium (EBP) recently proposed by Gilchrist and Zakrajšek (2012).
HY outflows (Wharton paper, by Azi Ben-Rephael, Jaewon Choi and Itay Goldstein)
In addition, our measure, as a leading indicator of credit booms, positively predicts GDP growth and negatively predicts unemployment rates in years t+1 and t+2 (before they turn in the reverse direction in year t+3)." - source Wharton paper, by Azi Ben-Rephael, Jaewon Choi and Itay Goldstein
According to Bloomberg a trio of some of the most popular corporate bond ETFs posted a combined $11.9 billion in outflows last month, led by a record $4.9 billion withdrawal from the $12.8 billion iShares iBoxx High Yield Corporate Bond ETF (HYG). Yet maybe some other "curveballs" coming your way we think so watch fund flows closely.
"Good hitters say they can recognize the curveball when it gets a particular distance from home plate." - Frank Vizard
For further details see:
Curveballs