MDT - DaVita: Breakout Not Supported Without Leverage Effects Reiterate Hold
2023-07-21 16:52:29 ET
Summary
- DaVita Inc. revised its FY'23 guidance numbers and calls for sequential growth throughout 2023.
- The company also projects around $1Bn in free cash flow this year, primarily due to operating efficiencies.
- Despite this, valuations and profitability aren't supported well without the company's capital structure, with ~$8Bn in long-term debt to mature.
- Net-net, reiterate hold.
Investment updates
Following my March publication on DaVita Inc. ( DVA ) there have been notable updates to the investment debate. For one, the stock has pushed ~30% higher off its former lows, outpacing the benchmark indices in doing so. Second, the firm revised guidance numbers to the upside, and this sentiment was echoed among Wall St. analysts and investor positioning in the derivatives markets.
Management now projects ~$1Bn in free cash flow this year at the upper end of range, underscored primarily by operating efficiencies. My numbers call for the firm to do around this number in FCF for FY'23 on $1.4Bn in pre-tax earnings. Further, I'd comment on DVA's profitability that has remained defensive over the past two years despite the market selloff in its stock.
Despite this, valuations derived on projected cash flows do not support a change in rating from my hold stance, and thus I am reiterating the stock as a hold. Whilst I am more constructive on earnings power and asset factors, DVA is not undervalued in my opinion, despite a number of positive factors. The investment debate is balanced, thus, I'm reiterating DVA as a hold.
Figure 1.
Updates to critical investment facts
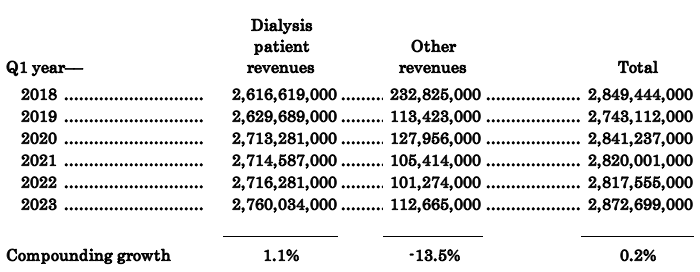
DVA's most recent numbers are a good place to start as there were many updates provided for full-year expectations. Quarterly sales pulled to $2.87Bn, with dialysis patient revenues up to $2.76Bn. Zooming out for perspective and you'll note top-line growth is not a standout feature in the debate here. The firm's compounded turnover at ~20bps per year since FY'18, and 110bps in its dialysis service business over this time [Table 1]. I am looking to the company hitting ~$11.8 - $11.9Bn in sales this year to generate $6.85-$6.90 in earnings, or ~3.7% YoY growth.
Table 1.
Note: Table shows data from Q1 in each year respectively. (Data: Author, DVA SEC Filings)
1. Breakdown of turnover gives insight to FY'23 estimates
First, DVA booked a 1% sequential increase in treatments per day. Total number of patients under its dialysis services business came to 246,000 across 3,058 outpatient dialysis centers, up from 199,500 and 2,274 end of FY'22, respectively. During this period, DVA opened 3 new dialysis centers while closing 20 centers in the U.S. Further breakdown of this shows:
- Integrated kidney care ("IKC") continues to be a critical factor for the company's top line. It covered 67,000 IKC patient lives by the end of Q1, another 15,000 of these are covered under integrated care arrangements.
- U.S. dialysis treatments per day were up 1% sequentially, attributed to a higher patient census.
- Revenues per treatment were down $0.16mm quarter-over-quarter, but were up ~130bps YoY to $366.1mm.
- This pulled to a decrease in cost per treatment by $1.18mm to $257.34mm. Around $6mm in losses were booked under the equity method of investment income under this total.
I'm looking for DVA to produce $11.83mm in turnover this year on earnings of $6.85, as mentioned, meaning it needs to do another $165mm in turnover by the end of the year. There's good scope for DVA to hit these numbers. Management revised guidance upwards last period and now calls for $1.6Bn in operating income at the upper bound, and hopes to pull this to $750mm-$1Bn in FCF. Although, $250mm variance in the guided range of FCF is quite a spread, and doesn't suggest an aura of confidence in my opinion.
Figure 2.
Data: Author, DVA SEC Filings
2. Capital structure masking earnings growth moving forward
DVA is debt-heavy and carries ~$8.15Bn in long-term liabilities, and, combined with the goodwill it records on the balance sheet, has negative tangible book value of $6.45Bn. Also, $2.4Bn in equity holds up $16.7Bn in assets, thus, you can clearly see the leverage effect and how the company will grow its return on equity moving forward. Trailing ROE for the company is ~21.5% - 60% including all minority interests - but the breakdown on this, given the leverage, is revealing:
Figure 3.
Note: All figures are presented in TTM format as of Q1 FY'23 (Data: Author, DVA SEC Filings)
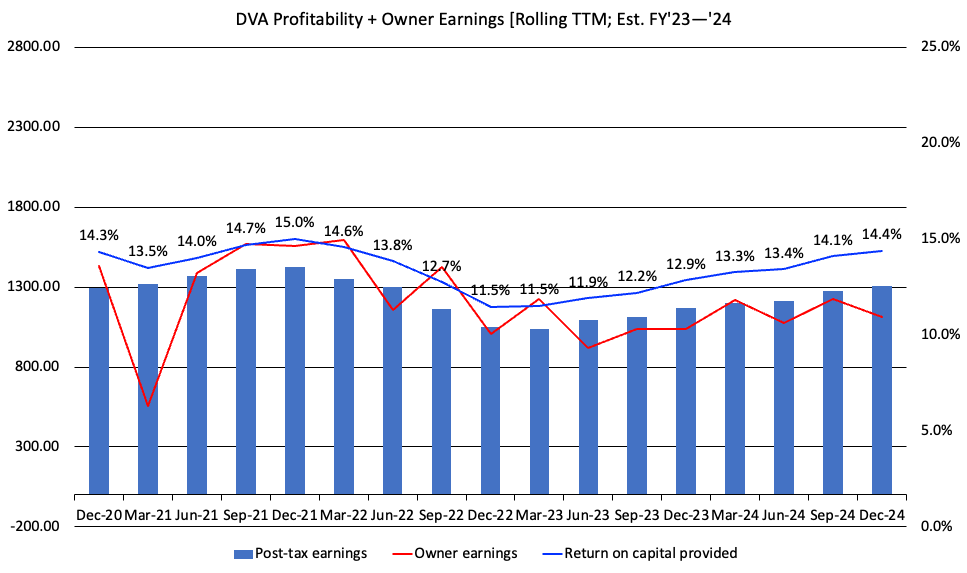
You can see above the company's use of leverage (debt) has increased the ROE by 18.4%, and a whole 57%, including all minority interests. Therefore in my opinion it isn't growth in operations that is driving the profitability of the business in this case. If you strip the leverage effect out of it and look further up the income statement (before financing costs) you can see this same profitability isn't shared as equally. Here I've taken the tax-adjusted operating income and scaled it by the company's total capital (debt + equity capital) on a rolling TTM basis. Two things you'll notice. For one, post-tax earnings are down substantially off 2020 highs. This is coupled with a sharp reduction in owner earnings (NOPAT less investments made). As a result, the business's true profitability - the post-tax earnings it produces on capital provided - has pulled back off 15% highs in FY'21 to ~11.5% in the TTM.
Going forward, my numbers have these trends to normalize to ~14% by FY'24. My modelling doesn't have any growth in owner earnings over this time, but to produce ~$1 - $1.2Bn over this projection period. Hence, stripping leverage out of the equation, the 'earnings' growth isn't as attractive at face value (even when including all the firm's minority interests).
Figure 4.
Touching on the capital structure quickly, I'd note to you that DVA ended the quarter at leverage of 3.9x EBITDA . Management wants to bring this down to 3 to 3.5x EBITDA. It will sacrifice buybacks to achieve this, something which may or may not help equity performance going forward. Looking ahead, DVA anticipates interest expenses of $100-$110mm per quarter for the rest of the year. Furthermore, the April launch of Mozarc Medical [a partnership with Medtronic ( MDT )], will result in pre-tax losses of ~$20mm below the operating line in Q2, and $15mm per quarter in losses over the coming 3-years.
Finally, the firm is leaning up OpEx by consolidating 40-50 centers by the end of the year, and will hopefully clip $125-$175mm in savings as a result. It has closed 20 centers this YTD already as of Q1, as mentioned.
3. Market generated data balances debate
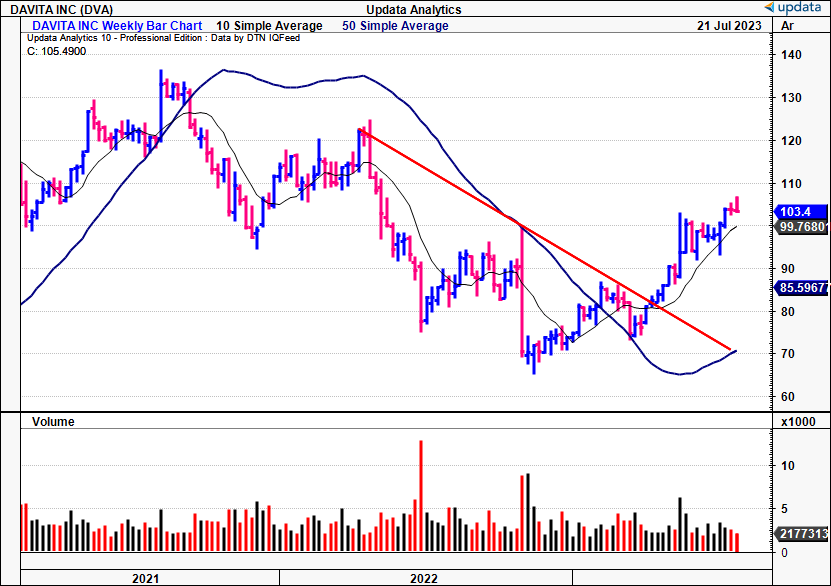
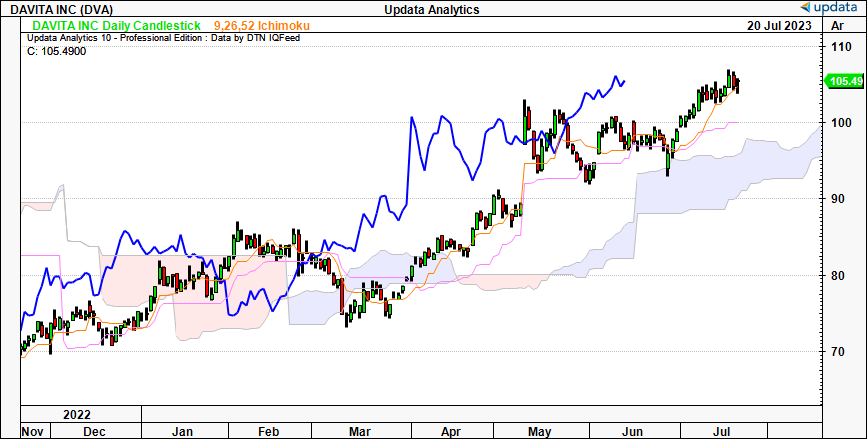
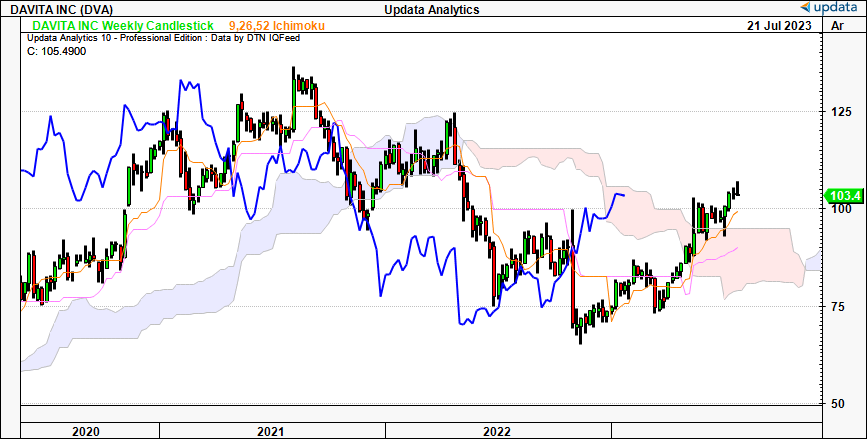
The analysis of market data contributes significantly to the bullish side of risk-reward calculus. Upon examination of the daily cloud chart [Figure 5], it is evident that shares are positioned above the cloud, with the lagging line (shown in blue) in situ. This observation suggests a positive trend in the coming weeks in my view.
Additionally, the weekly cloud chart indicates a bullish shift towards a well. Note, the lagging line poised to break through the top of the cloud if this latest rally extends further. Should this occur, it could prove to be an additional bullish factor, and must be factored into the debate. The weekly chart provides insight into the market's performance in the upcoming months.
Figure 5.
Figure 6.
Based on the point and figure study below, I've got projected upside targets to $107. These charts effectively eliminate intra-trend volatility and the noise of time, this providing a more objective view. While I believe $107 may be a viable target with some degree of confidence, it does not align with my fair value estimates discussed later.
Figure 7.
Data: Updata
Positive money flows have also been observed over the last few months, as shown below. The chart shows weekly inflows, with capital accumulating in the stock. This trend warrants consideration in my opinion, as a sufficient amount of buying power could potentially elevate the stock's rating, as we've seen thus far. The source of the capital inflows is a determining factor- if they are originated from institutional or sophisticated investors, it would certainly bolster the bullish argument in my opinion. You need sufficient buyers to create the demand for this rally to extend, thus, data shown in Figure 8 is valuable moving forward.
Figure 8. Weekly money flows into/out of DVA equity stock
Data: Updata
Valuation and conclusion
The valuation debate covering DVA is equally as mixed. On the one hand, you've got investors selling their DVA stock at ~15.5x forward earnings , and ~10x forward EBITDA, discounts of 25% and 27% to the sector, respectively. This, whilst pricing the stock at 6x book value-but I've already discussed the potential discrepancies around the company's equity value and ROE. To offset this, you can buy DVA at 5.6x trailing cash flows-and that's fairly attractive in my opinion.
So if you're a manager or investor mandated to a benchmark these relative multiples may be quite attractive. You can get the stock at a respective discount to peers.
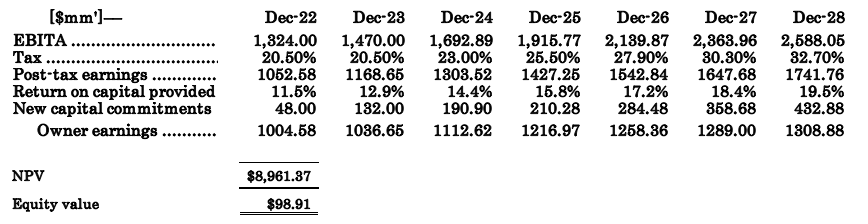
On absolute terms, however, my growth assumptions aren't as favorable. Based on my projections of DVA's capital commitments, returns on capital, and owner earnings into FY'28, I've got the company priced at $98/share NPV at a 12% discount rate. This rate reflects the long-term market averages, and thus the opportunity cost of holding the benchmark indices. Depending on your choice of discount rate will depend on the firm's intrinsic valuation here. For instance, an 8% discount rate gets me to $133 in equity value. But I believe the 12% is more reflective of the opportunity cost at hand, and so will look to the $98 value with more weighting, supporting a neutral view.
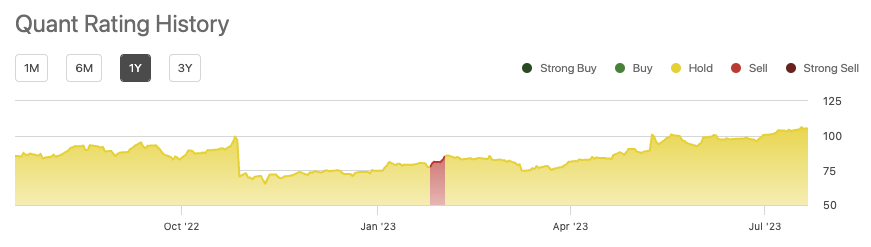
This view is also shared by the quant rating system that has the company rated a hold, with no change in this across the entirety of 2023.
Figure 9.
In summary, the investment debate is balanced for DVA in my view. On the one hand, the firm projects higher earnings growth going forward, coupled with unit economics that are growing as well. However, the company's returns on equity relies, and thus earnings growth relies, heavily on leverage effects, and without the balance sheet to back it up, returns on equity are quite unattractive in my view. Technicals are improving too suggesting demand in the stock, with money flows positive across the entirety of 2023 YTD. However, my FY'23 - '28 assumptions don't support a bullish valuation, and thus, don't align with my own investment tenets. Therefore, I'm reiterating DVA as a hold for now, looking forward to providing further coverage.
Appendix 1. DVA forward estimates, fair value (discounted at 12%)
For further details see:
DaVita: Breakout Not Supported Without Leverage Effects, Reiterate Hold