OGN - Debt Metrics: How To Interpret Them And When They Matter
2023-06-08 12:39:22 ET
Summary
- The article discusses leverage ratios such as debt to assets, debt to equity, debt to EBITDA, and debt to free cash flow, as well as the interest coverage ratio.
- Using company examples, I explain various definitions, when the individual metrics are best used, and when they are better avoided due to potential false positives or false negatives.
- I show why the debt to free cash flow ratio and the interest coverage ratio (in relation to free cash flow) are my preferred metrics.
- Investors should also consider other liabilities such as operating leases and pension-related obligations when analyzing a company's financial health.
- Scenario analyses also help assess a company's debt servicing ability in a high interest environment.
Introduction
Coming out of the pandemic, the Federal Reserve raised interest rates at an unprecedented pace. Over the course of about 15 months, the federal funds rate was raised to 5.25% , a level not seen since the Great Recession . What was unthinkable three years ago is now a reality, and it increasingly looks as if the days of "easy money" are finally over. Companies are facing a higher cost of capital, which puts them at risk especially those who succumbed to the siren songs and took on excessive debt. Debt is not a bad thing per se, but with extremely low interest rates, malinvestments are increasingly common. Companies are being acquired at ridiculous valuations (e.g., V.F. Corp. ( VFC ) purchased fashion label Supreme for 3.7 times sales), shares are being bought back at all-time highs (e.g., The Home Depot, Inc. ( HD ) bought back $14.8 billion worth of stock at an average price of $388), and some companies would quickly cease to exist without a steady infusion of capital.
I've probably looked at more than 100 companies in the last two years and rarely have I seen one that hasn't increased its debt to a more or less significant degree. On the surface, this looks like a pretty bad setup in an environment where interest rates are likely to remain high for a significant period of time. The devil is in the details, and it is important to take a close look at a company's debt using a number of metrics. However, some of the more or less commonly available ratios can easily be misinterpreted, leading to false positives or, probably worse, false negatives.
In this article, I will discuss the most common leverage ratios - how they are defined, when they should be used, and when they can produce misleading results. Don't worry, no mathematical equations are used, and in fact, my preferred metrics can be explained in a sentence or two and provide illustrative results.
Debt To Assets, Debt To Capital
This is a straightforward ratio that puts debt in relation to a company's total assets, and is sometimes also referred to as the gearing ratio. "Debt" refers to all of a company's liabilities, such as interest-bearing debt and other liabilities, but definitions vary. Sometimes only funded debt is considered. In general, subtracting equity from total assets yields the most conservative version of the ratio because it implicitly takes into account all liabilities.
The debt to capital ratio can be viewed as a variant of the debt to assets ratio, since "capital" includes both debt and equity. However, investors should be careful not to compare debt to asset or debt to capital ratios from different sources, and it is important to know what is included in debt and capital. In my view, given the simplicity of the approach, investors should take the time to look at the balance sheet and calculate the ratios themselves or stick with a single source.
In general, a low debt to assets ratio indicates conservative management because a relatively high proportion of assets are financed by equity (Figure 1), which has no contractual right to interest payments, making the company more financially robust in a downturn. All other things being equal, a company with a low debt to assets ratio has a high loss-absorbing capacity (see below). A ratio greater than 1 means that a company has more liabilities than assets and is typically very inflexible in an economic downturn and increasingly at the mercy of its creditors (i.e., an increased risk of insolvency).
Figure 1: Comparison of a balance sheet with a low debt to assets ratio (left) and a high debt to assets ratio (right) (own work)
Conversely, the higher the debt to assets ratio, the lower the loss absorption capacity and the higher the theoretical probability that there will not be enough left over to satisfy the claims of suppliers, pensioners, bondholders, shareholders and other stakeholders in the event of bankruptcy. This, of course, raises the question of the actual value of a company's assets in the event of bankruptcy - a question that is difficult (impossible?) to answer ex ante.
While I acknowledge that most investors look at a company on a going concern basis and therefore do not necessarily have to know the "true" value of the assets, it is still important to watch for a potentially inflated asset base. Take, for example, a company that grows through acquisitions, assuming goodwill (the premium paid in addition to the value of the assets) in the process. If a company at some point in the future determines that the fair value of the acquired cash-generating unit is less than its carrying amount, the goodwill (and possibly other intangible assets) is impaired. This reduces the assets and affects the company's equity, resulting in an increase in the debt to assets ratio (Figure 2).
Figure 2: Schematic representation of the decrease in equity when a company recognizes a goodwill impairment charge (own work)
Common sense tells us that companies whose assets consist of a high percentage of goodwill may need to recognize impairment charges at some point. Kraft Heinz Co ( KHC ), for example, had a debt to assets ratio of 45% at the end of 2017. 37% of assets consisted of goodwill and 50% consisted of other intangible assets (e.g., trademarks). In 2018, KHC incurred impairment charges of $7.0 billion and $8.9 billion on goodwill and other intangible assets, respectively. The company did not incur any additional debt in 2018, so impairment charges were the primary reason for the 500 basis point increase in KHC's debt to assets ratio.
All in all, I'm not a big fan of using debt to assets ratios as a measure of leverage. They do not take into account a company's earnings power and require at least a rough idea of the value of a company's assets. Such ratios are problematic when calculated for balance sheets with a high percentage of goodwill or an inventory position prone to markdowns (see my article on Target Corporation ( TGT )). I acknowledge that the ratio provides an indication of how conservatively or aggressively a company is financed, but there are several other ratios that serve the same purpose and provide additional insight. In closing, I personally do not pay much attention to debt to assets ratios.
Debt To Equity
The debt to equity ratio is another leverage ratio that is similarly easy to calculate as the debt to assets ratio, but in its pure form only requires data from the right side of the balance sheet (total debt divided by total equity). As above, several definitions exist. An investor may choose to deduct cash and cash equivalents if they represent a significant percentage of total assets and are not needed for day-to-day operations. Of course, it is not always easy to determine the true percentage of excess cash.
The ratio may be "simpler" in that it requires only inputs from the right side of the balance sheet, but that makes an investor potentially prone to ignoring the asset base. Recall Figure 2 - an investor looking only at the liability side of the balance sheet may be lulled into a false sense of security by the 50% equity funding.
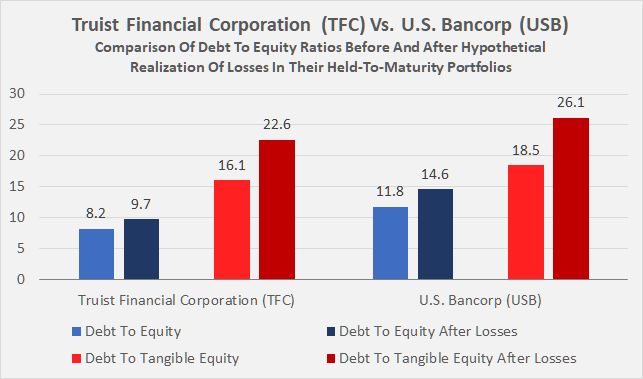
This is especially relevant when looking at banks' balance sheets. Regulators require banks to hold a certain amount of equity relative to their so-called risk-weighted assets (RWA, see this article for a "simple" approach based on internal ratings - IRB approach). Looking at a bank's equity ratio or debt to equity ratio can be extremely misleading, as the unfortunate example of Silicon Valley Bank ( SIVBQ ) has taught us (see my explanation and outlook on banks). Other banks' assets have also come under increased scrutiny, particularly those with a large amount of equity at risk of being eroded by large unrealized losses in their investment portfolios. Truist Financial Corporation ( TFC ) and U.S. Bancorp ( USB ) are two particularly notable examples, as they had unrealized losses of $8.8 billion and $9.6 billion, respectively, in their held-to-maturity portfolios at the end of the first quarter of 2023. While the theoretical impact on their respective equity is certainly significant and potentially devastating (Figure 3), I still consider the two stocks speculative buys and have recently added them to my portfolio.
Figure 3: Truist Financial Corporation [TFC] vs. U.S. Bancorp [USB]: Comparison of debt to equity ratios before and after hypothetical realization of the losses in their held-to-maturity portfolios (own work, based on the companies' 2023 first quarter 10-Qs).
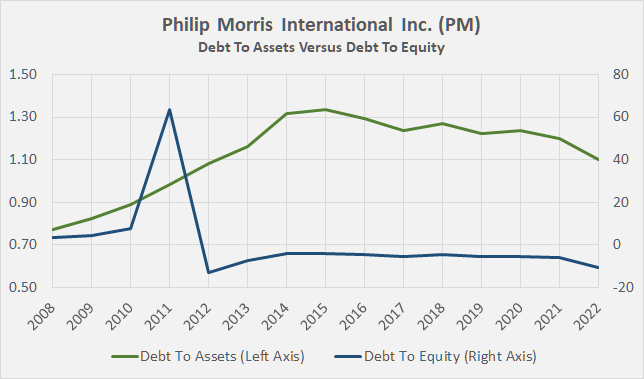
However, a high leverage ratio is not necessarily an indication of problems. Such static ratios do not take into account a company's cash earnings power and can therefore lead to false positives. A good example is Philip Morris International Inc. ( PM ), which aggressively bought back shares after its spin-off from Altria Group Inc. ( MO ) in 2008 and whose debt to equity ratio therefore actually turned negative in 2012 (Figure 4). Even though PMI's debt to equity and debt to assets ratios have looked pretty scary since 2012, I would argue that the company can easily manage its negative equity thanks to its very stable earnings and cash flow, as well as its notorious profitability as a major tobacco company.
Figure 4: Philip Morris International Inc. [PM]: Debt to assets and debt to equity ratio since the spin-off from Altria Group, Inc. [MO] (own work, based on the company's 2009 to 2022 10-Ks)
The buybacks have significantly improved PMI's earnings per share, but I would not go so far as to conclude that management bought back stock to boost otherwise poor earnings. There are other companies, such as Kimberly-Clark Corporation ( KMB ), that I am confident have bought back stock to prop up earnings and cash flow per share. As I discussed in another article , KMB's free cash flow has been treading water since at least 2010, but has increased by more than 22% when share repurchases are taken into account.
In summary, the debt to equity ratio is very easy to calculate, but its usefulness is limited. It provides a quick view of how aggressively a company is financed. Like the debt to assets ratio, this metric should only be used to compare companies in a particular industry. A high debt to equity ratio indicates that a company may be over-reliant on debt, while a low ratio suggests that management may be too conservative and not using debt appropriately to expand (as a reminder, equity is always more expensive than debt). An increase in the debt to equity ratio over time due to:
- impairment of goodwill and other intangible assets,
- accelerated depreciation and amortization of fixed assets and other assets,
- incurring debt to fund unpromising projects,
- or incurring debt to aggressively repurchase shares to boost earnings per share.
... may indicate a deterioration in fundamentals. However, a high debt to equity ratio does not necessarily signal problems, as the example of Philip Morris International Inc. showed. As will be discussed below, I believe it is very important to consider a company's cash earnings power when assessing the manageability of its debt.
Debt To EBITDA
The ratio of debt to earnings before interest, taxes, depreciation and amortization (EBITDA) provides a dynamic view of the debt of a company. While the above ratios are useful for a quick peer group comparison and for identifying potentially problematic trends, they do not allow a conclusion to be drawn about the sustainability of the debt. Before we take a closer look at the ratio, a word of caution. EBITDA is often referred to as a cash flow metric. I won't go into detail about why this is problematic, and I think it suffices to quote the comments of Warren Buffett and Charlie Munger in the 2000 annual report of Berkshire Hathaway Inc. ( BRK.A , BRK.B ):
"Investors are often led astray by CEOs and Wall Street analysts who equate depreciation charges with the amortization charges we have just discussed. In no way are the two the same: With rare exceptions, depreciation is an economic cost every bit as real as wages, materials, or taxes. Certainly that is true at Berkshire and at virtually all the other businesses we have studied. Furthermore, we do not think so-called EBITDA (earnings before interest, taxes, depreciation and amortization) is a meaningful measure of performance. Managements that dismiss the importance of depreciation - and emphasize "cash flow" or EBITDA - are apt to make faulty decisions, and you should keep that in mind as you make your own investment decisions. "
Page 65, 2000 annual report, Berkshire Hathaway Inc.
The debt to EBITDA ratio typically relates all interest-bearing debt to EBITDA. It is critical to make a meaningful estimate of EBITDA, and investors should be wary of one-time charges or tailwinds. I usually look at the three-year average of EBITDA, but of course, that doesn't help with companies that are growing aggressively or are in decline. It's a very descriptive metric because it shows the number of years it theoretically takes a company to pay down its debt. Of course, this is where the problems start, because I have yet to come across a company that does not have to make regular investments and pay taxes and interest.
Suffice it to say, I don't like to use the debt to EBITDA ratio because of these serious flaws and only use it for companies that don't have actual free cash flow, such as utilities. In a nutshell, the debt to EBITDA ratio assumes an indefinite life of the company's assets. I acknowledge that the investments of these companies tend to be very long-lived, but they eventually depreciate, so I remain very cautious about utility debt in general, and especially in the current high interest rate environment.
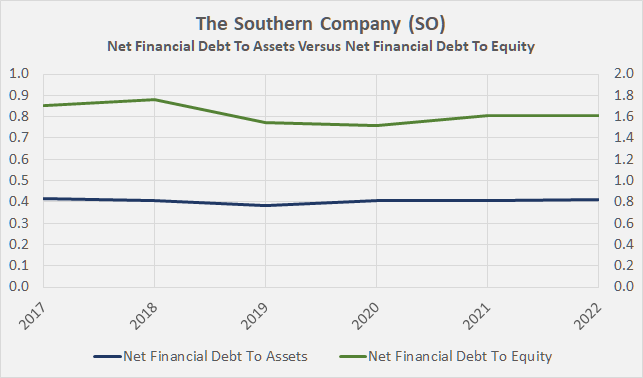
Take the example of The Southern Company ( SO ), a utility I have reported on in the past. Metrics such as net financial debt to assets and net financial debt to equity are not helpful in this context:
Figure 5: The Southern Company [SO]: Net financial debt to assets and net financial debt to equity ratio since 2017 (own work, based on the company's 2017 to 2022 10-Ks)
If one takes into account (adjusted) EBITDA as a proxy for earnings, things look different. Of course, one could argue that the substantial capital expenditures associated with the construction of Vogtle Units 3 and 4 will result in higher earnings later on and that the cost overruns are one-time in nature, but I would argue that there is always a way to make debt metrics look good. However, even using EBITDA before "special items," it is clear that Southern's debt only knows one direction. In 2012, net financial debt was 3.0 times adjusted EBITDA, and by 2022 it had increased to 5.6 times.
Although this all sounds very negative and perhaps implies that the debt to EBITDA ratio is a more or less useless metric, investors should still keep an eye on the ratio, as many creditors have formulated debt covenants based on this ratio. Not only can they directly impact a company's access to sources of liquidity, but a breach of debt covenants can quickly lead to a dividend cut or other unpleasant management decisions.
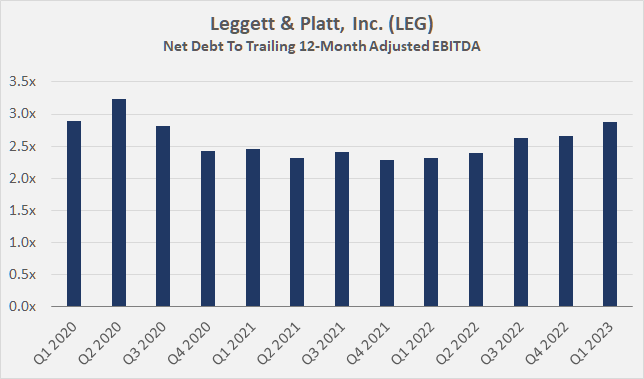
In this regard, diversified manufacturer Leggett & Platt, Inc. ( LEG ) serves as a good example. Due to the cyclical nature of its earnings, management acted prudently in 2020 and agreed with its creditors to modify some of the debt covenants. For example, the debt covenant associated with LEG's revolving credit facility was changed from gross debt to net debt in May 2020 and again in September 2021, to 3.5 times net debt to EBITDA from 2.5 times previously (p. 94, 2021 10-K ), creating more headroom for short-term liquidity needs. Figure 6 shows the evolution of Leggett's leverage since the first quarter of 2020. Those who have followed my articles on the company know that free cash flow fell off a cliff in 2021, underscoring the usefulness of adjusted EBITDA in the context of debt covenants, as it is less sensitive to short-term fluctuations than actual free cash flow.
Figure 6: Leggett & Platt, Inc. [LEG]: Net financial debt to trailing 12-month adjusted EBITDA since 2020 (own work, based on the company's quarterly earnings releases)
Debt To Free Cash Flow
My regular readers know that I place great emphasis on free cash flow. As an income-oriented investor, I need to ensure that the companies I own generate enough cash to fund their operations, grow, and pay a (growing) dividend. I acknowledge that a meaningful estimate of the debt to free cash flow ratio requires a bit of work. For one, the analyst must be wary of seemingly non-cash costs (e.g., stock-based compensation and related share repurchases to offset dilution). It is also important to have a good understanding of working capital movements, especially for companies with high working capital needs and/or those operating in cyclical industries. Those interested in calculating debt relative to free cash flow themselves should read this article detailing my adjustments to conventional free cash flow.
Putting (interest-bearing) debt in relation to free cash flow gives a similar illustrative number to the ratio of debt to EBITDA. One can subtract regular expenses such as dividends to shareholders to arrive at a more conservative estimate of a company's leverage. The debt to free cash flow ratio is definitely my preferred leverage metric, in combination with the interest coverage ratio (see below).
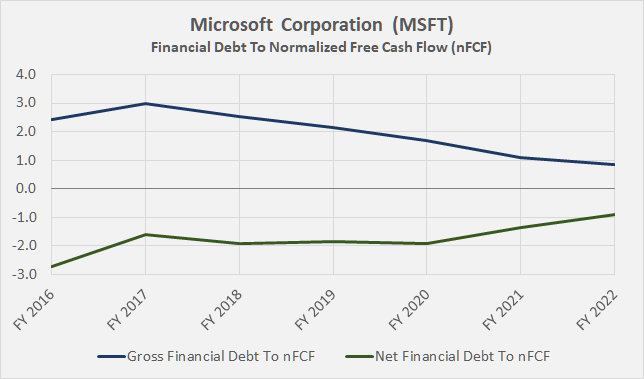
It is impossible to make a recommendation for an appropriate debt to free cash flow ratio. Companies with reliable cash flows and low capital expenditures, such as tobacco companies or IT companies with robust subscription models such as Microsoft Corporation ( MSFT ), can obviously handle much higher leverage ratios than cyclical industrial companies such as 3M Company ( MMM ). In this context, it is of course interesting to note that Microsoft is extremely conservatively financed (Figure 7) despite its highly reliable cash flows, while 3M's leverage is becoming more of a problem, in part due to high expected settlement charges and declining cash flows from operations - which is attributable to increasing competition, its cyclicality, and operational inefficiencies.
Figure 7: Microsoft Corporation [MSFT]: Gross and net financial debt to normalized free cash flow; note that Microsoft's negative net debt to nFCF ratio indicates that the company has a net cash position on its balance sheet (own work, based on the company's fiscal 2016 to fiscal 2022 10-Ks)
In principle, I consider a leverage ratio of up to four times net debt to free cash flow to be unproblematic, even for rather cyclical companies. Of course, an increase in this ratio over the years should be appropriately questioned, as it could indicate earnings problems or other challenges. It is also important to consider working capital. The post-pandemic period showed us how quickly cash flow can evaporate when, for example, supplies get stuck in transit or parts needed for completion are unavailable.
Finally, if a company's management is fairly conservative and maintains a low (or even negative) net debt to free cash flow ratio, I take that into account in my valuation. I am willing to pay a premium for companies with reliable free cash flow and low debt. Besides Microsoft, names like The Procter & Gamble Company ( PG ) come to mind. Under pressure from activist investor Nelson Peltz, the portfolio has been streamlined, debt repayment has been accelerated through divestitures, and cost-cutting measures have helped to significantly improve profitability. As a result, PG's net debt is now about 1.4 to 1.8 times the normalized free cash flow. And even after paying dividends, the company would only need three to four years to pay off all its interest-bearing financial liabilities.
Interest Coverage Ratio
This is my second go-to metric when assessing a company's leverage. According to many textbooks, the interest coverage ratio is obtained by dividing a company's net operating profit after taxes ((NOPAT)) by the net interest expense incurred. Again, it is important that the data be meaningful (e.g., use two- or three-year averages). In its foundation, the ratio is easy to calculate and very descriptive. The higher it is, the better, as the company only has to spend a comparatively small percentage of its operating profit on interest payments.
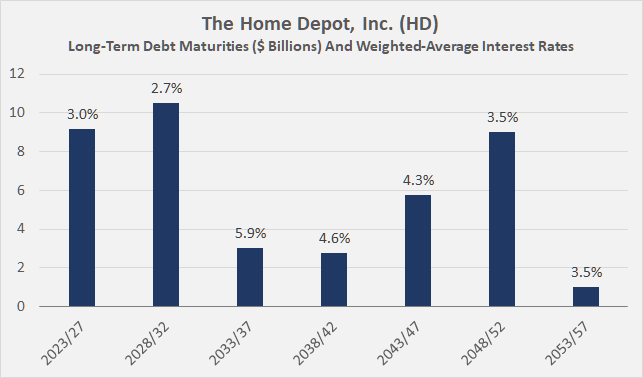
As always, the devil is in the details. For example, it can be dangerous to take net interest expense at face value. While a company with a substantial cash position may offset some of its interest expense with interest income from short-term investments, this income is sensitive to fluctuations in interest rates, while the weighted-average interest rate on the company's total debt adjusts relatively slowly. In this context, I find it extremely helpful to consider the debt maturity profile, also calculating the weighted-average interest rate on debt maturing over a given period. In my recent article on The Home Depot, Inc. and Lowe's Companies, Inc. ( LOW ), I discussed several important implications of interest rates, noting, for example, that HD is likely to face higher interest expense due to the comparatively low interest rate on its debt maturing in the next few years:
Figure 8: The Home Depot, Inc. [HD]: Long-term debt maturities as of year-end 2022 (own work, based on the company's 2022 10-K)
In the context of interest rates, it is very important to look for potential debt with adjustable rates. Organon & Co. ( OGN ), the women's health-focused spin-off from Merck & Co. ( MRK ) that I recently reported on , is a good example. At the end of the second quarter of 2022 , management expected interest expense to be $400 million, and although the company voluntarily repaid $250 million of its long-term debt in the first quarter of 2023, interest expense in 2023 is expected to be $515 million.
Since earnings are relatively easy to manage, I prefer to calculate interest coverage using normalized free cash flow before interest. I realize that adding net interest expense to free cash flow is not entirely accurate, as it does not take into account the tax shield effect of interest expense, but it is a sufficient proxy in my opinion. An interest coverage ratio of six times free cash flow before interest is perfectly acceptable, and I am willing to pay a premium for a company whose interest coverage ratio is well above the peer group average.
Finally, I think it can be worthwhile to do scenario analyses. The year 2022 has taught us that we should not be fooled by the apparent "new normal" of a zero interest rate environment. Investors who made sure their companies could withstand a high interest rate environment before interest rates rose could gracefully avoid companies with a problematic capital structure. At the same time, calculating the interest coverage ratio under stress scenarios can also help in the context of a potential rating downgrade, which is usually associated with an increase in the company's cost of capital. In this article , I have explained a simple approach to performing such calculations that can be easily implemented in Excel or a similar spreadsheet program.
A Few Final Words Of Caution
The interest coverage ratio and the debt to free cash flow ratio are the two ratios I use most often when evaluating a company's debt. They require a little work, but they provide a very transparent and easy-to-understand view of the situation. Debt due diligence doesn't end there, however, and I'd like to end the article with two final words of caution.
Operating leases have historically not been recognized on the balance sheet. However, leases can be significant, especially for retailers, and the associated contractual payments can become problematic in an economic downturn or when company-specific issues arise. Beginning in 2019, operating leases must be recognized on the balance sheet ( ASC 842 and IFRS 16 ), so it has become more difficult to overlook this item. There are several ways to account for operating leases. I personally account for them by calculating a modified version of the debt to free cash flow ratio. In this context, it is important to only compare members of a representative peer group.
Second, pension-related obligations may also be considered more or less sensitive to interest rates. In particular, "old economy" companies with rather conventional compensation models may have significant unfunded pension-related obligations on their balance sheets. I discussed Lockheed Martin Corporation's ( LMT ) pension obligations in another article , noting positively that the company has transferred a significant portion of the obligations to retirement services companies such as Athene Holding Ltd. ( ATH.PB , ATH.PC , ATH.PD ), thereby taking pressure off its own balance sheet.
Conclusion
The article provided an overview of several more or less common ratios that can be used to assess a company's leverage.
Ratios such as debt to assets (debt to capital) or debt to equity, with all their nuances, are easy to determine and can provide an initial indication of a company's vulnerability in an economic downturn or point to inefficiencies due to inappropriate use of debt. However, because they are static ratios, they provide only a very limited picture, so it is important to review the evolution of these ratios over several years. The debt to equity ratio is very easy to obtain, as the asset side of the balance sheet can be ignored. However, this puts the analyst at risk of overlooking assets that are susceptible to write-downs, which directly impact equity and, therefore, loss absorption capacity. The asset side of the balance sheet should be critically examined, and this is particularly true for banks or companies with a high proportion of goodwill and other intangible assets.
However, as the example of Philip Morris International and The Southern Company has shown, these ratios can produce misleading results. In the first case, investors may be unjustifiably alarmed, while in the second case, a potential deterioration in the company's fundamentals may be overlooked.
Dynamic metrics such as debt to EBITDA or debt to free cash flow provide better insight into the situation. However, since EBITDA is not a true earnings metric (all companies have to pay taxes, make regular investments, and pay more or less interest), investors should be cautious when comparing debt to EBITDA. Nevertheless, this ratio is important in the context of debt covenants and should therefore be reviewed on a regular basis, especially for cyclical companies and/or companies at risk of short-term liquidity issues. Debt covenants also often directly impact a company's ability to pay dividends.
My favorite metrics are the debt to free cash flow ratio and the interest coverage ratio. Using actual cash earnings instead of reported earnings elegantly avoids several pitfalls and can provide a fairly transparent view of a company's debt servicing ability. Consideration of the debt maturity profile allows identification of a potential near-term increase in interest expense, and proper analysis of free cash flow volatility (particularly in terms of working capital movements) allows an informed conclusion about a company's debt servicing ability in any economic climate.
However, debt due diligence does not end with an examination of a company's interest-bearing debt. It is important to also consider more or less sector-specific obligations such as operating leases and pension obligations. Analysis should always be limited to a specific peer group. It makes no sense to compare the leverage of a retailer with high operating leases with that of a company with low assets such as a tobacco company or an asset manager. Similarly, it makes no sense to lament the high leverage of bank balance sheets and compare them to those of non-financial companies.
Finally, it is important to always compare debt and interest expense to balance sheet or earnings ratios. It makes no sense to avoid a company because of its seemingly high debt in absolute terms. At times, news outlets indulge in sensational reports that a company has racked up tens of billions of dollars in debt, without putting the number into proper perspective.
Also, investors need to be careful when comparing debt metrics from different data providers. There are a number of definitions, and it is important to know what actually went into the calculation. Sometimes data providers' calculations are opaque, or the necessary information is difficult to obtain.
As always, please consider this article only as a first step in your own due diligence. Thank you for taking the time to read my latest article. Whether you agree or disagree with my conclusions, I always welcome your opinion and feedback in the comments below. And if there is anything I should improve or expand on in future articles, drop me a line as well.
For further details see:
Debt Metrics: How To Interpret Them And When They Matter