NKE - Deckers' $7.4 Billion Valuation: Downside Risk Ahead
Summary
- Estimated intrinsic value of Deckers to be $7.4b or $278 per share, some 30% overvalued.
- Growth is reliant on the uptake of the direct-to-consumer stores, with no significant reinvestment.
- We find it hard to believe that inventory is growing as a way to hedge inflation and expect products to be sold at discount in the future.
- The company may become an attractive investment if the price corrects around $305 per share.
We find Deckers Outdoor Corporation ( DECK ) to be a great footwear stock, which is flying under the radar of retail investors. The company has high short-term risk, and we expect a decline in market value.
However, the company itself is a buy in the event of a correction, and investors may want to put it on their radar with a continuous investment strategy in mind, instead of a buy-and-hold approach at this point.
The most attractive aspect of the business is the regular free cash flows and buybacks, which can serve to increase the price per share of the stock while the value sustains current intrinsic levels.
Our estimated value for Deckers (Author image with data from FMP)
We estimate the intrinsic value of Deckers to be $7.4b or $278 per share, with a 1-year price target of $305. The stock seems to be 31% overvalued and has a 16% downside based on our price target. You can view our full valuation model in the linked spreadsheet , as well as tweak the inputs.
While we consider the stock to be a sell at current price levels, we find the company to be a good investment if investors get a chance to buy around its intrinsic value.
In the analysis below, we will attempt to justify our valuation for the company and present a viable investment strategy.
Business Value Proposition
Deckers is a global footwear retailer, that distributes its products across multiple brands:
-
Premium footwear, apparel, and accessories under UGG
-
Sandals, shoes, and boots under Teva
-
Casual shoes and sandals under Sanuk
-
Athlete footwear under Hoka
-
Fashion casual footwear under Koolaburra
We can see the product portfolio target distribution in the image below:
Deckers' product portfolio (Investor presentation)
As of March 2022, it had 149 retail stores, including 75 concept stores and 74 outlet stores worldwide.
Deckers sells their products mostly wholesale (73%) and directly to consumers ((DTC)). The DTC channel is growing at 35.3%, which is faster than the 16.7% wholesale growth rate. Investors are expecting the DTC channel to advance, which can enable the company to gain in future margins.
Outlook
In the next 12 months, the company expects :
-
Net sales to be around $3.50b.
-
Gross margin to be approximately 50.5%.
-
Operating margin to be in the range of 17.5% to 18.0%.
In order to evaluate the business, we will start top-down from the industry expectations and see how that reflects in the future of Deckers.
A Cyclical and Growing Industry
According to Statista , in 2020, the global footwear market was estimated to be worth $365.5b and is forecast to reach $530.3b by 2027, implying a CAGR of 5.46%. A second source, Grand View Research , values the 2022 footwear market at $387.74b, with an estimated growth to $543.9b in 2030. This estimate implies a CAGR of 4.3%.
If the estimates are reliable and the company grows in line with the industry expansion, a CAGR of 4.3% to 5.5% should be the baseline of revenue growth, anything above this can be attributed as a gain in market share.
Competitor Analysis
We use competitors' fundamentals in order to see how well Deckers ranks among key peers. For our comparison, we chose:
Deckers is closest to Skechers with its product line, as both companies sell sports footwear. While it attempts to sell a premium line, Deckers has lower-tier brands relative to Nike, which targets a more premium base. Looking at the market cap, Deckers seems to be a leader within its quality and pricing tier, which may indicate that the stock is overvalued on a relative basis.
The table below shows us the fundamentals between peers:
Deckers vs peers fundamental comparison (Author image with data from FMP)
The key peer lineup indicates that Deckers is trading above its standard tier peers and below the premium tier competitor, Nike. The company may not justify the high EV/EBIT distance from its segment class as the profitability fundamentals are decreasing in quality (y-axis).
Deckers vs peers fundamental lineup (Author image with data from FMP)
For example, just with this line-up alone, we can see that Crocs may justify a higher premium.
Next, we will drill down on the company fundamentals and see where can we place our future expectations.
Organic Growth Deceleration
Deckers grew 19% in the last 12 months, significantly higher than the 5-year CAGR of 13.4%. This indicates to investors that the company has sustained growth momentum and is part of the reason why the stock has kept high levels.
Deckers' trailing 12-month revenue growth rate vs core CPI (Author image with data from FMP)
Looking at the balance sheet indicates that this momentum may be at risk from high inventory levels, which shot up 46% to a record $925m in the last 12 months from $636m in the previous year. Accounts receivable have only increased by 13%, which means that the company is holding excess products and may need to sell them at a discount. In the latest earnings call, management noted that inventory growth will outpace sales in order to hedge against inflation.
However, we have doubts that this is a strategic decision, as inflation is showing signs of stabilization and the jump in inventory mostly happened in the latest two quarters. The more likely scenario is that management is attempting to fit a post-hoc rationalization for the declining uptake.
Profitability
Management also pointed out that currency headwinds are expected to impact the gross margin by around 1.5%. However, we find that the COGS scaling explains the drop in gross margins better than FX impacts.
Unfortunately, examining the growth of costs along with revenue indicates that costs have grown 10% faster than revenues. This means that the latest 12-month revenue growth will not convert to profitability and gross margins will be pressured, which is what we see in the chart below:
Deckers' profit margins in the last 7 years (Author image with data from FMP)
The gross margin has slipped 7.5% from a year ago and is now 49.7%. Consequently, both EBIT and net margins have declined by 18.2% and 14.3%, respectively. While consumer spending is expected to be troubled in 2023, the company has a reasonable possibility to drive EBIT margins back up to 18% in the future, which is made part of our valuation assumptions.
The Connection Between Reinvestment and Growth
The company will have issues growing as it is not reinvesting more than it is depreciating, i.e., the net reinvestment is negative and all the capex goes towards capital maintenance.
Net CapEx is $2.1 m, while the change in working capital is -$18.2m, leaving a total reinvestment of -$16.1m. If we go down the fundamental table , we can see that the company has been holding back on reinvestment since FY 2016. This has caused a more efficient allocation of capital - which is great for investors, but it is hard to see how the business can grow in real terms beyond this point with no new reinvestment.
In that regard, we cannot expect more long-term growth than the inflation-adjusted industry growth rate, which should be between 4% to 10% - i.e., 4% from inflation, plus the expected 4% industry CAGR.
Disciplined Returns
However, this doesn't mean that the business should grow, in fact, investors may be much better off getting capital returns in the form of buybacks, instead of overextending the product line in markets with low uptake.
To that end, we can see that one of the reasons why Deckers is a great company is their history of buybacks, which increases the per share returns to investors. The company has returned $311.7m in the last 12 months, up from $244.7m in the year before that. This represents a 3.76% payout, which is great.
Valuation
Given our analysis, we can construct a grounded valuation for Deckers. Here are our estimated future drivers for the company:
-
Revenue CAGR of 7.5% in the next 5 years, with a decay function converging to the current risk-free rate of 4.1% at year 10. We assume that the company will grow in line with the industry growth on top of inflation while organic growth will be driven by DTC.
-
Slightly improved EBIT margins at 18% in the next 3 years. We assume that margins will recover and cycle around this level.
-
Efficient capital reinvestment rate of 2% to 3% of forward revenues. The company will need to reinvest more than it depreciates, and we assume that management will take that route.
-
Discount rate of 9.6%. Based on a risk-free rate of 4.1% plus a risk-adjusted enterprise risk premium of 5.5%. We are neutral on rates and try to estimate how marginal investors view risk in a company.
The chart below shows how we expect the company to perform in the future according to our parameters:
Our future estimate model for Deckers (Author image with data from FMP)
The final model indicates that the company is about 30% overvalued, and investors may be buying significantly more risk than the expected returns of the free cash flows.
Here is a table of the FCFF model shown above, you can also view it in the spreadsheet :
FCFF valuation model for Deckers (Author image with data from FMP)
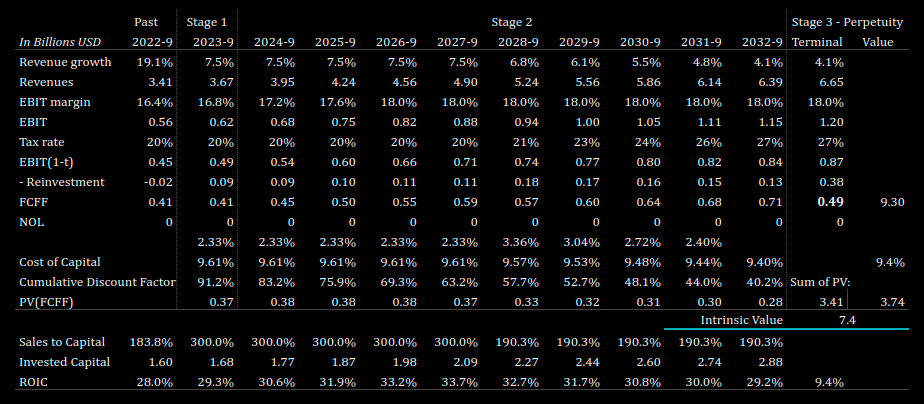
At this price point ($363), investors seem to be paying around a 2-year premium for the company, given the $7.4b valuation.
Valuation result details: Estimated value per share of $278, with a price target at 305, representing a 1-year downside of 16%.
Risks
Finally, we need to incorporate the major risk factors for our valuation:
-
Deckers is closely tied to supply chain risks with Asia, reliant on shipping container costs and the stability of the Asian region.
-
The products are reliant on U.S./China relations, which currently seem to be escalating.
-
Inventory levels may experience a marked-down sell-off, which can impact future profit margins.
-
Growth is driven by inflation and the DTC channel, which may be slow to integrate if the online store falls behind on technology and if the company fails to maintain partnerships with other DTC sellers.
-
The expectation of future growth is inconsistent with the negative net reinvestment from the company, so investors need to look for increased CapEx if they see revenue growth as a value driver.
Investment Approach
The current price level doesn't seem to be justified by the fundamentals, so we expect a continuous investment strategy, starting at a price point around $305 to be superior for investors.
Investors that have already invested in the company and have more than a 16% gain may want to consider selling the excess risk.
These investment approaches do not consider investors' tax liability and assume a diversified portfolio. If you are a long-term investor, you might be better off holding through possible volatility.
For further details see:
Deckers' $7.4 Billion Valuation: Downside Risk Ahead