PRDO - DEEP: Value ETF Outperforming Its Peers In 2023 But Hardly Attractive
2023-08-23 11:32:24 ET
Summary
- Roundhill Acquirers Deep Value ETF selects 100 small cap stocks with a wide discount to valuation.
- The fund was launched in 2014, and reshuffled in June 2020.
- Valuation and quality metrics are very good, but it holds 22% of risky stocks regarding my criteria.
- Sub-par performance since 2020, management fee, turnover, liquidity and AUM don't make it very attractive.
This article series aims at evaluating ETFs (Exchanged Traded Funds) regarding the past performance of their strategies and the quality of their portfolios. As holdings and weights change over time, updated reviews are posted when necessary.
DEEP strategy and portfolio
Roundhill Acquirers Deep Value ETF ( DEEP ) started investing operations as an open ended investment company on 9/23/2014 under the ticker DVP. The fund changed tickers on 06/22/2020 and it has been tracking the Acquirers Deep Value Index since then. It has 100 holdings, a 12-month distribution yield of 1.5% and a total expense ratio of 0.80%.
The fund’s assets under management (“AUM”) are only about $38M. As a rule of thumb, an ETF with AUM staying too long below $50M is at risk to be delisted and redeemed. In this case, the high management fee may be a good thing, because it increases the chance of survival. Trading volume is also very low, with a daily average of 4.3K shares and $145K.
As described in the prospectus by Roundhill Investments , the underlying index “ tracks the performance of a portfolio of 100 of the most undervalued, fundamentally strong stocks drawn from the smallest 75% of stocks listed in the United States by market capitalization meeting certain liquidity thresholds ”. Stocks belonging to the universe are selected in four steps. First, they are ranked based on assets, earnings, and cash flows. Then, they are filtered with statistical measures of fraud, earnings manipulation, and financial distress. The set of eligible stocks at this stage is reduced to companies showing a wide discount to valuation, a strong balance sheet, and a robust business generating free cash flow. In a last step, a forensic accounting due diligence review is performed “in accordance with the Index methodology”. Constituents are equal-weighted at each quarterly reconstitution. According to Fidelity, about 95% of asset value is in micro-cap companies. The portfolio has a high turnover rate: 119% in the most recent fiscal year. In a stock universe with limited liquidity, it may be a significant drag to the performance.
In this article, I will take the S&P Small-Cap 600 Value Index as a benchmark, represented by iShares S&P Small-Cap 600 Value ETF ( IJS ). DEEP is significantly cheaper than IJS regarding aggregate valuation ratios, as reported in the next table.
| DEEP |
| IJS |
| Price/Earnings TTM |
| 6.88 |
| 12.77 |
| Price/Book |
| 1.28 |
| 1.36 |
| Price/Sales |
| 0.56 |
| 0.7 |
| Price/Cash Flow |
| 3.69 |
| 7.4 |
Source: Fidelity
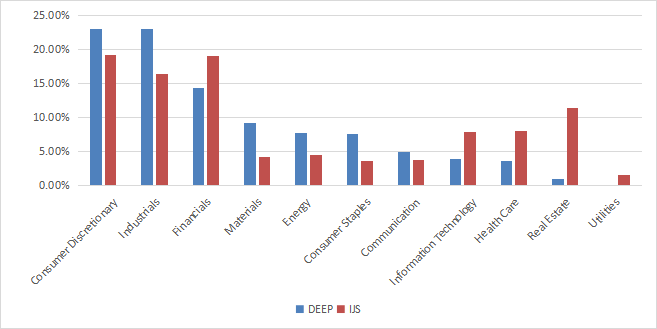
The heaviest sectors are consumer discretionary and industrials (each at 23.1% of asset value), followed by financials (14.3%). Other sectors are below 10%. Compared to the S&P Small-Cap 600 Value Index, DEEP significantly overweights consumer discretionary, industrials, materials, energy and consumer staples. It underweights mostly real estate, healthcare, technology, and ignores utilities.
Sector breakdown (chart: author; data: Roundhill Investments, Fidelity, iShares)
DEEP currently holds 99 stocks. Positions are reset in equal weight at every reconstitution. As of writing, weights have drifted between 0.66% and 1.47%. Risks related to individual companies stay low. The top 10 holdings, listed in the next table with valuation ratios, represent 12.8% of asset value. These are the constituents with the highest momentum since the last rebalancing
| Ticker |
| Name |
| Weight |
| P/E ttm |
| P/E fwd |
| P/Sales |
| P/Book |
| P/FCF |
| Yield% |
| WW International, Inc. |
| 1.47% |
| N/A |
| N/A |
| 0.83 |
| N/A |
| N/A |
| 0 |
| Natural Resource Partners L.P. |
| 1.38% |
| 5.50 |
| N/A |
| 3.46 |
| 2.20 |
| 5.27 |
| 4.52 |
| Veritiv Corp. |
| 1.35% |
| 7.58 |
| 8.31 |
| 0.36 |
| 2.61 |
| 7.36 |
| 1.50 |
| Vital Energy, Inc. |
| 1.34% |
| 1.15 |
| 3.15 |
| 0.70 |
| 0.65 |
| N/A |
| 0 |
| Perdoceo Education Corp. |
| 1.27% |
| 8.67 |
| 8.39 |
| 1.52 |
| 1.39 |
| 7.35 |
| 2.73 |
| Herbalife Ltd. |
| 1.24% |
| 6.84 |
| 6.28 |
| 0.31 |
| N/A |
| 9.93 |
| 0 |
| Euroseas Ltd. |
| 1.22% |
| 1.77 |
| 1.83 |
| 1.01 |
| 0.83 |
| N/A |
| 7.73 |
| Global Industrial Co. |
| 1.19% |
| 18.21 |
| 17.50 |
| 1.08 |
| 5.38 |
| 15.22 |
| 2.45 |
| M/I Homes, Inc. |
| 1.17% |
| 5.43 |
| 5.49 |
| 0.63 |
| 1.15 |
| 5.16 |
| 0 |
| Interface, Inc. |
| 1.17% |
| 145.31 |
| 11.18 |
| 0.45 |
| 1.50 |
| 7.14 |
| 0.40 |
Ratios: Portfolio123
Historical performance
The fund started investing operations in 2014, but the underlying index changed in June 2020. Historical data prior to the reshuffling are irrelevant to the current strategy. It also means that any backtest including DEEP before 6/22/2020 may be misleading.
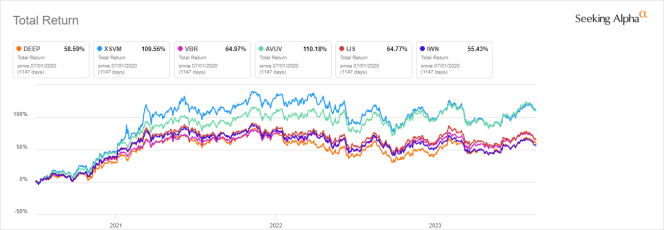
The next chart compares total returns since 7/1/2020 of DEEP, IJS and four other small-cap value funds:
- Invesco S&P SmallCap Value with Momentum ETF ( XSVM ), reviewed here ,
- iShares Russell 2000 Value ETF ( IWN ), reviewed here ,
- Vanguard Small-Cap Value ETF ( VBR ),
- Avantis U.S. Small Cap Value ETF ( AVUV ).
DEEP is the second worst performer after IWN, by a short margin. AVUV and XSVM are leading the pack.
DEEP vs competitors since July 2020 (Seeking Alpha)
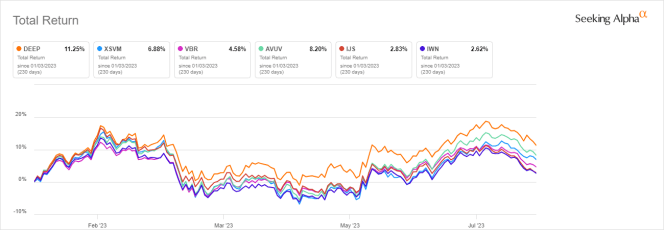
However, DEEP is the best performer in 2023 to date (see next chart).
DEEP vs competitors, year-to-date (Seeking Alpha)
Portfolio Quality
In my ETF reviews, risky holdings are companies with at least two red flags among: negative ROA (return-on-assets), bad Piotroski F-score, bad Altman Z-score and unsustainable payout ratio, excluding financials and real estate, where these metrics are unreliable. Based on this assumption, risky stocks weigh 22.6% of the portfolio. I consider any number above 15% indicates a risky portfolio.
However, the aggregate Altman Z-score, Piotroski F-score and ROA are significantly better than for the small cap benchmark S&P 600 (my calculations are reported in next table).
| DEEP |
| S&P 600 |
| Altman Z-score |
| 3.31 |
| 2.84 |
| Piotroski F-score |
| 5.39 |
| 5.35 |
| ROA % TTM |
| 6.88 |
| 3.87 |
My quality scan is mixed: aggregate metrics point to a quality level superior to the small cap benchmark, but over 20% of the portfolio is in risky stocks.
Takeaway
Roundhill Acquirers Deep Value ETF holds 100 small cap stocks with a wide discount to valuation. Selection rules include metrics to detect fraud, earnings manipulation, and financial distress. The fund was launched in 2014, but data before June 2020 are irrelevant to assess the current strategy. The portfolio is heavy in consumer discretionary and industrials, but it is well-diversified across sectors and holdings. Valuation and quality metrics look attractive relative to a small cap benchmark. However, DEEP holds a lot of risky stocks regarding my criteria. Performance since July 2020 is underwhelming relative to competitors, but DEEP has outperformed in 2023. Finally, sub-par performance, high management fee, high turnover, weak liquidity and thin AUM don't make it very attractive.
For further details see:
DEEP: Value ETF Outperforming Its Peers In 2023, But Hardly Attractive