DEN - Denbury: A Deep Dive Into Financial Metrics Liquidity Concerns And Investment Potential
2023-10-16 02:31:03 ET
Summary
- Denbury Inc.'s balance sheet shows growth in total assets and stockholders' equity, but also a significant increase in long-term debt and deferred tax liabilities.
- The company's focus on carbon capture technologies and sustainability aligns with the increasing demand for reducing emissions.
- However, Denbury's heavy reliance on oil prices and declining net income pose risks for investors, making a cautious "Hold" stance advisable.
- The company is trading at a low P/E ratio relative to near-term earnings growth.
Investment Thesis
Investing in Denbury ( DEN ) presents a landscape of promise and peril. On one hand, the company specializes in the carbon capture and storage sector, aligning with global sustainability goals. This focus is substantiated by a 2% increase in CO2 sourced from industrial means in H1 2023, as well as a $48.1 million investment in Carbon Capture, Utilization, and Storage (CCUS) assets. Additionally, the company's merger with ExxonMobil, valued at $4.9 billion, offers immediate financial heft and future growth prospects, particularly since Denbury owns the largest CO2 pipeline network in the U.S. On the other hand, Denbury's vulnerability lies in its heavy reliance on oil, which accounts for 97% of its sales revenue. This became apparent when its net income plunged from $155.5 million to $67.3 million within a year due to oil prices dropping from $109 to $74 per barrel, even though the price has rebounded to $91 as of October 14th, 2023. The company's balance sheet also shows a threefold increase in long-term debt to $85,153 thousand within just six months. Despite these financial red flags, the company's Net Operating Profit After Taxes (NOPAT) has grown from a negative $112 million in 2021 to a positive $494 million in 2023. Therefore, for investors bullish on carbon capture technology and willing to absorb market volatility tied to oil prices, Denbury offers a high-risk, high-reward proposition.
My investment recommendation at this juncture would be to Hold . This stance allows investors to wait and see how the ExxonMobil merger and the company's sustainability initiatives unfold, while also providing time to assess if Denbury can strengthen its financial standing.
Overview
Denbury is an energy company specializing in a unique niche; they utilize carbon dioxide to enhance oil recovery and are active players in the carbon capture and storage industry. This environmental focus aligns with their ambitious goal of achieving Net Zero emissions within the next decade. Their commitment to sustainability is also evidenced by the increase in CO2 sourced from industrial means, which went from 39% to 41% in the first half of 2023. However, it's important to note that their financial health is closely tied to the oil market; a staggering 97% of their sales revenue comes from oil . This dependency manifested when their net income fell dramatically from $155.5 million to $67.3 million in just a year due to dropping oil prices. The company's oil and natural gas revenues have also decreased by $149.0 million, or 33%, in the same quarter.
Denbury has made notable business moves, such as investing heavily in a project named Cedar Creek Anticline Enhanced Oil Recovery and other carbon capture technologies. Furthermore, they've secured a merger agreement with Exxon Mobil , set to finalize in the fourth quarter of 2023. This deal values Denbury at about $4.9 billion.
Denbury's initial valuation was $89.45 per share, which was later adjusted to $84.79. For each Denbury share, Exxon Mobil is offering 0.84 of its own shares. This comes with a 1.9% premium over Denbury's share price as of July 12th 2023. Adding to this, Exxon Mobil has a dividend policy that gives out a quarterly dividend of $0.91 per share, something Denbury shareholders can look forward to post-acquisition. Denbury owns and operates the largest CO2 pipeline network in the U.S., which could significantly bolster Exxon Mobil's Low Carbon Solutions business. Additionally, Denbury's current production sits at around 47,000 BOEPD, of which 97% is oil, offering immediate value to Exxon Mobil's operations.
There are several red flags to consider as well, like the significant drop in net income and revenues, and an excessive reliance on oil sales, which make up 97% of the company’s sales volumes. Also, it’s crucial to note that oil prices plummeted from $109 per barrel to $74 per barrel, adding another layer of vulnerability. However, the oil price has increased to $91 as of October 14th, 2023. This increase in oil prices will augur well for the company. On the upside, the company shows a 41% industrial sourcing of CO and holds considerable expertise in EOR techniques, which could add long-term value. Despite the falling market conditions, the company has invested $48.1 million in Carbon Capture, Utilization, and Storage (CCUS) assets, suggesting proactive management focused on long-term sustainability.
So, what does all this mean for potential investors? In the long term, Denbury shows promise due to its focus on carbon capture technologies, making it an attractive option in a world increasingly aware of the importance of reducing emissions. However, the company's heavy reliance on oil prices poses a significant risk, as demonstrated by its drastic net income reduction when oil prices plummeted.
If you're keen on environmentally conscious investments and are willing to weather some market volatility, Denbury could be worth considering. Regulatory changes in environmental laws could also pose a threat to Denbury's specialized business model, so that's another factor to keep in mind.
Based on the data, holding onto the company's stock seems to be the most reasonable action. While the company is making efforts to diversify into sustainable technologies, it has experienced a sharp decline in revenues and remains highly susceptible to fluctuating oil prices. The reasoning behind this decision is primarily deductive, in that the drop in net income and revenue suggests unfavorable investment conditions. It's also partly inductive, as the company's investments in new technologies indicate a focus on future sustainability.
Revenue Analysis
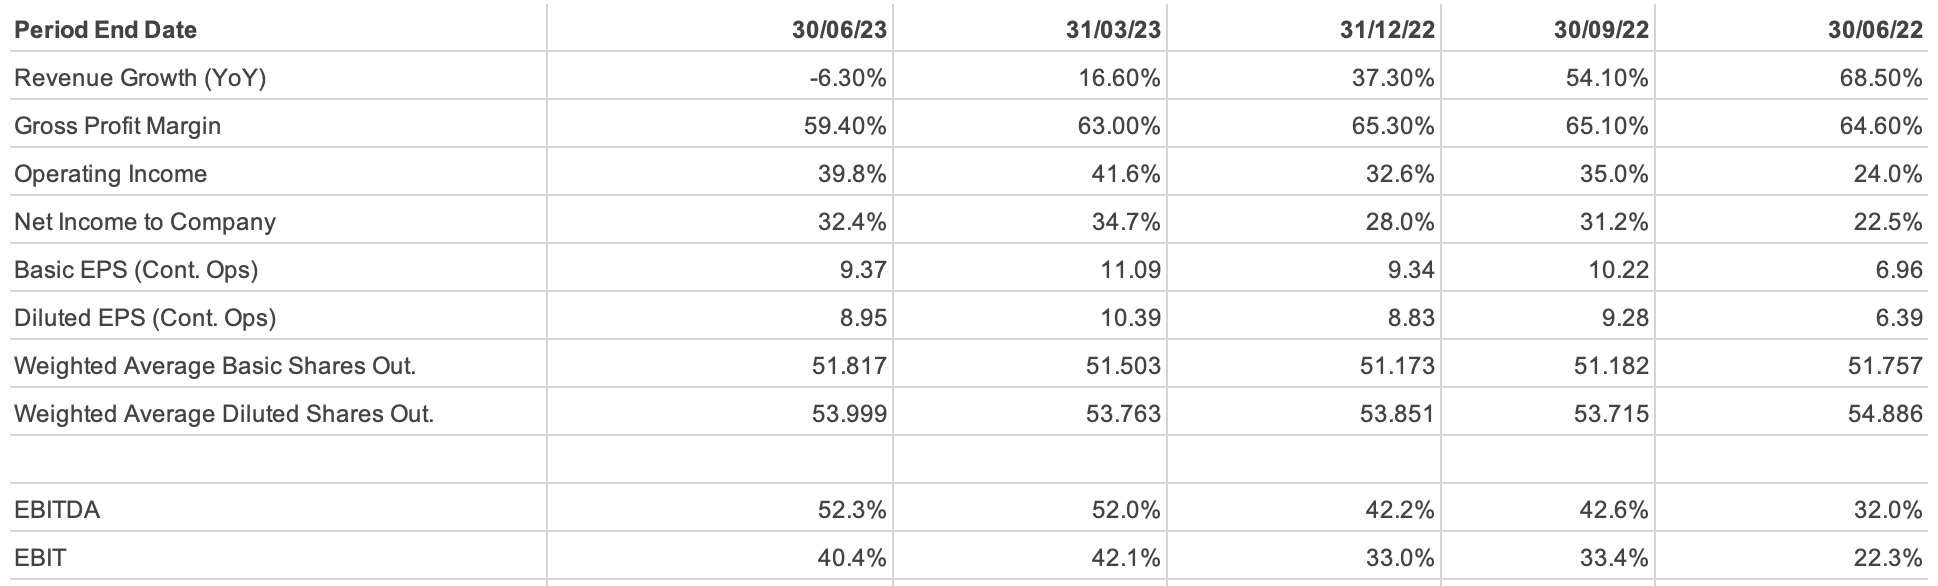
In Q2 2023, the company saw a sharp decline in net income, which plummeted from $155.5 million in Q2 2022 to $67.3 million in the same quarter this year. Although the net income over the past six months shows marginal stability—increasing slightly from $154.6 million in 2022 to $156.5 million in 2023—the drop in quarterly net income can't be ignored. Similarly, both basic and diluted earnings per share have seen a decline—from $3.00 to $1.30 and $2.83 to $1.25, respectively. This indicates the company is generating less income per share, signaling caution to investors.
The company's oil and natural gas sales have experienced a significant dip. Oil sales fell from $446.6 million in Q2 2022 to $301.5 million in Q2 2023. Natural gas sales also took a hit, dropping from $5.4 million to $1.4 million. The overall sales revenue in these segments shrunk from $451.9 million to $302.9 million. Carbon Oxide (CO) sales declined from $12.6 million to $11.2 million over the same period, but this is a comparatively steady source of income.
When it comes to expenditures, lease operating expenses rose modestly from $124.4 million in Q2 2022 to $130.3 million in Q2 2023. On the flip side, production and ad valorem taxes saw a decline from $35.6 million to $26.2 million, probably owing to reduced sales volumes.
In terms of financial health, there's been a slight decline in net cash from operating activities—from $149.9 million in Q2 2022 to $142.4 million in Q2 2023—which suggests reduced liquidity. Additionally, interest payments have decreased from $1.526 million to $0.825 million over the same period, potentially indicating a decline in short-term debt.
Interestingly, the company was smart in the handling of commodity derivatives. It had a positive receipt of $5.2 million, a stark contrast to last year's payment of $127.9 million. This could make the quality of earnings seem more stable than they might actually be.
Looking at the future, the company may face challenges if the oil and gas market conditions don't improve. Despite these challenges, the company seems to have control over its expenses and is making strides in CO sales as a diversification strategy. The primary red flags include the drastic fall in net income and heavy reliance on oil sales. However, the company has shown some resilience through effective handling of commodity derivatives and the steady contribution from CO sales.
In summary, while there are concerning aspects like decreased revenues and increased operational costs, there are also areas where the company is managing well. The next few years could be difficult if they don't diversify revenue streams or find ways to boost oil and gas sales. There are certainly red flags, but there are also promising signs in cost management and diversification efforts.
Given all these considerations, a cautious approach would be advisable, leaning towards a 'hold' or 'sell' investment strategy rather than a 'buy.'
Balance Sheet Analysis
Analysing Denbury Inc.'s balance sheet reveals subtle insights into its financial standing as of June 30, 2023, vis-à-vis its status on December 31, 2022. The company’s total assets rose to $2,541,619 thousand from a previous $2,327,499 thousand, largely fueled by a hike in net property and equipment, which escalated from $1,931,685 thousand to $2,125,343 thousand. Drilling down further, I see the proved properties category within these assets surged significantly from $1,414,779 thousand to $1,751,158 thousand. On the flip side, the unevaluated properties shrank, hinting at possible asset sales or reclassifications.
Coming to liabilities, the company reported a decrease in total current liabilities from $346,862 thousand to $296,726 thousand, which is generally a favorable sign. However, this optimism is dampened by an almost threefold increase in long-term debt, which jumped from $29,000 thousand to $85,153 thousand, and a sharp hike in deferred tax liabilities from $71,120 thousand to $118,171 thousand. These growing long-term obligations could signal financial stress down the line.
On the brighter side, stockholders' equity saw an upward trend, increasing from $1,532,617 thousand to $1,700,153 thousand, led primarily by an increase in retained earnings from $485,504 thousand to $641,984 thousand. This indicates that the company is holding onto a larger chunk of its profits.
Now, let's talk about red flags. The first is the almost threefold increase in long-term debt to $85,153 thousand within just six months. Additionally, deferred tax liabilities also saw a significant leap from $71,120 thousand to $118,171 thousand. These spikes can't be ignored and warrant a closer look.
Turning to projections, considering the current trajectory, it seems reasonable to anticipate a 5% to 10% growth in total assets for the coming year. However, the sharp rise in long-term debt could potentially spell financial stress down the line.
In terms of value drivers, the principal contributor appears to be the robust increase in proved properties. However, this positive is somewhat offset by the company's growing long-term debt, raising questions about the sustainability of its asset growth. Given this, the most crucial metric to watch is long-term debt, which has shown an alarming increase.
Financial health indicators like liquidity and solvency are a bit unstable. The company has current assets of $210,679 thousand but faces current liabilities of $296,726 thousand, revealing liquidity issues. The escalating long-term debt also places solvency into question. The debt structure has also become noticeably riskier due to this surge in long-term obligations.
Even with these developments, certain financial ratios warrant closer scrutiny. A possible decline in the Asset Turnover Ratio suggests that operational efficiency could be taking a hit, given the asset base has expanded without a corresponding growth in income.
Finally, in terms of earnings quality, the sizeable upswing in long-term debt and deferred tax liabilities casts doubt on the sustainability and reliability of earnings. This uncertainty is further accentuated by volatile figures like the dip in Q2 net income and the rise in derivative assets, which changed from being an expense to a form of income.
Based on what we know, especially the concerning rise in long-term debt and deferred tax liabilities, the investment recommendation would lean towards a 'Hold' status until more clarity is available. This is substantiated by the fact that future earnings could be negatively impacted by the rise in debt and other liabilities.
Free Cash Flow Analysis
Over the past three years, there's been a notable enhancement in the company's Net Working Capital (NWC). NWC has improved from a deficit of $279 million in 2021 to a deficit of only $81 million in 2023. This indicates that the company has been better in its management of short-term assets and obligations. Furthermore, cash generated from primary business activities, a reflection of the company's core operations, has surged from $224 million in 2021 to $512 million in 2023.
In terms of investing activities, there's been an increase in the company's Capital Expenditures (CapEx) from $108 million in 2021 to $485 million in 2023. This heightened CapEx can imply business expansion or operational efficiency initiatives.
The company's Net Operating Profit After Taxes (NOPAT) has increased from a negative $112 million in 2021 to a positive $494 million in 2023. This reflects an impressive operational profitability trend post-taxation and underscores an upward momentum.
A few trends and potential warning signs are also apparent. Despite the growing operational cash flows, the company's CapEx is concurrently increasing, which suggests substantial reinvestments. For these reinvestments to be justifiable, there should be a corresponding revenue or profit boost. Moreover, the levered free cash flow has been shrinking yearly — from $116 million in 2021 to $27 million in 2023, raising potential concerns. This decrease is even more perplexing when considering that the company's revenue grew between 2021 and 2022. Such a trend hints at high capital expenditures, which could be a cause for alarm. Projecting into the future, if these patterns persist, we might witness further improvement in NOPAT. Nevertheless, the levered free cash flow might continue its decline, primarily fueled by the growth of capital expenditures.
On the earnings quality front, a peak in revenue is observed in 2022 at $1,589 million, but there's a slight dip to $1,490 million in 2023. Interestingly, even with this revenue dip, NOPAT has significantly grown. This scenario suggests that despite a reduction in sales, the company might have optimized operational efficiency or cost management. However, the decreasing trend in levered free cash flow, even with a rising NOPAT, is worrisome. It hints at the company's potential challenges in turning profits into tangible cash, possibly due to factors like delayed payments or inventory accumulation.
Diving deeper into the value assessment, it's evident that the escalating NOPAT is bolstering the company's valuation. This rise attests to enhanced operational efficiency. The sustainability of this value driver, though, hinges on the company's prowess in counterbalancing escalating capital expenditures and perpetuating its revenue growth. Amidst these metrics, keeping an eye on the Levered Free Cash Flow is crucial. Its successive decline, juxtaposed against a growing NOPAT, could herald impending liquidity impediments.
Regarding financial health, the company's improving NWC advocates for enhanced liquidity. Yet, the waning levered free cash flow casts a shadow on long-term solvency.
Assessing management strategies, the NOPAT growth is a testament to the management's efficiency, especially in domains of operations stewardship. From a risk perspective, the declining levered free cash flow emerges as a formidable financial hazard warranting vigilant oversight.
To summarise, NOPAT is on an upswing, yet free cash flows are waning. Thus, a prudent strategy would be to adopt a "hold" position, waiting for the fog around cash flow to dissipate. It's imperative to ascertain that hefty reinvestments are producing equivalent returns and that the company's liquidity remains robust in the foreseeable future.
Cash Conversion Cycle
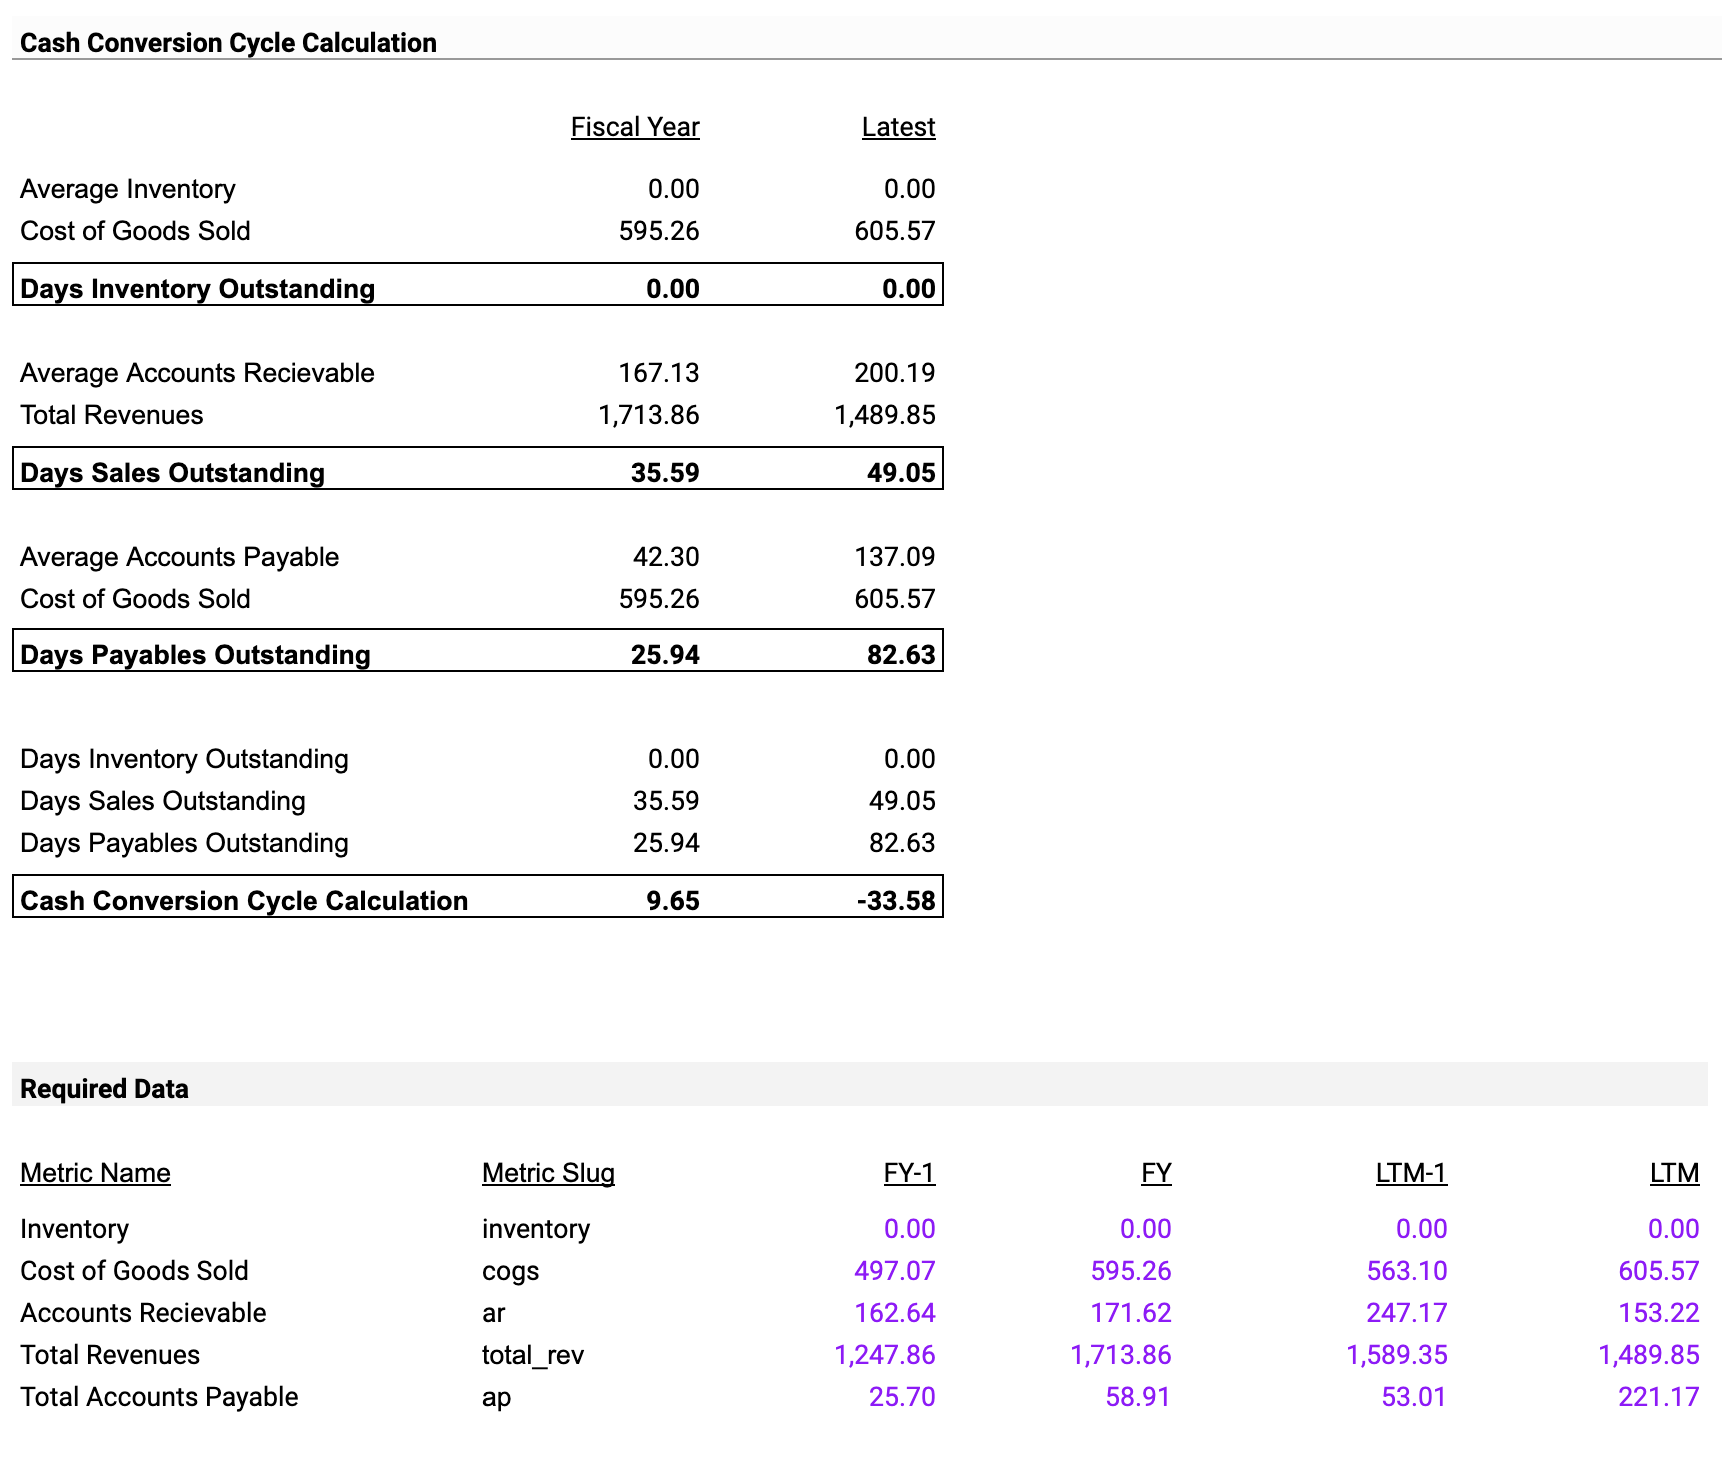
The company has experienced a growth in its revenues, from $1,489.85 million to $1,713.86 million, which translates to a jump of 224.01 or 15.03%. The rise in the Days Sales Outstanding (DSO) from 35.59 to 49.05 days could be a matter of concern. In contrast, the Days Payables Outstanding (DPO) witnessed a significant leap from 25.94 days to 82.63 days, indicating an extended period taken by the company to settle its dues with suppliers.
Projecting the future, based on the current revenue growth trend and the evolving patterns in DSO and DPO, one could anticipate sustained revenue growth. But a looming shadow of potential liquidity concerns emerges if the escalating DSO isn't addressed timely. As we delve into the Value Assessment, it becomes evident that the predominant driver bolstering the company's value is its impressive revenue growth. Yet, for this growth to be sustainable, the efficient administration of accounts receivable and payable can't be sidelined.
The Cash Conversion Cycle (CCC) underwent a change, moving from 9.65 days to an unexpected -33.58 days. This negative value suggests a scenario where the company is settling its supplier dues much after receiving payments from customers. While this might offer short-term advantages, it's laden with risks, especially if suppliers decide to enforce stricter payment norms. The upward trend in DPO might be hinting at a deliberate strategy by the management to delay supplier payments, possibly to conserve cash. Such a tactic could be beneficial momentarily but stretching it might strain supplier relationships. On the flip side, the growing DSO could be signaling potential hitches in amassing payments from clients, posing liquidity challenges if not rectified.
From an investment perspective, despite the encouraging revenue trajectory, the underlying risks tied to DSO and DPO metrics cast concerns. Hence, a balanced "hold" approach seems judicious until the financial landscape becomes clearer.
Shareholder Yield
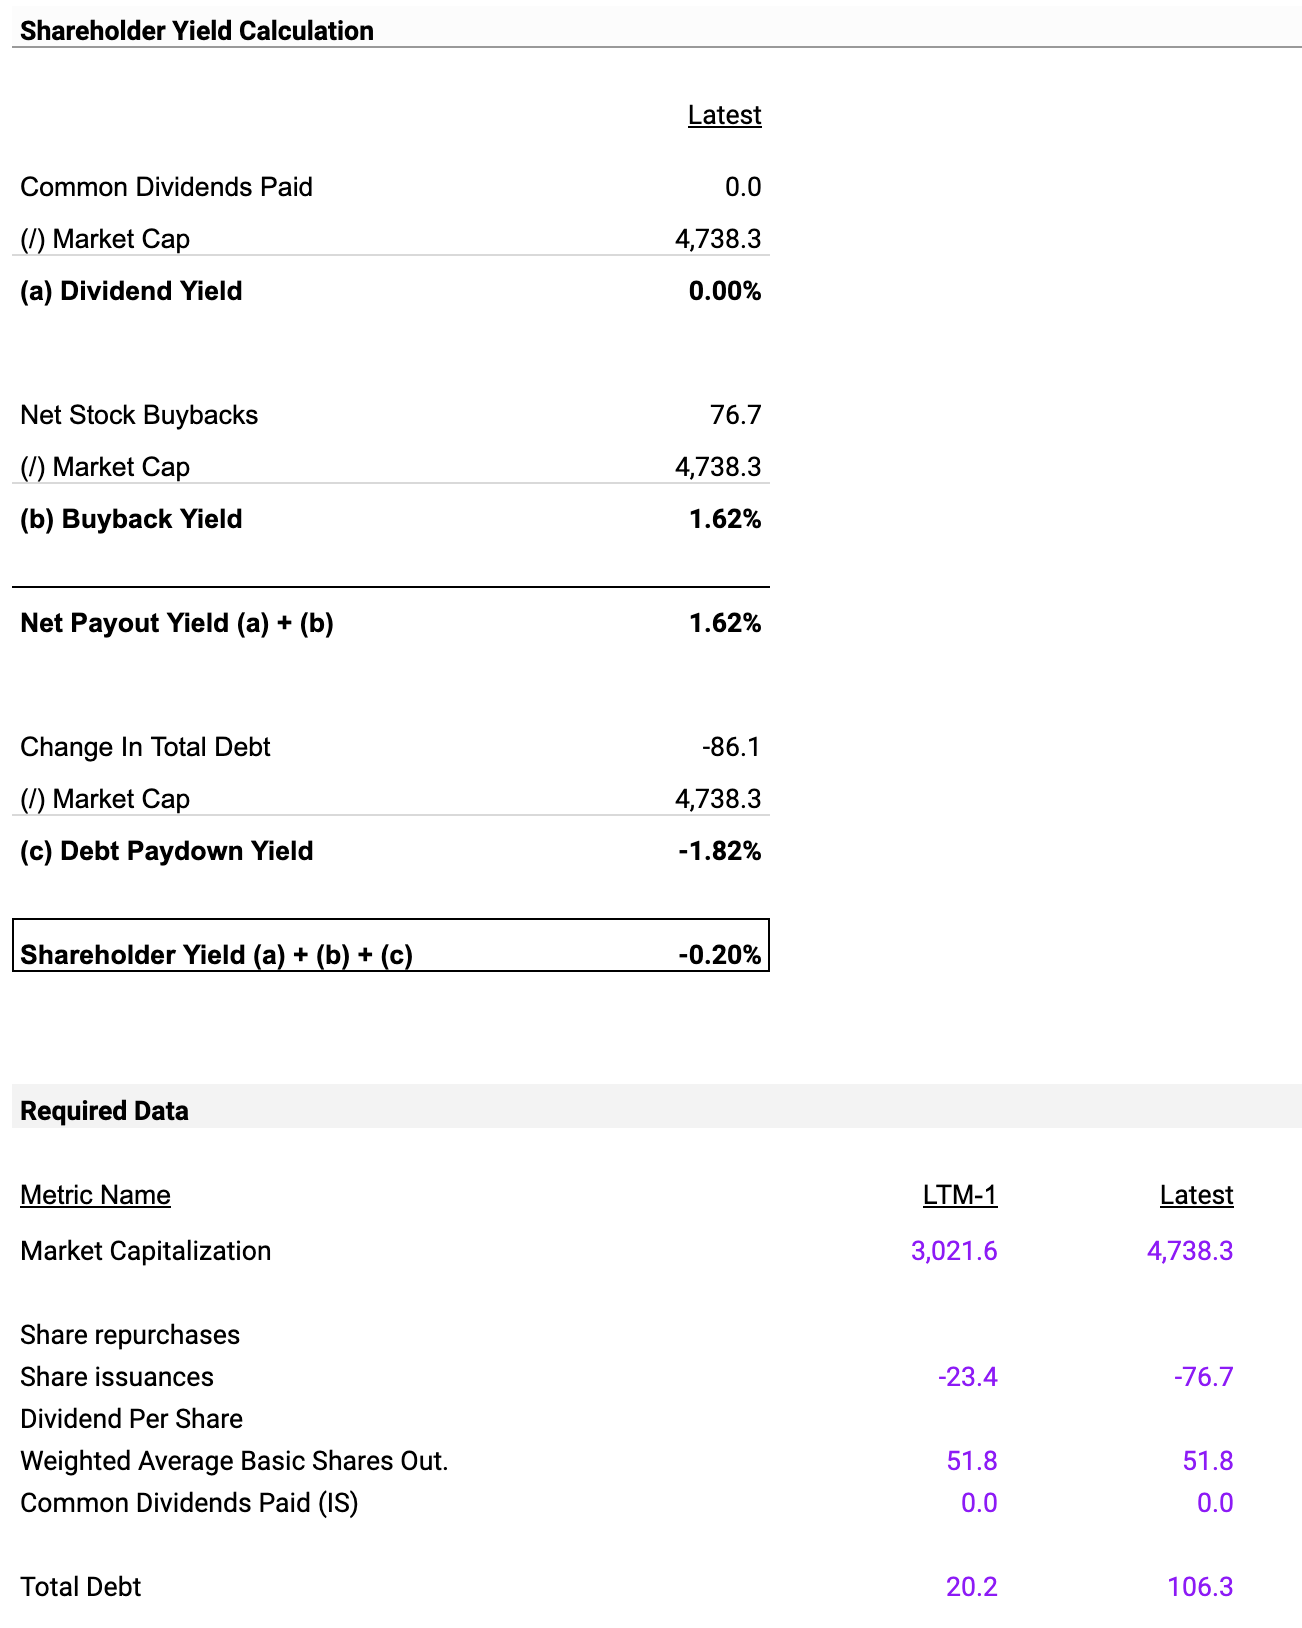
Starting with shareholder yield calculations, it's evident that the firm hasn't paid any dividends, showcasing a 0.00% dividend yield against a market cap of $4,738.3 million. However, it has executed net stock buybacks worth $76.7 million, resulting in a buyback yield of 1.62%. This means the company is utilizing some of its profits to repurchase shares, perhaps to boost earnings per share. The net payout yield, a combination of dividend and buyback yields, stands at 1.62%, revealing another medium through which the company is offering value to its shareholders.
On the debt side, the company reduced its total debt by $86.1 million, translating to a debt paydown yield of -1.82%. This is generally a positive sign as it improves the company's overall financial health by reducing liabilities. When summing up all these activities—dividends, buybacks, and debt paydown—the resulting shareholder yield is a negative -0.20%. This raises a red flag, suggesting that the firm's efforts, although aimed at strengthening the balance sheet, aren't enough to generate a positive return for shareholders.
Assumptions for a one-year forecast based on this data would infer that the company is likely to focus on further debt reduction and possibly more stock buybacks. Although these activities could lead to an improvement in its financial health, they may not translate to a positive shareholder yield in the near term. Key metrics to watch would be the debt paydown yield, as its improvement is critical for the company's future stability.
As for liquidity and solvency, the company's debt paydown indicates a trend toward better debt management, reducing financial risk.
The current data suggests that while the company is taking steps to reduce its debt—potentially making it less vulnerable to interest rate hikes—its negative shareholder yield remains a significant financial risk that could deter investors. Given these mixed indicators, a "hold" investment recommendation seems appropriate at the moment.
Overall, although the firm is not paying dividends and has a negative shareholder yield, its debt reduction efforts do indicate an improving capacity to manage its financial obligations, thereby signaling a cautious approach for potential investors.
Investment Recommendation
After analyzing various aspects of Denbury Inc.'s financial health, it's evident that the company is navigating risky waters. The net income plummeted from $155.5 million to $67.3 million, suggesting profitability issues. The basic and diluted earnings per share have followed a similar downtrend. While there's been some short-term stability in net income and gains from commodity derivatives, these upsides don't seem to balance out the downside risks. The situation is equally worrying when we consider the company's market position. Sales revenues in oil and natural gas took a severe hit, declining from $446.6 million to $301.5 million and $5.4 million to $1.4 million, respectively.
When it comes to the company's financial standing, both liquidity and solvency pose concerns for the future. Net cash from operating activities has seen a slight decline, which might hint at future liquidity challenges. Although interest payments have decreased, it's not a definitive sign of improved solvency, as it could merely indicate a reduction in short-term debt. On a more positive note, the management seems to have some level of control over expenses and has made some gains in commodity derivatives. However, the significant drop in net income raises questions about their effectiveness in dealing with broader challenges.
There are enough signs of stability and management efficiency to advise against a 'Sell,' but the decline in net income, coupled with liquidity issues, makes a 'Buy' too risky at this point. Therefore, a 'Hold' strategy is advisable for now. The focus should be on observing how Denbury Inc. performs over the next few quarters to decide whether it's wise to adjust the investment strategy.
For further details see:
Denbury: A Deep Dive Into Financial Metrics, Liquidity Concerns, And Investment Potential