XRAY - Dentsply Sirona: 8% Return On Capital Deployed Economic Losses Reiterate Hold Thesis
2023-08-22 17:59:36 ET
Summary
- DENTSPLY SIRONA Inc.'s latest numbers reinforce a hold thesis based on underlying economics and value drivers, in my view.
- Q2 FY'23 revenue growth was driven by the Aligners business and strength in Asia Pacific, particularly China.
- Capital budgeting and capital productivity are potential headwinds, with declining cash flows and low returns on capital employed.
- Net-net, reiterate hold.
Investment briefing
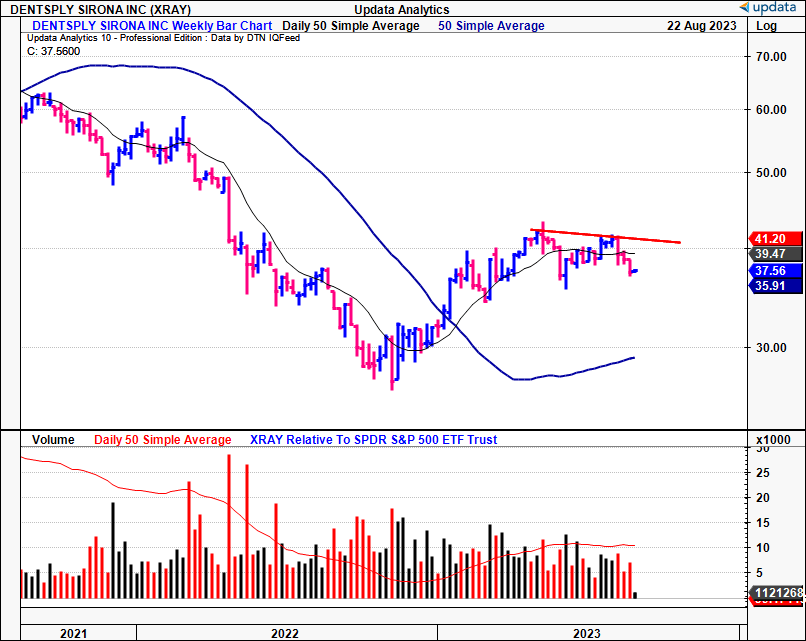
DENTSPLY SIRONA Inc. (XRAY) has failed to catch a bid since my June publication , re inforcing the hold thesis in my informed opinion. The company's Q2 FY'23 numbers do little to overthrow the neutral view based on the underlying economics and value drivers.
Traditional value strategies finance the acquisition of 'cheap' assets by selling more 'overvalued' assets, seeking to capture asymmetrical risk/reward profiles in doing so. However, my readers will know this channel employs capital productivity/profitability strategies, that exploit value in a different way. In contrast, the purchase of productive assets/securities is financed via selling—or at least holding off buying—unproductive companies.
This report will consolidate all the moving parts in the XRAY investment debate and link this back to the slack value creation it has produced for its shareholders over the last 3-years to date. Net-net, reiterate hold.
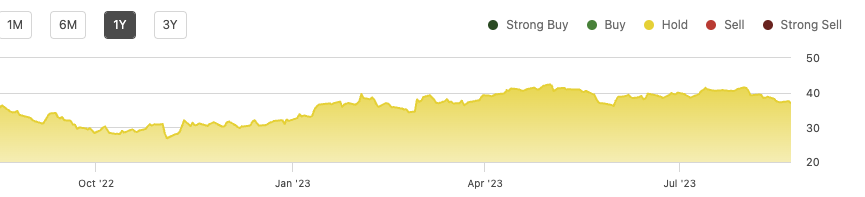
Figure 1.
Updates to critical investment findings
An informed appraisal of XRAY's prospects as an investment grade company follows. Critically, there are primary talking points from its latest set of numbers, along with questions on its ability to compound value for shareholders moving forward.
1. Q2 FY'23 insights
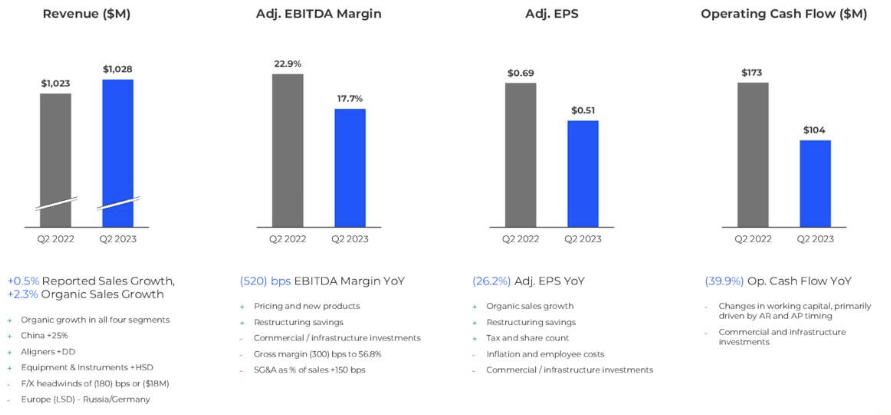
Starting with the firm's latest earnings, XRAY clipped Q2 revenue of $1.028Bn, 0.5% sales growth YoY. Forex had an $18mm headwind to the top line. This exceeded expectations due to shifts in the USD vs. the JPY and Russian ruble. Adjusting for all FX headwind, sales grew 230bps YoY. The growth was underscored by XRAY's Aligners business and widespread strength in Asia Pacific—particularly China—which experienced a significant 25% growth from last year. I'd put this down to base effects, however, given the compressed sales numbers out of China for XRAY this time last year.
Moving down the P&L, it clipped EBITDA margin of 17.7%, driven by sales growth and the cost efficiencies mentioned earlier (supply chain, etc.). It pulled this down to adj. EPS of $0.51, with ~$0.2 of FX headwind baked into this.
Figure 2.
As to the divisional breakdown, the major takeouts are as follows:
- The connected technology solutions segment, or CTS for short, was up 2.8% YoY to $309mm and benefited from 1) improved supply chain efficiency, and 2) reduced lead times for specific high-tech equipment. This uptick was somewhat offset by softer demand in Europe (not surprising given the weakness in Europe's core healthcare markets this year). Within CTS, XRAY's CAD/CAM business faced a mid-single-digit decline given the weakness in Europe—mainly Germany, a key medical device market for XRAY and all its peers.
- Meanwhile, organic growth in the equipment & instruments business was ~70bps YoY, powered by the performance of its treatment and imaging centres in Europe . This was propped by demand (volumes) across all product categories in APAC, fitting the China points outlined earlier. Management also reported preventative consumables were strong in the U.S. during the quarter, something to consider for H2 FY'23.
- In the essential dental solutions business, which includes its Endo, Resto, and preventive products lines, sales growth was again 70bps on last year and hit $377mm . It was the leading segment in absolute revenue terms. U.S. demand again lifted the segment's performance, that was again offset by the softer European performance.
- Finishing with the orthodontic and implant solutions segment, sales were up 3.7% to $270mm. Aligners continued its robust growth streak for the fourth consecutive quarter, driven by the SureSmile and Byte divisions. Critically, SureSmile was up ~20% YoY. Unlike its compadre's listed above, this segment saw rapid adoption in Europe—with sales growth exceeding 50% in the bloc. In fact, in my opinion, the global adoption SureSmile is a talking point, having now reached more than 55 countries. Given the drags on top-line performance from the other segments (i.e., single-digit upsides on 2022 and 2021), SureSmile could be one to watch in the coming periods.
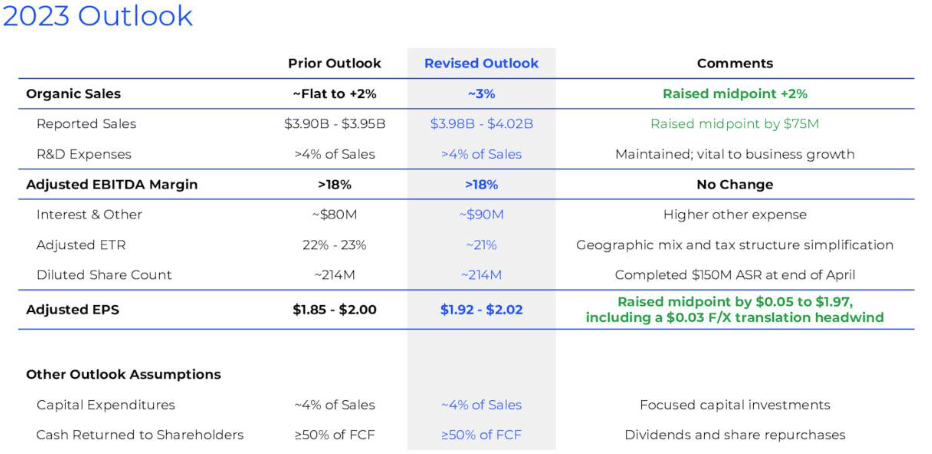
Management are more optimistic of momentum coming out of H2 FY'23 as well. It revised the full-year sales outlook to a new range of $3.98Bn—$4.02Bn. You're looking at $4Bn at the midpoint on this, calling for 300bps growth at the top line for FY'23.
Figure 3.
2. Capital budgeting and capital productivity
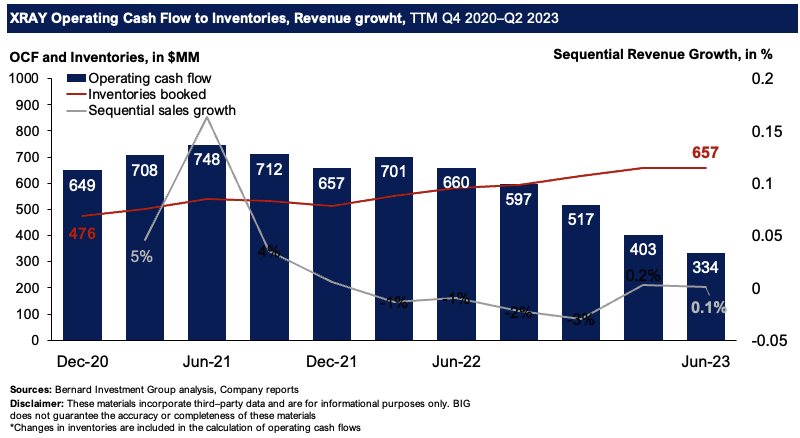
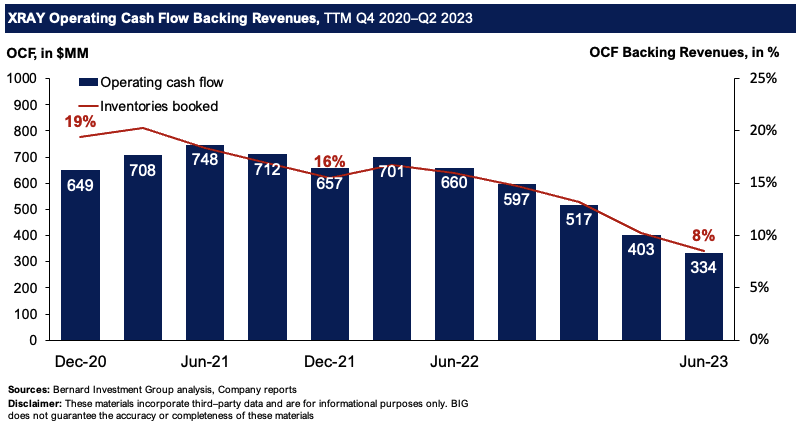
XRAY printed OCF of $104mm in Q2 versus $173mm last year, in continuation of a longer-term down trend that's been in situ since mid-2021. This was primarily influenced by shifts in working capital, the timing of cash collections, and accounts paid relative to the prior year. Figure 4 shows the company's trailing OCF respective to the inventories booked each quarter, along with the sequential growth/decline in sales (TTM basis). Three facts are immediately obvious.
One is that XRAY is realizing ~48.5% less in cash flows vs. 2020, and ~50% less than Q2 FY'22 on a TTM basis. At the same time, inventories booked on the balance sheet—which are recorded every quarter, and not in TTM format—have steadily walked higher, from $476mm in 2020 to $657mm last quarter. This, as the pace of sequential sales growth has slowed tremendously.
Figure 4.
Critically, this tells me the firm isn't printing cash flows at a respective rate that suggests "cash revenues" are sustainable. The amount of OCF backing revenues has slipped from 19% in 2020 to just 8% last quarter using TTM figures. To me this is not attractive, because 1) you aren't getting the pull-through of revenues booked forward into actual cash flows to run the business, and 2) inventories are climbing faster than sales and cash flows, indicating actual sales conversion is slowing. Either way, these are red flags for me, and corroborate a neutral view.
Figure 5.
Capital productivity and the pull-through to shareholder value is also a red flag in my profiling of XRAY. How's this so?
One, XRAY distributed $30mm to shareholders through dividends in Q2 ($0.14/share), bringing the capital return to $207mm this YTD via dividends and buybacks. You're at a 1.5% forward yield on at the current market value as I write, thus, not attractive past cash, which returns ~4–5% at present. Hence, dividend offerings aren't enough to get me over the line here.
Figure 6.
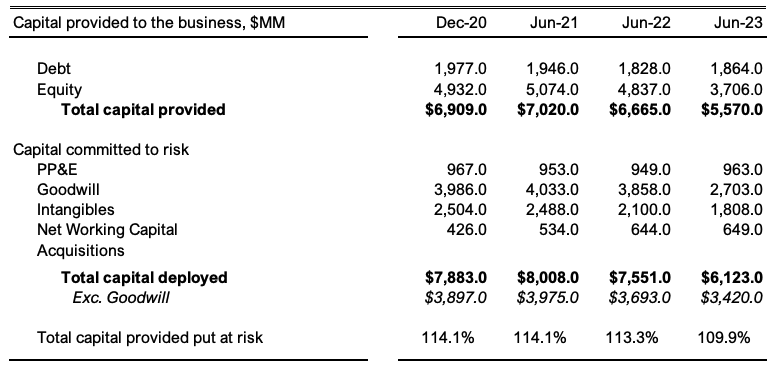
Two, $486mm in TTM earnings after-tax were produced on $6.12Bn of capital employed into the business last period. The result is a paltry 7.9% return on capital at risk, well below the required hurdle rate of ~12% in my playbook (long-term market averages). Thus, XRAY didn't recycle $1 of its own capital into more than $1 of market value. As a reminder, a positive spread in a company's return on capital and the opportunity cost of capital is a fundamental indicator of value creation for investors. The failure of XRAY in doing this is well supported by the flat market returns exhibited since my July 2022 report on the company.
Figure 7.
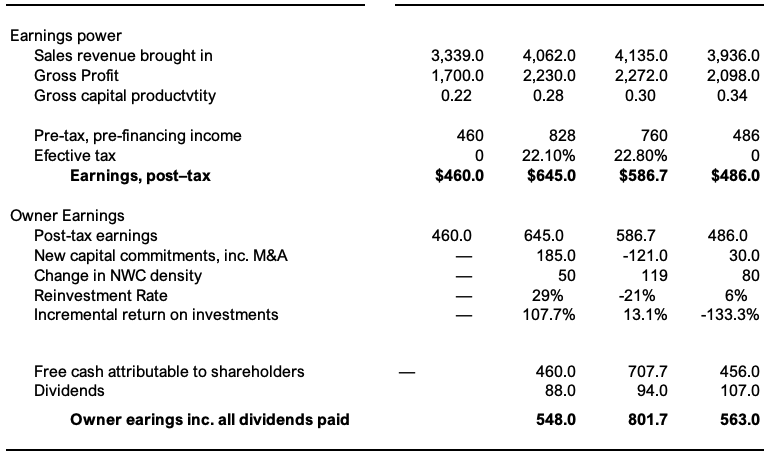
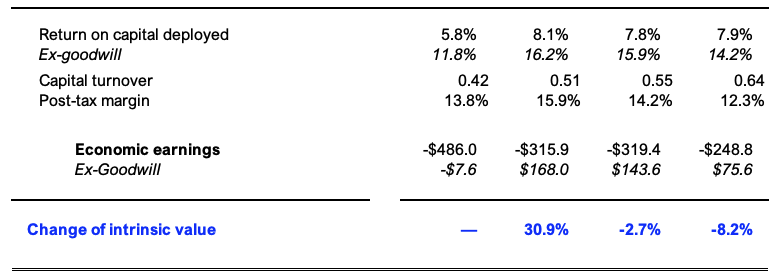
Three, the firm spun off ~$563mm in cash to its shareholders over the 12 months to Q2 FY'23, including the dividends paid up. You can see the firm's post-tax margins and capital turnover are both relatively weak. It is therefore employing neither a cost differentiation or cost leadership position to drive additional sales and/or profits. This explains the low capital productivity outlined above and correlates to a series of economic losses for shareholders since 2021 at least. It has therefore compounded its intrinsic value at a negative rate of 8% over this time frame.
Figure 8.
Valuation and conclusion
The stock sells at 19x forward earnings and 13x forward EBITDA, and you'll be paying $2.20 for every $1 in book value to buy XRAY today. At 13x forward management's FY'23 EBITDA guidance, this gets you to $44.20 per share in implied market value (13x$720/211.7 = $44.20). This assumes that 1) the market has correctly discounted all known expectations into the 13x multiple, and 2) the company hits its FY'23 forecasts. This correlates to a 17% margin of safety/value gap, not enough to get me interested at this stage. I'd be looking to EBITDA of $800mm—30% margin of safety— to find the valuation attractive. Even then, I'd be questioning the value of XRAY's growth patterns, given it returns just 7–8% trailing return on capital each period. Note these findings are well supported by objective data from the quant system , that also rates XRAY a hold on a composite of factors.
Figure 9.
In short, detailed inspection of XRAY's investment prospects reveals several headwinds to entering long. For one, cash revenues are dwindling and at 3-year lows. Second, ~$6.1Bn in capital at risk produces just $486mm in post-tax earnings, c.8% return on the capital deployed. If you're going to pay $2.20 for every $1 in net asset value, you'd want the capital underlying this to be tremendously productive. The data reveals it is not. Added to that, there are multiple selective opportunities one would overlook in allocating to XRAY today at these unfavourable economic characteristics. Net-net, reiterate hold.
For further details see:
Dentsply Sirona: 8% Return On Capital Deployed, Economic Losses, Reiterate Hold Thesis