CSB - DES: Unexciting Historical Returns And Dividend Growth In Small Caps
2023-09-29 17:20:34 ET
Summary
- WisdomTree U.S. SmallCap Dividend Fund ETF holds 600+ dividend-paying small and micro-caps.
- The DES ETF is well-diversified across sectors but underweights technology and healthcare.
- DES has lagged a small-cap benchmark since 2006, and distributions have not kept pace with inflation in the last 10 years.
This article series aims at evaluating ETFs (exchange-traded funds) regarding the relative past performance of their strategies and metrics of their current portfolios. Reviews with updated data are posted when necessary.
DES Strategy and Portfolio
WisdomTree U.S. SmallCap Dividend Fund ETF ( DES ) started investing operations on 6/16/2006 and tracks the WisdomTree U.S. SmallCap Dividend Index. It has 615 holdings, an SEC yield of 3.21%, and a total expense ratio of 0.38%. Distributions are paid monthly. The underlying index
" is comprised of the companies that compose the bottom 25% of the market capitalization of the WisdomTree U.S. Dividend Index after the 300 largest companies have been removed. The index is dividend weighted annually ."
The fund invests exclusively in U.S. companies, with about half of the asset value in small caps and half in micro caps (in Fidelity classification). In this article, the S&P Small Cap 600 Index, represented by iShares Core S&P Small-Cap ETF ( IJR ), will be used as a benchmark.
The heaviest sectors are financials (21.5% of assets), industrials (18.6%), and consumer discretionary (14.3%), like in IJR. Other sectors are below 10%. Compared to IJR, DES massively underweights healthcare and technology. It slightly overweights all other sectors.
Sector breakdown (chart: author; data: WisdomTree, iShares)
The fund is well-diversified: only 8.6% of asset value is in the top 10 holdings, listed below with fundamental ratios. The top name weighs 1.17%, so risks related to individual companies are very low.
| Ticker |
| Name |
| Weight |
| EPS growth % TTM |
| PE TTM |
| PE fwd |
| Yield % |
| CONSOL Energy Inc. |
| 1.17% |
| 502.26 |
| 4.97 |
| 4.96 |
| 4.19 |
| Arch Resources, Inc. |
| 0.97% |
| -6.32 |
| 3.79 |
| 6.61 |
| 11.65 |
| EPR Properties |
| 0.94% |
| 3.06 |
| 22.38 |
| 19.61 |
| 7.91 |
| Cogent Communications Holdings |
| 0.92% |
| 2414.23 |
| 2.70 |
| 2.99 |
| 5.94 |
| Radian Group Inc. |
| 0.91% |
| 5.16 |
| 6.18 |
| 7.26 |
| 3.55 |
| M.D.C. Holdings, Inc. |
| 0.76% |
| -38.95 |
| 7.77 |
| 8.36 |
| 5.26 |
| California Resources Corp. |
| 0.74% |
| 19.53 |
| 4.77 |
| 11.27 |
| 1.95 |
| Greif, Inc. |
| 0.74% |
| 4.46 |
| 10.19 |
| 11.57 |
| 3.06 |
| Sabra Health Care REIT, Inc. |
| 0.72% |
| -386.03 |
| N/A |
| 45.71 |
| 8.57 |
| Jackson Financial, Inc. |
| 0.69% |
| -93.01 |
| 8.61 |
| 2.72 |
| 6.50 |
Historical performance
Since inception in 2006, the fund has underperformed the S&P 600 index by 1.75% annualized. It also shows a deeper maximum drawdown.
| Tot. Return |
| Annual.Return |
| Drawdown |
| Sharpe Ratio |
| Volatility |
| DES |
| 201.32% |
| 6.60% |
| -65.48% |
| 0.36 |
| 20.73% |
| IJR |
| 299.63% |
| 8.35% |
| -58.15% |
| 0.45 |
| 20.00% |
Data calculated with Portfolio123.
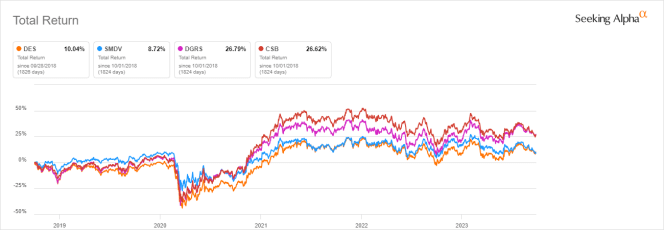
The next chart plots the 5-year returns of DES and three other small-cap dividend ETFs:
- ProShares Russell 2000 Dividend Growers ETF ( SMDV ),
- WisdomTree U.S. SmallCap Quality Dividend Growth Fund ( DGRS ),
- VictoryShares US Small Cap High Dividend Volatility Wtd ETF ( CSB ).
DES is a bit ahead of SMDV, but significantly behind DGRS and CSB.
DES vs. Competitors, 5-year total return ( Seeking Alpha)
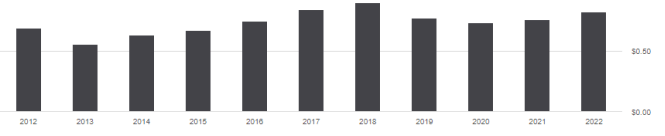
From 2012 to 2022, the annual sum of distributions has increased from $0.69 to 0.82% per share. The dividend growth, 18.8% in 10 years, couldn't keep pace with inflation: 29% at the same time, based on CPI.
DES distributions (Seeking Alpha)
DES Vs. a reference strategy based on dividend and quality
In previous articles, I have shown how three factors may help cut the risk in a dividend portfolio: Return on Assets , Piotroski F-score , and Altman Z-score .
The next table compares DES since inception with subsets of the S&P 500 and the S&P 600: stocks with a dividend yield above the average of their respective indexes, an above-average ROA, a good Altman Z-score, a good Piotroski F-score, and a sustainable payout ratio. Subsets are rebalanced annually to make them comparable with a passive index.
| Tot. Return |
| Annual.Return |
| Drawdown |
| Sharpe Ratio |
| Volatility |
| DES |
| 201.32% |
| 6.60% |
| -65.48% |
| 0.36 |
| 20.73% |
| Small cap reference subset |
| 584.02% |
| 11.78% |
| -50.14% |
| 0.6 |
| 19.45% |
| Large cap reference subset |
| 511.40% |
| 11.05% |
| -41.97% |
| 0.69 |
| 15.42% |
Past performance is not a guarantee of future returns. Data Source: Portfolio123.
DES lags this dividend and quality strategy in both large cap and small cap universes. It also shows a deeper drawdown and higher volatility. However, ETF performance is real, whereas the subsets are hypothetical simulations. My core portfolio holds 14 stocks selected in the large cap subset (more info at the end of this post).
Scanning DES portfolio
DES is a bit cheaper than the S&P 600 regarding valuation ratios:
| DES |
| IJR |
| Price/Earnings |
| 11.35 |
| 13.18 |
| Price/Book |
| 1.51 |
| 1.67 |
| Price/Sales |
| 0.84 |
| 0.92 |
| Price/Cash Flow |
| 7 |
| 8.54 |
Data: Fidelity.
According to my calculations reported in the next table, aggregate Altman and Piotroski scores are close to the benchmark, while the return on assets is much better.
| DES |
| IJR |
| Altman Z-score |
| 3.19 |
| 2.83 |
| Piotroski F-score |
| 5.29 |
| 5.32 |
| ROA % TTM |
| 7.21 |
| 3.87 |
Data calculated on the 300 largest holdings representing 80% of asset value.
In my ETF reviews, risky holdings are companies with at least 2 red flags: bad Piotroski score, negative ROA, unsustainable payout ratio, bad or dubious Altman Z-score, excluding financials and real estate where these metrics are unreliable. Based on this assumption, about 11% of assets is in risky stocks, which is not very good, yet acceptable.
Takeaway
WisdomTree U.S. SmallCap Dividend Fund ETF invests in a large number of small and micro-cap companies weighted based on dividends. The fund is diversified across sectors and holdings. Compared to a small cap benchmark, DES is much lighter in technology and healthcare. It is also slightly superior regarding both valuation and quality metrics. However, historical return is underwhelming and distributions have not kept pace with inflation.
For further details see:
DES: Unexciting Historical Returns And Dividend Growth In Small Caps